


ServiceNow Inc Stock (NOW) Closed Up by 7.41% on Sep 14: A Full Analysis
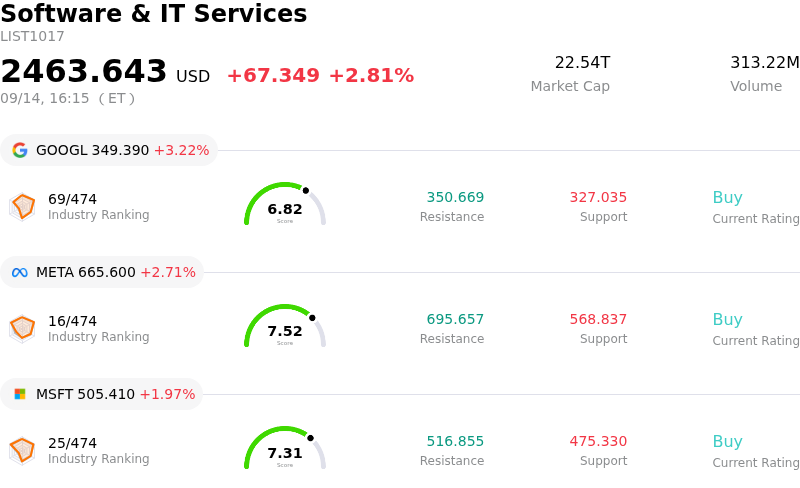
ServiceNow Inc (NOW) closed up by 7.41%. The Software & IT Services sector is up by 2.81%. The company outperformed the industry. Top 3 stocks by turnover in the sector: Alphabet Inc Class A (GOOGL) up 3.22%; Meta Platforms Inc (META) up 2.71%; Microsoft Corp (MSFT) up 1.97%.
What is driving ServiceNow Inc (NOW)’s stock price up today?
A primary catalyst for ServiceNow's strong upward momentum stems from a broader sector rotation within the technology landscape. Following recent commentary from prominent artificial intelligence leaders advocating for a more measured pace in capability advancement to address safety protocols, investors reassessed the immediate threat of AI disruption to traditional software platforms. Easing concerns over seat-based model cannibalization sparked a clear capital reallocation away from overextended hardware and semiconductor equities back into established enterprise software providers.
Bullish Wall Street sentiment further fueled the advance through a wave of positive analyst revisions. Major research institutions, including Needham and BTIG, issued price target increases while maintaining positive ratings on the stock. Analysts cited expanding enterprise demand for the company's AI-enabled workflow tools and durable subscription revenue growth as core catalysts for continued market outperformance, encouraging institutional buying.
Underpinning this market enthusiasm is ServiceNow's solid fundamental operational execution and growing AI monetization narrative. The company has seen rapid enterprise adoption of its agentic AI offerings and governance solutions, driven by expanding adoption among enterprise clients seeking a unified platform to manage complex workflows. Combined with robust renewal rates and a high-margin subscription business, ServiceNow remains well-positioned to capture enterprise technology spending as corporations scale their AI implementations.
Technical Analysis of ServiceNow Inc (NOW)
Technically, ServiceNow Inc (NOW) shows a MACD (12,26,9) value of -1.945, indicating a neutral signal. The RSI at 60.420 suggests neutral condition and the Williams %R at 26.154 suggests buy condition. Please monitor closely.
Media Coverage of ServiceNow Inc (NOW)
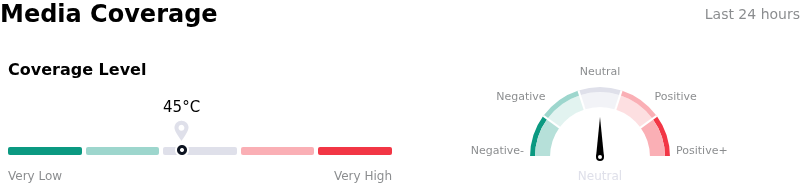
In terms of media coverage, ServiceNow Inc (NOW) shows a coverage score of 45, indicating a moderate level of media attention. The overall market sentiment index is currently in neutral zone.
Fundamental Analysis of ServiceNow Inc (NOW)
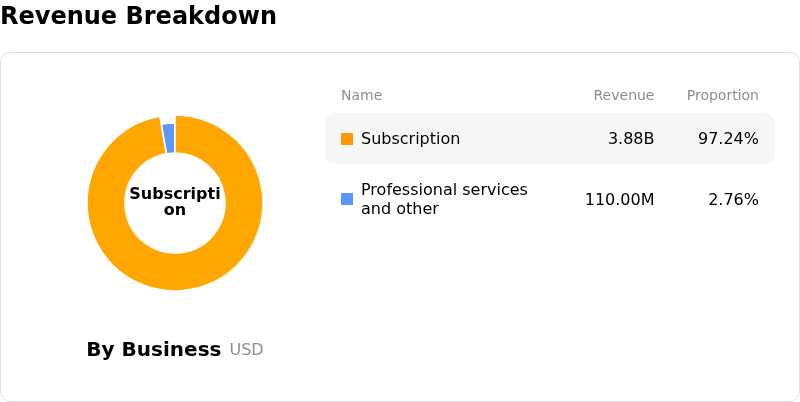
ServiceNow Inc (NOW) is in the Software & IT Services industry. Its latest annual revenue is $13.28B, ranking 28 in the industry. The net profit is $1.75B, ranking 30 in the industry. Company Profile
Over the past month, multiple analysts have rated the company as Buy, with an average price target of $147.89, a high of $248.00, and a low of $72.00.
More details about ServiceNow Inc (NOW)
Company Specific Risks:
- Margin Compression and Debt Expansion: Amortization of intangible assets and integration costs from recent acquisitions, including Armis, Moveworks, and Sweep, have compressed GAAP subscription gross margins down to 73.5% (from 80%) and contributed to a 54.75% year-over-year decline in operating income, while total net debt has expanded to $8.45 billion.
- Elevated AI Infrastructure and Compute Costs: Rapid scaling of enterprise agentic AI capabilities (exceeding $1 billion in Annual Contract Value) is driving up underlying compute and infrastructure expenses, threatening to slow margin recovery if deal integration drags on.
- Enterprise Data Security and Governance Concerns: Management acknowledged persistent customer hesitation regarding data security, governance, and administrative oversight when deploying automated AI workflows, creating potential headwinds for enterprise deployment timelines.
- Valuation Multiples and Profit-Taking Volatility: Recent intraday price swings and profit-taking near technical resistance levels ($138–$141) highlight market vulnerability, as institutional investors reassess whether AI growth acceleration can offset softer near-term operating margin guidance.
Recommended Articles


