


Whether a Bubble Exists in U.S. Stocks Is Not Important!
1. Introduction
TradingKey - The recent sharp volatility and downward trend in U.S. stocks have sparked market panic, with analysts and investors widely debating whether a bubble exists in the U.S. equity market. However, in our view, the core question is not whether a bubble exists, but rather which stage of the bubble the market is currently in. Looking back at history, the dot-com bubble of the late 1990s gradually took shape and continued to escalate. Yet during the final phase of the bubble (from early 1999 to March 2000), the Nasdaq Composite Index still soared by 129% (Figure 1). Long-only investors who set stop-loss levels at that time likely reaped substantial returns. This article will start with an analysis of the current stage of the U.S. stock bubble, focusing on valuation levels, investor sentiment, the profitability of AI enterprises, and the Federal Reserve's monetary policy.
However, a classic metaphor persists in financial markets: the economy is like a pedestrian moving forward, while the stock market resembles a leashed pet dog. In the short term, the dog may dart ahead of the pedestrian (corresponding to overvaluation) or fall behind (corresponding to undervaluation), but over the long run, it will always align with the pedestrian's direction. This implies that focusing solely on the stock market's short-term fluctuations while decoupling from the economic fundamentals is tantamount to confusing the means with the end. Building on this premise, the following section of this report will analyse the endogenous demand, exogenous demand, and macroeconomic landscape of the AI industry to assess the current stage of bubble development in the sectoral economy.
Finally, based on a comprehensive analysis of financial markets and industry economics, our research conclusions are as follows: Despite the bubble characteristics exhibited by U.S. stocks amid the AI narrative, the market is still in the mid-stage of the bubble (analogous to the 1997-1998 internet boom period), with a considerable distance from the late bubble phase. In light of this, investors should strictly adhere to trading rules, reasonably set stop-loss levels, and participate in the current market rally under the premise of effective risk control.
Figure 1: Nasdaq Index During the Dot-Com Bubble
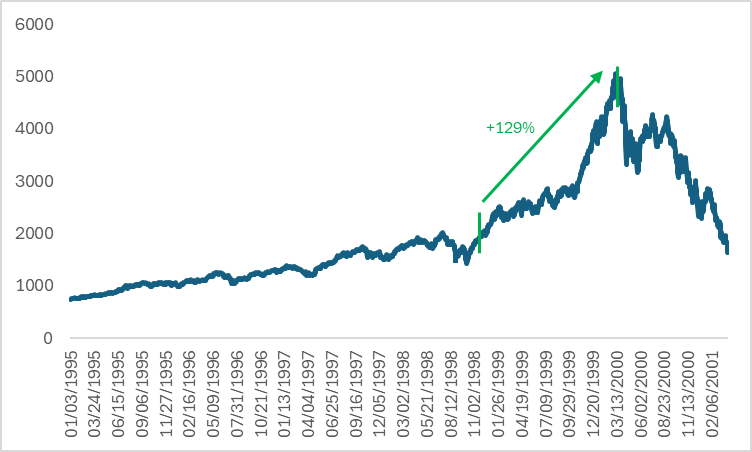
Source: Refinitiv, TradingKey
2. At Which Stage Is the U.S. Stock Market Bubble?
This chapter conducts a comparative analysis between the current U.S. stock market bubble and the dot-com bubble era. Our conclusion indicates that even if a bubble exists in the current U.S. stock market, its severity is far from reaching the peak level seen in 2000. The core arguments are as follows: First, the price-to-earnings (P/E) ratio of the Nasdaq 100 Index has been on a gradual upward trend since mid-2014 and has now exceeded 34x. However, this figure remains significantly lower than the peak of 72x recorded during the dot-com bubble (Figure 2.1). Second, the AAII Investor Sentiment Survey—compiled weekly by the American Association of Individual Investors (AAII)—measures individual investors' bullish, bearish, and neutral attitudes toward the U.S. stock market, serving as a key benchmark for retail investor sentiment. Amid the recent weakness in U.S. equities, investor sentiment has cooled markedly: the current net bullish ratio has fallen into negative territory, a stark contrast to the 46% level observed in early 2000. This suggests that investor sentiment has not yet reached the extreme exuberance witnessed during the dot-com bubble.
Third, there is a striking contrast in corporate profitability between the 2000 dot-com bubble era and the current AI industry boom phase. The core feature of the dot-com bubble was "story-driven valuation," where a large number of companies lacked profitability and even pursued growth at the cost of losses. The market at that time abandoned the traditional valuation framework and instead chased virtual metrics such as user numbers. In contrast, current AI enterprises exhibit a distinct characteristic of "profit-driven growth," with leading players delivering robust financial fundamentals. The year-on-year revenue growth rate of the Magnificent Seven U.S. tech giants has been on a steady upward trajectory since Q3 2023, with an average of 14.5%, and is projected to remain above 15% in Q1 2026. This earnings support has laid a solid foundation for the sustained upward movement of U.S. stocks, particularly tech giants.
Finally, a review of the dot-com bubble era: After three consecutive interest rate cuts in 1998, the Federal Reserve initiated a rate-hiking cycle in June 1999 to address elevated inflationary pressures. By May 2000, the Fed had implemented six rate hikes totalling 175 basis points. In the current market environment, following a pause in its rate-cutting cycle at the end of 2024, the Fed resumed rate cuts in September 2025 (Figure 2.2). As the pass-through effect of tariffs on inflation has been significantly lower than market expectations, current inflation remains within a manageable range. Against the backdrop of a persistently soft labour market, we anticipate there is room for three additional rate cuts in this cycle. Coupled with the Fed's halt of quantitative tightening (QT) and potential resumption of quantitative easing (QE), market liquidity will be further unleashed, thereby providing favourable support for U.S. equities. In summary, compared with the dot-com bubble period, the current pricing logic for the AI sector in the U.S. stock market and individual investor sentiment are more rational. Supported by both manageable inflation and sustained accommodative monetary policy, U.S. equities are highly likely to set new all-time highs again.
Figure 2.1: Nasdaq 100 Index P/E Ratio
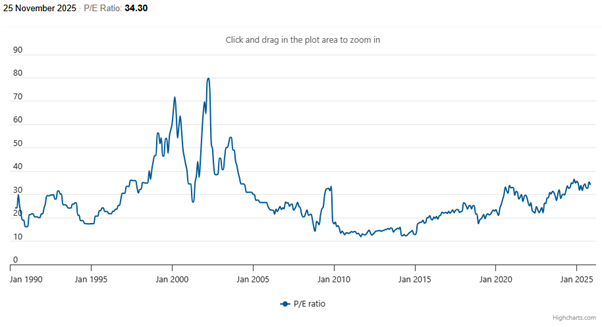
Source: World PE Ratio, TradingKey
Figure 2.2: Fed Policy Rate (%)
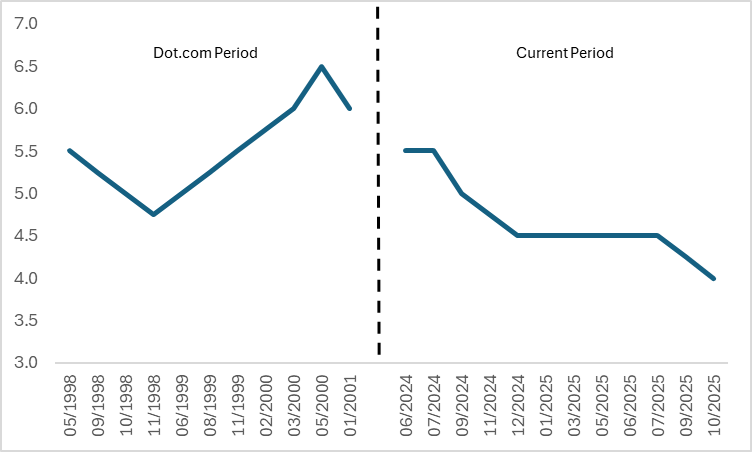
Source: Refinitiv, TradingKey
3. At What Stage Is the AI Industry Bubble?
While investors focus on stock market fluctuations and bubble risks, as analogised earlier — the economy is like a human, and finance is like a pet dog. When assessing stock market bubbles, researching industry-specific economic bubbles is equally crucial; otherwise, one may fall into the trap of prioritising trivialities over fundamentals. To determine whether a bubble exists in the current AI industry, the core lies in analysing its current demand scale and future growth potential. This question can be further decomposed into two dimensions: the endogenous demand from enterprises for cost reduction and efficiency improvement, and the exogenous demand driven by the expansion of AI application scenarios.
On the dimension of endogenous demand, the iteration of AI technology has enabled enterprises to achieve significant cost savings. According to research data from McKinsey, surveyed companies reported that current AI applications can reduce operating costs by approximately 10%. Taking S&P 500 constituent companies as the calculation sample, among their total selling, general and administrative (SG&A) expenses of $3 trillion, around $300 billion in cost savings are expected through AI adoption (a rough estimate based on the 10% ratio). Beyond cost control, AI's impact on productivity improvement is equally prominent: since 2023, labour productivity in the business sector has increased by 5.6%, outpacing the growth rate during the 1995-2000 internet revolution. In summary, the ongoing AI revolution has delivered substantial results in driving cost reduction and efficiency gains—core areas of endogenous demand.
In terms of extended exogenous demand, the ability of AI technology to spawn more extended application scenarios hinges on the rate of adoption growth and depth of penetration; data shows that since the launch of ChatGPT, the adoption rate of generative AI has surged to approximately 80%, with a significantly faster pace than that of the internet during its early and middle development stages, a phenomenon that indicates higher market acceptance and faster implementation progress for AI technology, which is expected to lay the foundation for the further release of downstream application demand. From the perspective of industry demand distribution, AI adoption is particularly high in sectors such as information technology, professional and technical services, and corporate management, while the accommodation and catering, and transportation and warehousing industries have relatively lower adoption rates, and we anticipate that over the next few years, as AI technology continues to mature and application scenarios expand, its penetration in non-technical and non-professional sectors will increase substantially.
From a macro perspective, whether measured by the expenditure approach or production approach to GDP accounting, AI's current contribution to GDP growth outpaces that of the internet to the overall economy in the 2000s. From the expenditure-side perspective, real GDP grew at an average annualised quarter-on-quarter rate of 1.6% in H1 2025, with tech investment contributing 0.9 percentage points—nearly matching the 1.1 percentage points from private consumption. From the production-side calculation, the tech sector accounted for approximately 0.95 percentage points of the 1.6% overall GDP growth during the same period, representing a contribution ratio of around 59%—significantly higher than the average 25% during the internet era (Figure 3). The tech industry's strong contribution momentum is expected to continue underpinning overall GDP growth, while steady economic advancement will further expand the market demand for AI.
AI demand has delivered tangible results in terms of endogenous cost reduction and efficiency improvement. Driven by the virtuous cycle between technology and GDP growth, the exogenous demand on the application side is expected to maintain a high-growth trajectory. In summary, based on AI's current demand structure and future growth potential, even if there is a bubble in the industry, it is far from the late stage of the bubble cycle. Furthermore, the economic fundamentals of this sector further confirm that the probability of a U.S. stock market bubble burst within the next 12 months remains extremely low.
Figure 3: U.S. Tech Sector Contribution to GDP Growth (%)
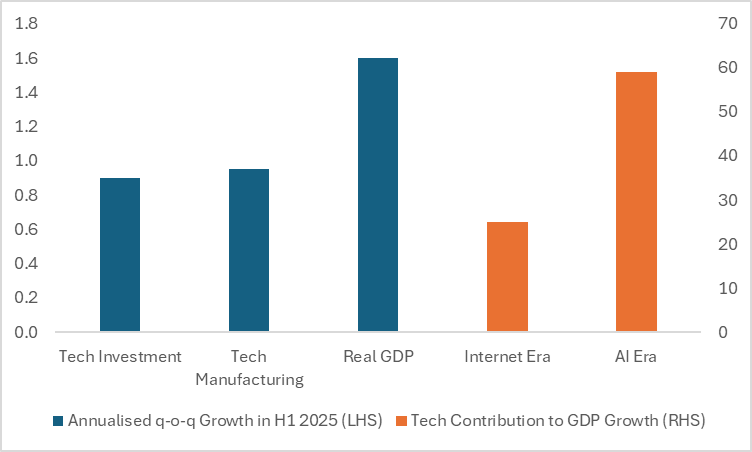
Source: Refinitiv, TradingKey
4. Conclusion
In summary, whether a bubble exists in the U.S. stock market is not the core issue—the phase of the bubble's evolution is what matters most, and based on the comprehensive analysis of financial markets and sectoral economies outlined above, our research concludes that while the AI narrative has driven the U.S. stock market to exhibit bubbly characteristics, the current market remains in the mid-stage of the bubble (analogous to the internet boom period of 1997-1998) with considerable room before reaching the late bubble phase. Against this backdrop, investors should adhere strictly to trading disciplines, set reasonable stop-loss levels, and participate in the current market rally on the premise of effectively controlling risks.
Recommended Articles


