


EUR/USD ticks lower amid mixed German Retail Sales data
- The Euro eases to 1.1585 after failing to regain the 1.1600 level.
- The pair is on track for a 0.6% weekly gain, favoured by a weaker US Dollar.
- Growing hopes of Fed interest rate cuts keep USD rallies limited.
EUR/USD is ticking lower on Friday, trading at 1.1585 at the time of writing, yet on track to a nearly 0.6% advance this week, as the US Dollar struggled due to rising bets that the US Federal Reserve will lower interest rates further in December.
German data has been mixed. Retail Sales declined against expectations in October, while the Import Price Index came above forecasts. The impact on the Euro, however, was minimal, as investors' focus remains on the Fed's monetary policy plans.
Trading activity remains subdued on Friday, with US markets operating at half throttle amid the Thanksgiving festivities and an outage at CME Group's data center, which disrupted trade on its currency platform.
The US economic calendar is void this Friday, while in Europe, preliminary German inflation and employment figures and a speech by the President of the Bundesbank and ECB member Joachim Nagel might provide some guidance for the Euro.
Euro Price Today
The table below shows the percentage change of Euro (EUR) against listed major currencies today. Euro was the strongest against the British Pound.
| USD | EUR | GBP | JPY | CAD | AUD | NZD | CHF | |
|---|---|---|---|---|---|---|---|---|
| USD | 0.08% | 0.15% | 0.05% | 0.04% | 0.06% | 0.13% | -0.01% | |
| EUR | -0.08% | 0.07% | -0.07% | -0.03% | -0.02% | 0.04% | -0.10% | |
| GBP | -0.15% | -0.07% | -0.12% | -0.11% | -0.13% | -0.06% | -0.15% | |
| JPY | -0.05% | 0.07% | 0.12% | 0.03% | 0.03% | 0.09% | -0.04% | |
| CAD | -0.04% | 0.03% | 0.11% | -0.03% | 0.00% | 0.06% | -0.07% | |
| AUD | -0.06% | 0.02% | 0.13% | -0.03% | -0.00% | 0.06% | -0.11% | |
| NZD | -0.13% | -0.04% | 0.06% | -0.09% | -0.06% | -0.06% | -0.13% | |
| CHF | 0.01% | 0.10% | 0.15% | 0.04% | 0.07% | 0.11% | 0.13% |
The heat map shows percentage changes of major currencies against each other. The base currency is picked from the left column, while the quote currency is picked from the top row. For example, if you pick the Euro from the left column and move along the horizontal line to the US Dollar, the percentage change displayed in the box will represent EUR (base)/USD (quote).
Rising hopes of Fed rate cuts are weighing on the US Dollar's recovery
- The US Dollar is picking up amid a mild rebound in US Treasury yields, but upside attempts remain limited. The US Dollar Index (DXY) is on track for its worst weekly performance since July. Investors are forecasting several Fed interest rate cuts over the next 12 months, while most of the world's major central banks, including the European Central Bank (ECB), have reached the end of their easing cycles.
- Macroeconomic data from Germany released earlier on Friday revealed that retail consumption contracted at a 0.3% pace in October, against market expectations of a steady 0.2% increase. Year on Year, German Retail Sales rose at a 0.9% pace, from an upwardly revised 0.8% in September.
- The German Import Price Index contracted 1.4% year-on-year in October, after a 1% fall in September, but above the 1.6% decline forecasted by the market. The monthly index grew 0.2%, at the same pace as in September, against expectations of a flat reading.
- In France, the Q3 Gross Domestic Product (GDP) confirmed the preliminary estimations of a 0.5% growth, while the CPI year-on-year remained steady, growing at a 0.8% pace in October, against market expectations of an acceleration to 1%.
- Later on Friday, the preliminary German Harmonized Index of Consumer Prices (HICP) is expected to have accelerated to a 2.4% year-on-year pace in November, from 2.3% in October, although the monthly reading is seen contracting 0.6% following a 0.3% rise in October.
Technical Analysis: EUR/USD resistance above 1.1600 is holding bulls
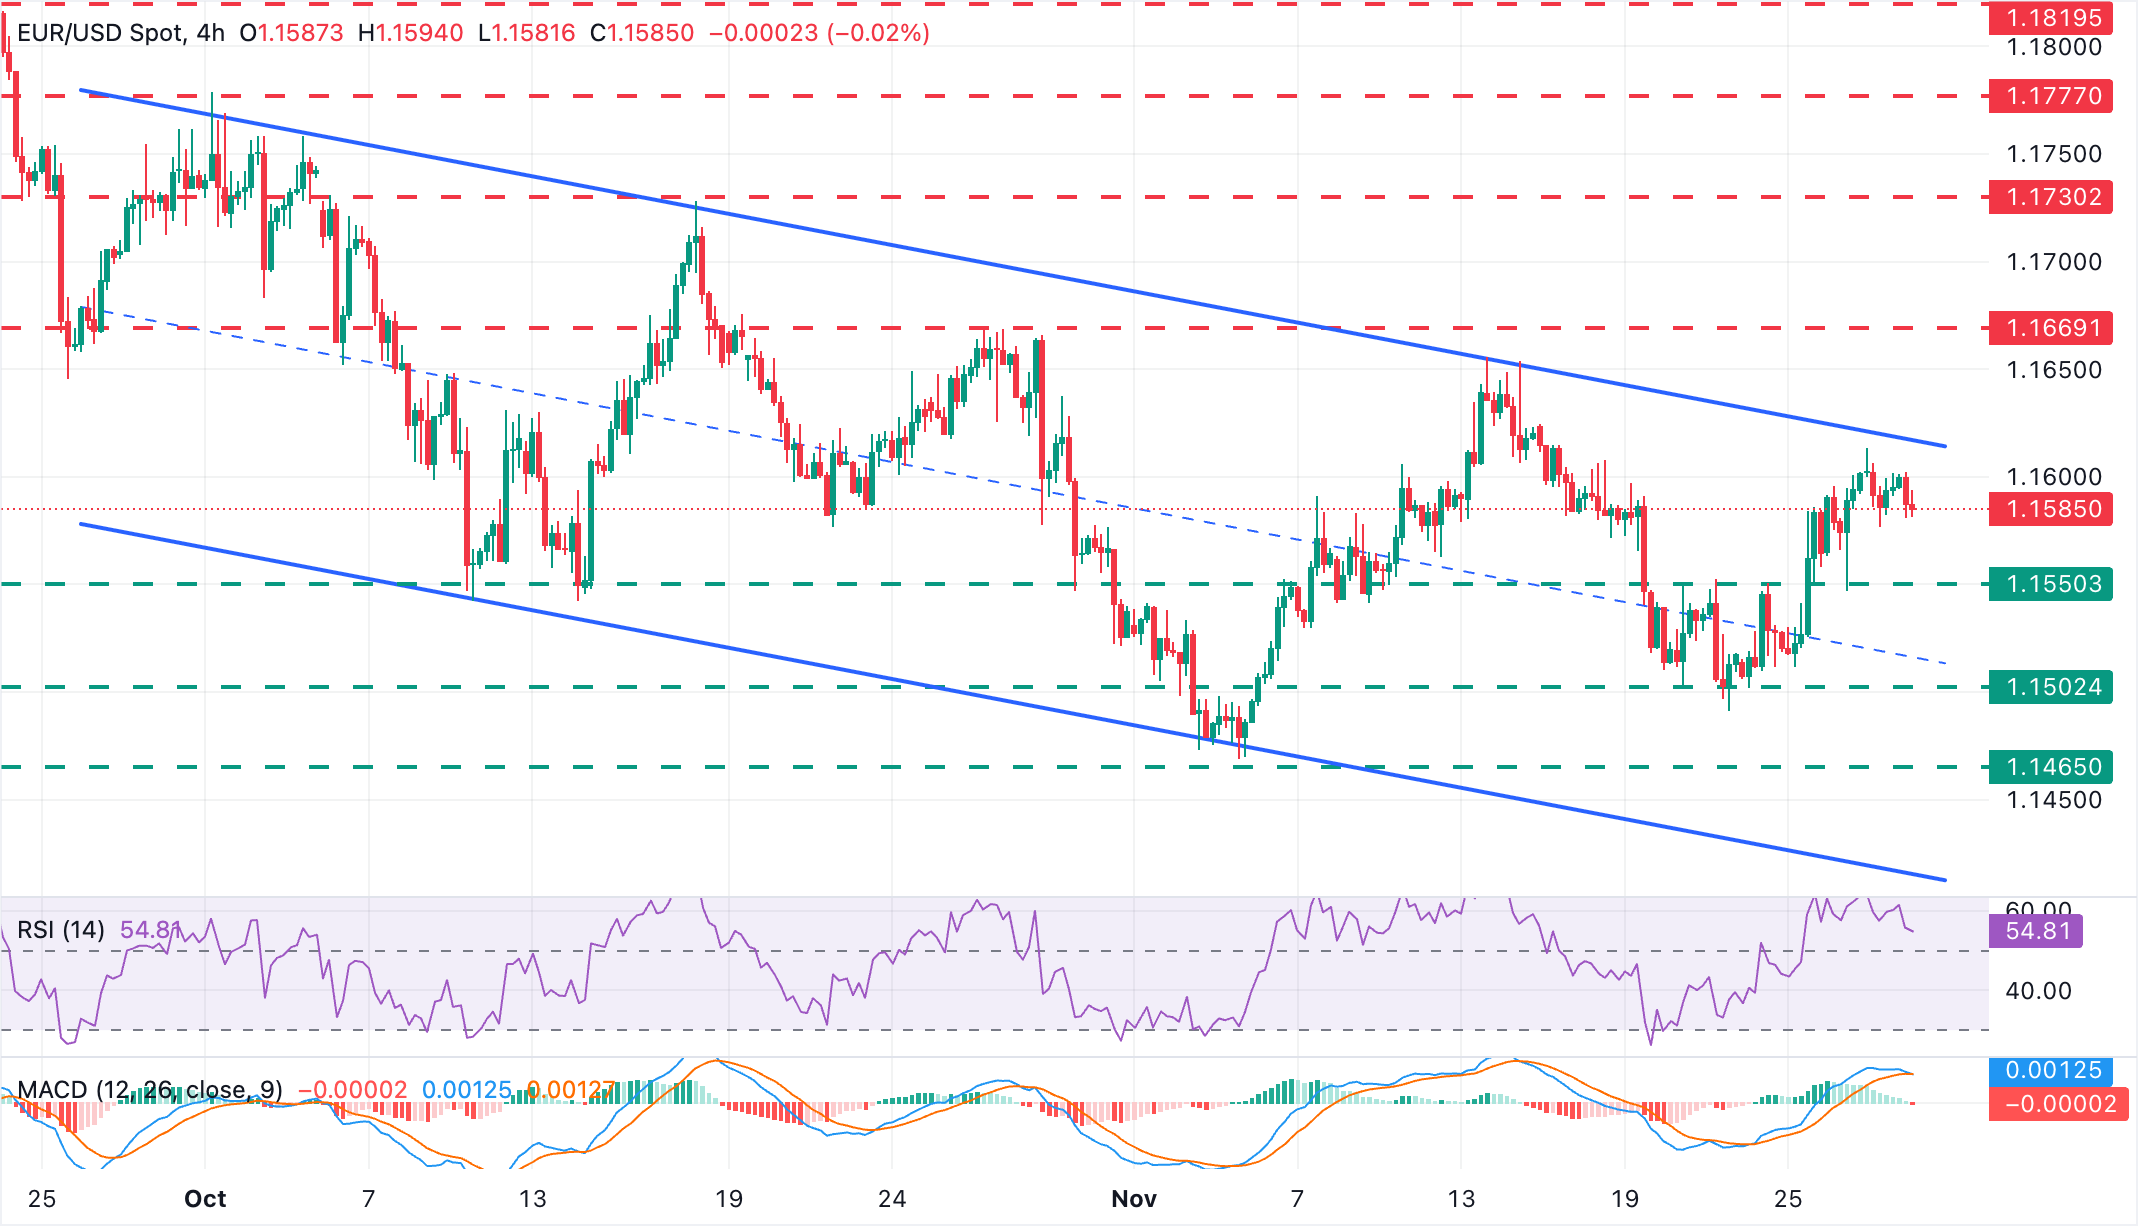
The EUR/USD rally from weekly lows near 1.1500 has been capped below the top of the descending channel from early October highs, now around 1.1615, and the pair is losing momentum on Friday. The 4-hour Relative Strength Index (RSI) is trending lower, although still above the 50 level, while the Moving Average Convergence Divergence (MACD) is crossing below the signal line, which highlights a fading bullish momentum.
Immediate support is at the previous resistance level of 1.1550 (around November 21 and 24 highs). Further down, the 1.1500 psychological level and the November 5 lows, near 1.1470, will challenge bears ahead of the channel bottom, now around 1.1420.
A bullish reaction, on the contrary, will need to break the mentioned channel top around 1.1615 to confirm a trend shift and bring the October 28 high, near 1.1670, into focus. Further up, the next target is the October 17 high, right below 1.1730.
Economic Indicator
Retail Sales (MoM)
The Retail Sales released by the Statistisches Bundesamt Deutschland is a measure of changes in sales of the German retail sector. It shows the performance of the retail sector in the short term. Percent changes reflect the rate of changes of such sales.The changes are widely followed as an indicator of consumer spending. The positive economic growth usually anticipates "Bullish" for the EUR, while a low reading is seen as negative, or bearish, for the EUR.
Read more.Last release: Fri Nov 28, 2025 07:00
Frequency: Monthly
Actual: -0.3%
Consensus: 0.2%
Previous: 0.2%
Source:
Economic Indicator
Retail Sales (YoY)
The Retail Sales released by the Statistisches Bundesamt Deutschland is a measure of changes in sales of the German retail sector. It shows the performance of the retail sector in the short term. Percent changes reflect the rate of changes of such sales.The changes are widely followed as an indicator of consumer spending. The positive economic growth anticipates "Bullish" for the EUR, while a low reading is seen as negative, or bearish, for the EUR.
Read more.Last release: Fri Nov 28, 2025 07:00
Frequency: Monthly
Actual: 0.9%
Consensus: 0.2%
Previous: 0.2%
Source: Federal Statistics Office of Germany
Recommended Articles


