


US Dollar Index Price Forecast: Drops to near 98.00, next support appears at nine-day EMA
- The US Dollar Index could test the initial support at the nine-day EMA of $97.70.
- Short-term price momentum remains strong as DXY holds above the nine-day EMA.
- The primary barrier appears at the descending channel’s upper boundary around $98.60.
The US Dollar Index (DXY), which measures the value of the US Dollar (USD) against six major currencies, is losing ground after registering gains in the previous four consecutive sessions and trading around 98.00 during the early European hours on Tuesday.
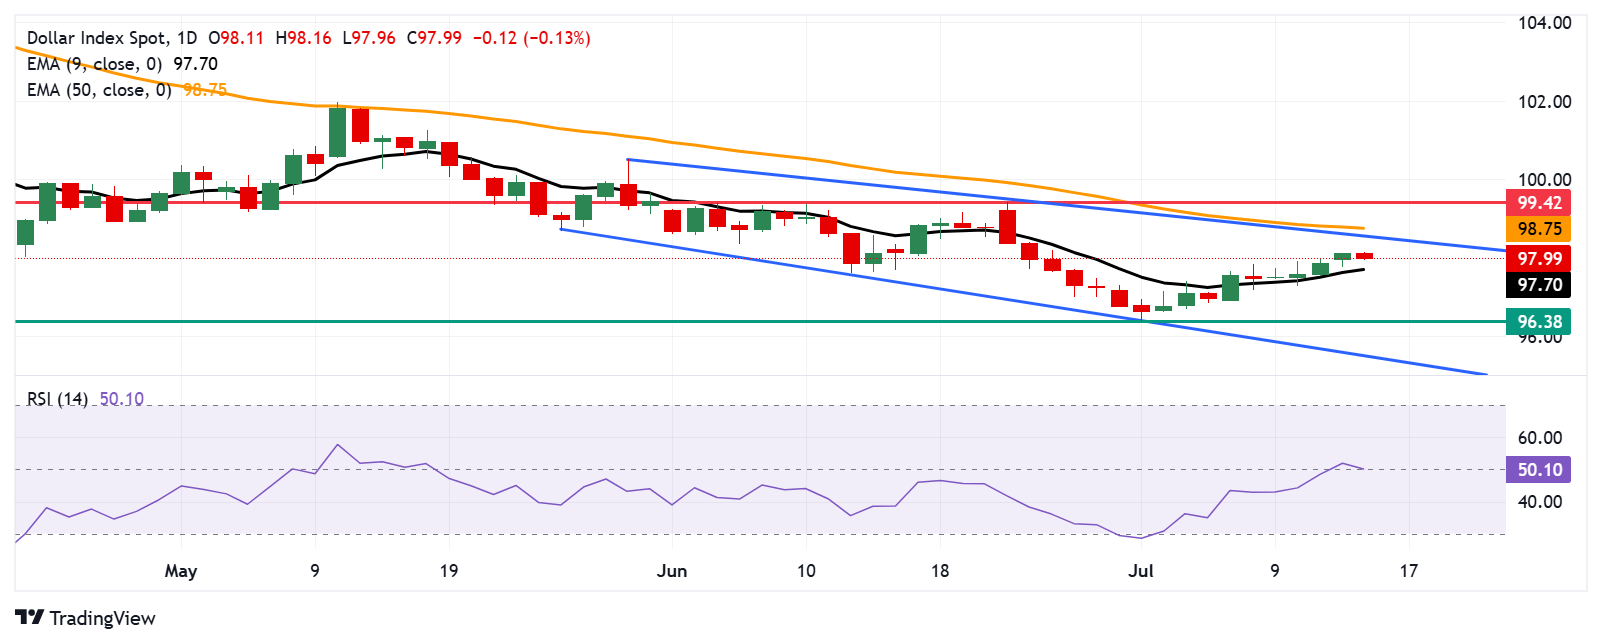
The bearish bias seems persistent, suggested by the technical analysis of the daily chart, which shows the index remaining within a descending channel pattern. The 14-day Relative Strength Index (RSI) is hovering around the 50 level, indicating a neutral bias. However, the short-term price momentum is stronger as the DXY remains above the nine-day Exponential Moving Average (EMA).
On the downside, the DXY could find initial support at the nine-day EMA of $97.70. A break below this level could weaken the short-term price momentum and put downward pressure on the US Dollar Index to navigate the region around the three-year low at $96.38, recorded on July 1, followed by the lower boundary of the descending channel around 95.50.
The US Dollar Index may test the primary barrier at the descending channel’s upper boundary around $98.60, followed by the 50-day EMA at $98.75. A break above this crucial resistance zone could strengthen the medium-term price momentum and support the DXY to approach the two-month high at $99.42, which was reached on June 23.
US Dollar Index: Daily Chart
US Dollar PRICE Today
The table below shows the percentage change of US Dollar (USD) against listed major currencies today. US Dollar was the weakest against the Swiss Franc.
| USD | EUR | GBP | JPY | CAD | AUD | NZD | CHF | |
|---|---|---|---|---|---|---|---|---|
| USD | -0.22% | -0.12% | 0.01% | -0.09% | -0.18% | -0.21% | -0.42% | |
| EUR | 0.22% | 0.03% | 0.19% | 0.11% | 0.00% | -0.05% | -0.19% | |
| GBP | 0.12% | -0.03% | 0.14% | 0.08% | -0.05% | -0.11% | -0.07% | |
| JPY | -0.01% | -0.19% | -0.14% | -0.12% | -0.18% | -0.27% | -0.34% | |
| CAD | 0.09% | -0.11% | -0.08% | 0.12% | -0.08% | -0.19% | -0.15% | |
| AUD | 0.18% | -0.01% | 0.05% | 0.18% | 0.08% | -0.07% | -0.08% | |
| NZD | 0.21% | 0.05% | 0.11% | 0.27% | 0.19% | 0.07% | 0.04% | |
| CHF | 0.42% | 0.19% | 0.07% | 0.34% | 0.15% | 0.08% | -0.04% |
The heat map shows percentage changes of major currencies against each other. The base currency is picked from the left column, while the quote currency is picked from the top row. For example, if you pick the US Dollar from the left column and move along the horizontal line to the Japanese Yen, the percentage change displayed in the box will represent USD (base)/JPY (quote).
Recommended Articles


