
Silver Price Forecast: XAG/USD climbs above $36.00, gains more than 1%
- Silver consolidates for a second day within $36.00–$36.60 despite positive market sentiment.
- RSI hints at bullish continuation, but no new highs since June 18 peak at $37.31.
- Break below $36.00 risks pullback toward $35.00 and 50-day SMA at $34.24.
The silver price printed solid gains on Wednesday, up 1.40%, yet it remains consolidating within the $36.00-$36.60 range for the second consecutive day. A positive market mood and broad US Dollar strength capped the grey metal’s advance.
XAG/USD Price Forecast: Technical Outlook
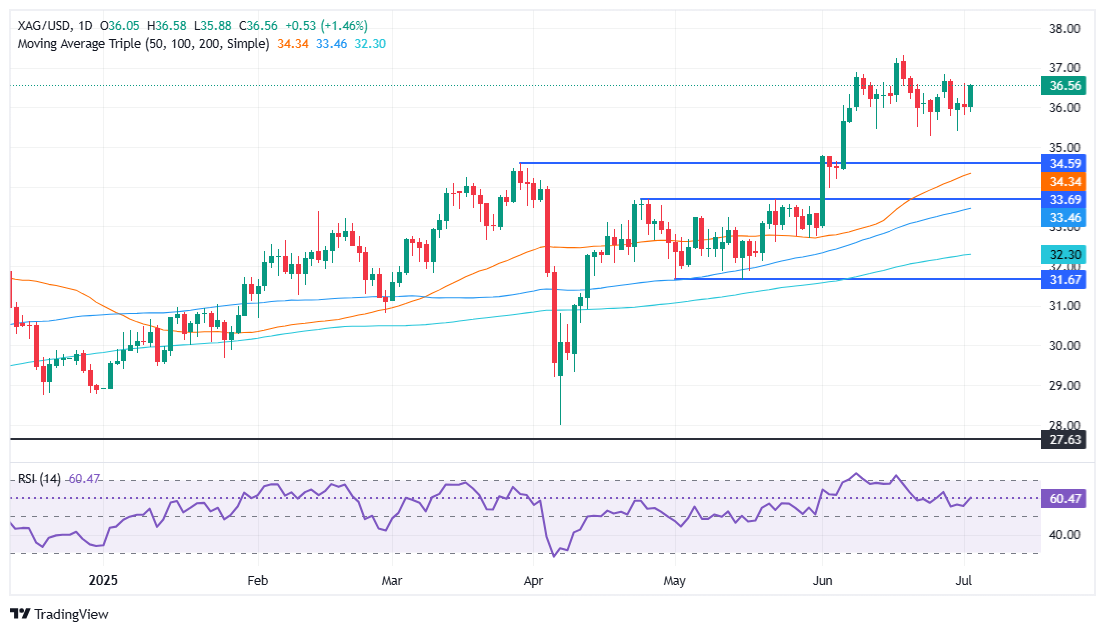
From a technical standpoint, XAG/USD remains upward biased, even though it has failed to print a new higher high since June 18, when Silver hit a yearly peak of $37.31. At the same time, the latest cycle low reached on June 23 at $35.82, remains respected. This, along with bulls gathering momentum as portrayed by the Relative Strength Index (RSI), suggests further upside is expected.
With that said, the first resistance level for XAG/USD is $37.00. If surpassed, the next stop would be the yearly peak of $37.31, ahead of testing the February 29, 2012, peak at $37.49. A breach of the latter will expose $38.00
On the other hand, Silver could take a negative turn if the spot price drops below $36.00, paving the way for a test of $35.82. Once hurdled, the next stop would be $35.00, before challenging the 50-day Simple Moving Average (SMA) at $34.24.
XAG/USD Price Chart – Daily
Silver FAQs
Silver is a precious metal highly traded among investors. It has been historically used as a store of value and a medium of exchange. Although less popular than Gold, traders may turn to Silver to diversify their investment portfolio, for its intrinsic value or as a potential hedge during high-inflation periods. Investors can buy physical Silver, in coins or in bars, or trade it through vehicles such as Exchange Traded Funds, which track its price on international markets.
Silver prices can move due to a wide range of factors. Geopolitical instability or fears of a deep recession can make Silver price escalate due to its safe-haven status, although to a lesser extent than Gold's. As a yieldless asset, Silver tends to rise with lower interest rates. Its moves also depend on how the US Dollar (USD) behaves as the asset is priced in dollars (XAG/USD). A strong Dollar tends to keep the price of Silver at bay, whereas a weaker Dollar is likely to propel prices up. Other factors such as investment demand, mining supply – Silver is much more abundant than Gold – and recycling rates can also affect prices.
Silver is widely used in industry, particularly in sectors such as electronics or solar energy, as it has one of the highest electric conductivity of all metals – more than Copper and Gold. A surge in demand can increase prices, while a decline tends to lower them. Dynamics in the US, Chinese and Indian economies can also contribute to price swings: for the US and particularly China, their big industrial sectors use Silver in various processes; in India, consumers’ demand for the precious metal for jewellery also plays a key role in setting prices.
Silver prices tend to follow Gold's moves. When Gold prices rise, Silver typically follows suit, as their status as safe-haven assets is similar. The Gold/Silver ratio, which shows the number of ounces of Silver needed to equal the value of one ounce of Gold, may help to determine the relative valuation between both metals. Some investors may consider a high ratio as an indicator that Silver is undervalued, or Gold is overvalued. On the contrary, a low ratio might suggest that Gold is undervalued relative to Silver.
Recommended Articles


