


Australian Dollar remains subdued following China’s Caixin Manufacturing PMI

The Australian Dollar holds losses after the release of Manufacturing Purchasing Managers’ Index data from Australia and China.
China's Caixin Manufacturing PMI climbed to 50.4 in June from 48.3 in May.
The US Dollar extends its losing streak due to growing Fed uncertainty and fiscal concerns.
The Australian Dollar (AUD) edges lower against the US Dollar (USD) on Tuesday after registering more than 0.50% losses in the previous session. The AUD/USD pair loses ground as Australia’s S&P Global Manufacturing Purchasing Managers’ Index (PMI) falls to 50.6 in June from the previous 51.0. The output declined to its lowest reading since February as new orders fell for the first time in five months, due to adequate client inventories and weaker market conditions.
China's Caixin Manufacturing Purchasing Managers' Index improved to 50.4 in June from 48.3 in May, according to the latest data released on Tuesday. The reading surpassed the market forecast of 49.0. This is important to note that any economic change in China could impact AUD as both countries are close trade partners.
The AUD/USD pair may regain its ground as the US Dollar continues to face challenges amid growing uncertainty over the Federal Reserve (Fed) policy outlook and a rising fiscal concern in the United States (US). Additionally, traders adopt caution over a sweeping tax and spending bill currently under consideration in the Senate, which could add $3.3 trillion to the national debt.
Australian Dollar struggles despite a weaker US Dollar ahead of ISM Manufacturing PMI data
The US Dollar Index (DXY), which measures the value of the US Dollar against six major currencies, is continuing its losing streak that began on June 19 and is trading at around 96.70 at the time of writing. Traders await the US June ISM Manufacturing Purchasing Managers Index (PMI) data due later on Tuesday.
The US Personal Consumption Expenditures (PCE) Price Index climbed by 2.3% year-over-year in May, up from the 2.2% rise in April (revised from 2.1%). This reading came in line with market expectations. Meanwhile, the core PCE Price Index, which excludes volatile food and energy prices, rose 2.7%, following the previous 2.6% increase (revised from 2.5%).
The President of the Federal Reserve Bank of Minneapolis, Neel Kashkari, noted on Friday that he was sticking to his view that cooling inflation would allow the Fed to cut its policy rate twice that year, beginning in September.
US President Donald Trump could weaken Fed Chair Jerome Powell’s authority by announcing his preferred candidate to lead the central bank next year. Trump said that he has a list of potential Powell successors down to “three or four people,” without naming the finalists. Chicago Fed President Austan Goolsbee said on Thursday that political waves are not a factor in decision-making, nor would the naming of a shadow chair, per CNBC.
Fed Chair Jerome Powell noted on Wednesday that Trump's tariff policies may cause a one-time price hike, but they could also lead to more persistent inflation. The Fed should be careful in considering further rate cuts.
A US intelligence report indicated that US strikes on Iranian nuclear sites have set back Tehran's program by only a matter of months, per Reuters. Iranian Foreign Minister Abbas Araghchi noted that Tehran has no intention of resuming nuclear negotiations with the United States, per CNN.
China’s NBS Manufacturing Purchasing Managers' Index (PMI) advanced to 49.7 in June, compared with 49.5 in May. The data came in line with the market consensus in the reported month. The NBS Non-Manufacturing PMI rose to 50.5 in June versus May’s 50.3 and the expected 50.3 reading.
TD-MI Inflation Gauge edged up 0.1% month-over-month in June, reversing a 0.4% previous decline. The rise came even as both headline and underlying inflation continued to ease within the Reserve Bank of Australia’s (RBA) 2–3% target range.
Australia's Private Sector Credit climbed to 0.5% month-over-month in May, against the market expectations and the prior month's 0.7% rise. The slowdown was primarily due to a deceleration in business loans, which eased to 0.8% from 1% in April.
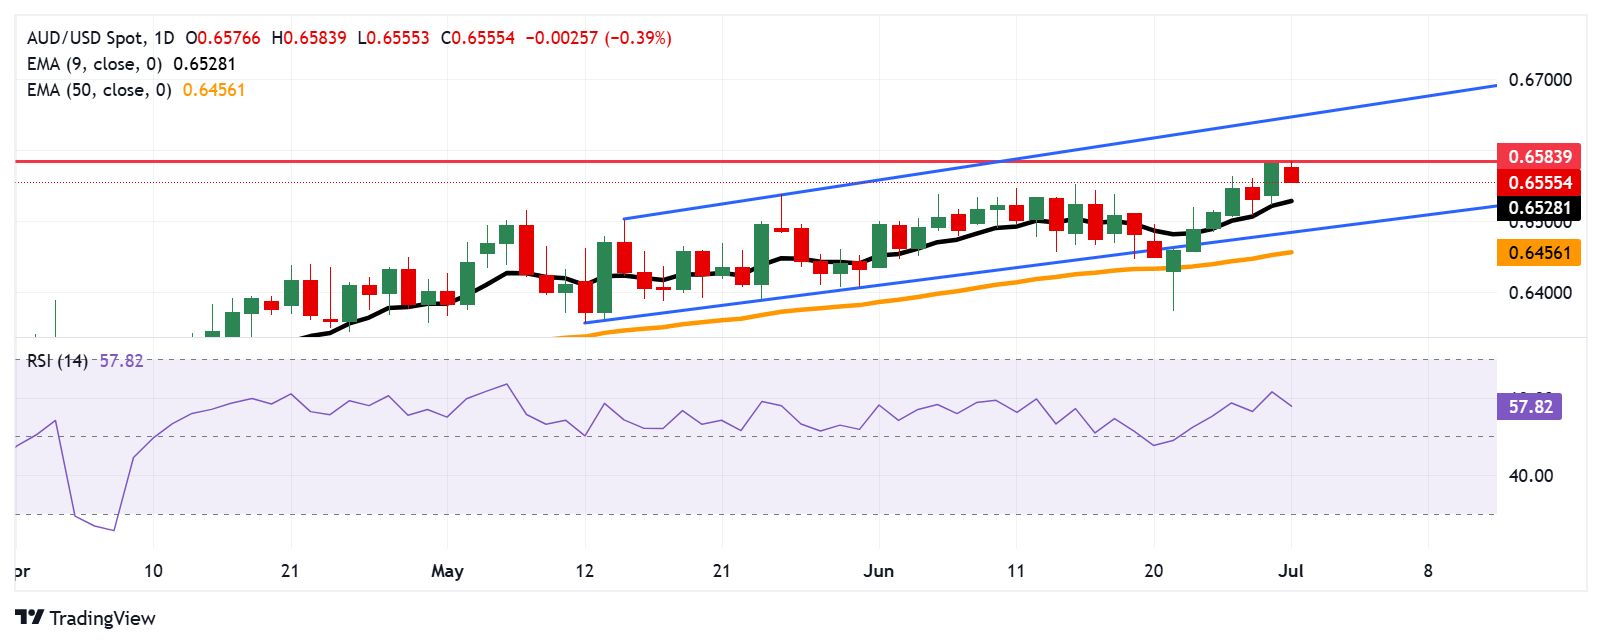
Australian Dollar trades near 0.6560 after pulling back from eight-month highs
The AUD/USD pair is trading around 0.6560 on Tuesday. The daily technical analysis indicates a persistent bullish bias as the pair remains within the ascending channel pattern. The 14-day Relative Strength Index (RSI) is positioned above the 50 mark. Additionally, the pair rises above the nine-day Exponential Moving Average (EMA), indicating that short-term price momentum is stronger.
On the upside, the AUD/USD pair could rebound to the fresh eight-month high of 0.6583, which was recorded on July 1, followed by the upper boundary of the ascending channel around 0.6650.
The nine-day EMA at 0.6529 appears as the primary support. A break below this level would weaken the short-term price momentum and put downward pressure on the AUD/USD pair to test the lower boundary of the ascending channel around 0.6490, aligned with the 50-day EMA at 0.6456.
AUD/USD: Daily Chart
Australian Dollar PRICE Today
The table below shows the percentage change of Australian Dollar (AUD) against listed major currencies today. Australian Dollar was the weakest against the Japanese Yen.
| USD | EUR | GBP | JPY | CAD | AUD | NZD | CHF | |
|---|---|---|---|---|---|---|---|---|
| USD | 0.07% | 0.04% | -0.17% | 0.07% | 0.29% | 0.21% | -0.00% | |
| EUR | -0.07% | -0.02% | -0.36% | 0.00% | 0.31% | 0.13% | -0.06% | |
| GBP | -0.04% | 0.02% | -0.22% | 0.05% | 0.34% | 0.16% | -0.03% | |
| JPY | 0.17% | 0.36% | 0.22% | 0.30% | 0.46% | 0.37% | 0.19% | |
| CAD | -0.07% | -0.00% | -0.05% | -0.30% | 0.21% | 0.10% | -0.09% | |
| AUD | -0.29% | -0.31% | -0.34% | -0.46% | -0.21% | -0.18% | -0.37% | |
| NZD | -0.21% | -0.13% | -0.16% | -0.37% | -0.10% | 0.18% | -0.19% | |
| CHF | 0.00% | 0.06% | 0.03% | -0.19% | 0.09% | 0.37% | 0.19% |
The heat map shows percentage changes of major currencies against each other. The base currency is picked from the left column, while the quote currency is picked from the top row. For example, if you pick the Australian Dollar from the left column and move along the horizontal line to the US Dollar, the percentage change displayed in the box will represent AUD (base)/USD (quote).
Economic Indicator
Caixin Manufacturing PMI
The Caixin Manufacturing Purchasing Managers Index (PMI), released on a monthly basis by Caixin Insight Group and S&P Global, is a leading indicator gauging business activity in China’s manufacturing sector. The data is derived from surveys of senior executives at both private-sector and state-owned companies. Survey responses reflect the change, if any, in the current month compared to the previous month and can anticipate changing trends in official data series such as Gross Domestic Product (GDP), industrial production, employment and inflation.The index varies between 0 and 100, with levels of 50.0 signaling no change over the previous month. A reading above 50 indicates that the manufacturing economy is generally expanding, a bullish sign for the Renminbi (CNY). Meanwhile, a reading below 50 signals that activity among goods producers is generally declining, which is seen as bearish for CNY.
Read more.Last release: Tue Jul 01, 2025 01:45
Frequency: Monthly
Actual: 50.4
Consensus: 49
Previous: 48.3
Source: IHS Markit
* The content presented above, whether from a third party or not, is considered as general advice only. This article should not be construed as containing investment advice, investment recommendations, an offer of or solicitation for any transactions in financial instruments.


