
Dow Jones Industrial Average churns amid Vietnam trade deal and sharp ADP jobs contraction
- The Dow Jones held onto near-term highs on Wednesday, but risks are growing.
- President Trump announced a trade deal with Vietnam, US importers to foot the bill.
- ADP jobs data came in well below expectations, reigniting market fears of a weakening US economy.
The Dow Jones Industrial Average (DJIA) tested the low side on Wednesday, knocking back the early week’s bullish tilt after ADP Employment Change figures widely missed the mark and came in well below forecasts. The Trump administration has announced a trade deal with Vietnam, with US importers poised to bear the brunt of the burden for double-digit tariffs on all Vietnamese goods entering the US.
President Donald Trump announced that the US had reached some form of a trade deal with Vietnam. According to Trump, Vietnam would be subject to a 20% tariff on all goods bound for the US, with a 40% tariff on transshipment, while Vietnam would charge no tariffs whatsoever on US exports to the country. US exports to Vietnam totalled $13.1 billion in 2024. Donald Trump insisted that Vietnam specifically would be paying the import tax, neglecting to point out that US import taxes are charged at the port of entry to the US-based company that orders the goods.
US ADP Employment Change figures came in well below expectations on Wednesday, contracting by 33K net jobs and driving a sharp point through both median market forecasts and investor confidence in the US domestic economy. ADP jobs figures serve as a volatile preview of Nonfarm Payrolls (NFP), with the latest net job gains estimates from the Bureau of Labor Statistics (BLS) due on Thursday this week. Aggregate forecasts are expecting NFP net employment gains to rise 110K in June, a healthy number but still slightly down from May’s 139K.
Dow Jones price forecast
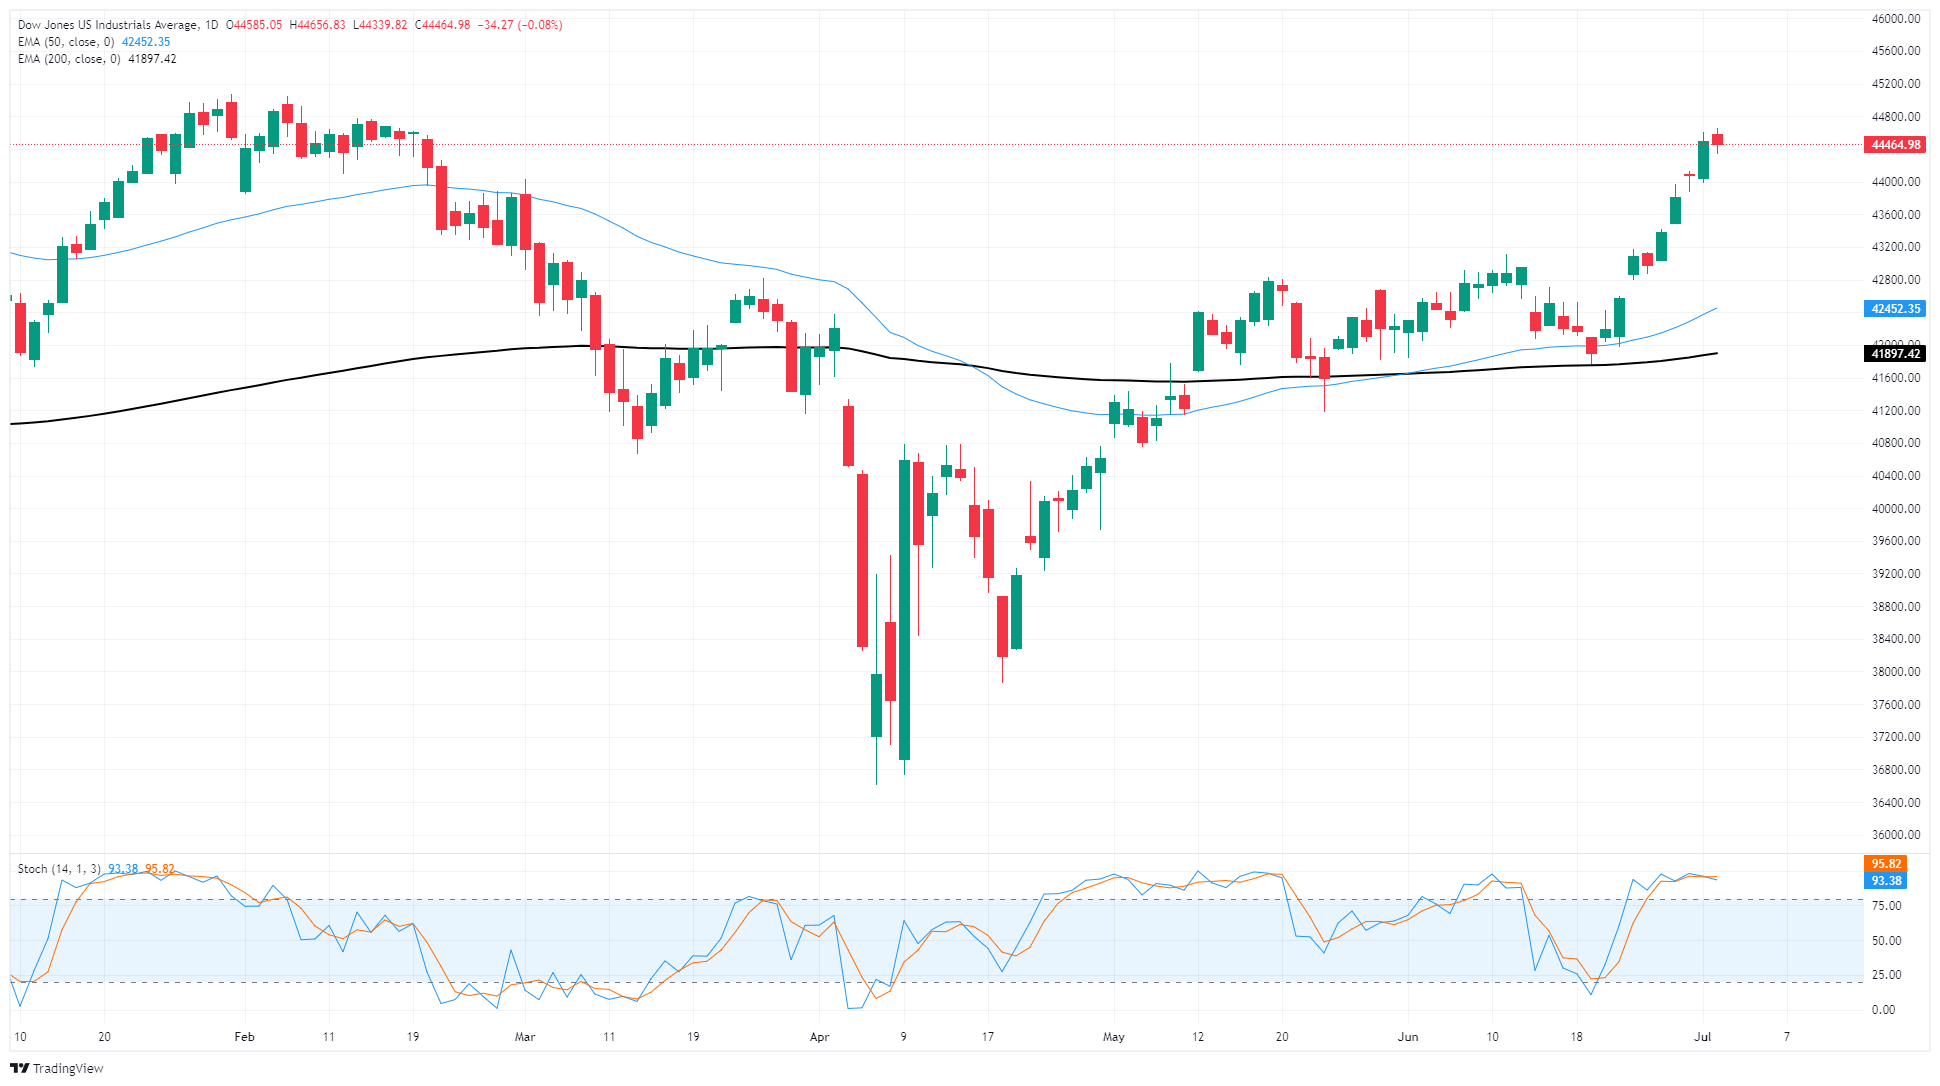
The Dow Jones is still holding onto bullish territory near 44,500, but intraday momentum has slowed sharply during the midweek market session. The Dow remains firmly pinned to the high side, trading far above the 200-day Exponential Moving Average (EMA) near 42,200; however, technical oscillators remain buried deep in overbought territory, warning of a downside correction on the cards to relieve some bullish steam built up in equities.
Dow Jones daily chart
Dow Jones FAQs
The Dow Jones Industrial Average, one of the oldest stock market indices in the world, is compiled of the 30 most traded stocks in the US. The index is price-weighted rather than weighted by capitalization. It is calculated by summing the prices of the constituent stocks and dividing them by a factor, currently 0.152. The index was founded by Charles Dow, who also founded the Wall Street Journal. In later years it has been criticized for not being broadly representative enough because it only tracks 30 conglomerates, unlike broader indices such as the S&P 500.
Many different factors drive the Dow Jones Industrial Average (DJIA). The aggregate performance of the component companies revealed in quarterly company earnings reports is the main one. US and global macroeconomic data also contributes as it impacts on investor sentiment. The level of interest rates, set by the Federal Reserve (Fed), also influences the DJIA as it affects the cost of credit, on which many corporations are heavily reliant. Therefore, inflation can be a major driver as well as other metrics which impact the Fed decisions.
Dow Theory is a method for identifying the primary trend of the stock market developed by Charles Dow. A key step is to compare the direction of the Dow Jones Industrial Average (DJIA) and the Dow Jones Transportation Average (DJTA) and only follow trends where both are moving in the same direction. Volume is a confirmatory criteria. The theory uses elements of peak and trough analysis. Dow’s theory posits three trend phases: accumulation, when smart money starts buying or selling; public participation, when the wider public joins in; and distribution, when the smart money exits.
There are a number of ways to trade the DJIA. One is to use ETFs which allow investors to trade the DJIA as a single security, rather than having to buy shares in all 30 constituent companies. A leading example is the SPDR Dow Jones Industrial Average ETF (DIA). DJIA futures contracts enable traders to speculate on the future value of the index and Options provide the right, but not the obligation, to buy or sell the index at a predetermined price in the future. Mutual funds enable investors to buy a share of a diversified portfolio of DJIA stocks thus providing exposure to the overall index.
Recommended Articles


