A cryptocurrency analyst has pointed out how Pudgy Penguins (PENGU) is starting to look similar to Pepe (PEPE) did before its explosion.
Pudgy Penguins May Be Following A Similar Path As PEPE
In a new post on X, analyst Ali Martinez has talked about how PENGU is showing to the memecoin PEPE in its price chart. Below are the graphs shared by Martinez comparing the trends of the two side-by-side.
In both charts, the analyst has marked the Fibonacci Retracement levels for the assets, lines that are based on ratios from the famous Fibonacci series. The analyst has set the 1.0 level to a price top for both assets. For PEPE, it’s the high from 2023, and for PENGU, it’s the peak from the start of 2025.
Similarly, the zero mark is taken at the bottom point. More specifically, the low that followed the aforementioned top in the coins. Martinez then drew the Fibonacci Retracement levels between the two end points, with each line corresponding to some percentage retracement from top to bottom.
It would appear that in PEPE’s case, the price bottom was followed by a recovery surge that topped above 0.5, the midway point of the Fibonacci scale. This high led into a retrace, but bullish momentum returned for the coin in 2024, resulting in a sharp explosion where its price far surpassed the 2023 top.
From Pudgy Penguins’ chart, it’s apparent that something similar has been developing for it, as its price, too, has seen the pattern of a top above the 0.5 Fibonacci Retracement line, followed by a dip and now a rebound. The rebound in question corresponds to the altcoin’s impressive 50% rally over the past week. Even with this surge, however, the asset has only managed to return to the May high.
While there has been some similarity between the two price charts, it should be noted that it’s not an exact mirror. For instance, the dip extended to 0.236 for PEPE, but the rebound came for PENGU before such a retracement could occur.
With the rebound also not being as strong as PEPE’s so far, it only remains to be seen whether Pudgy Penguins’ surge would end up evolving into anything like the memecoin’s takeoff. As the analyst notes, “a daily close above $0.015–$0.017, and this train could be unstoppable.”
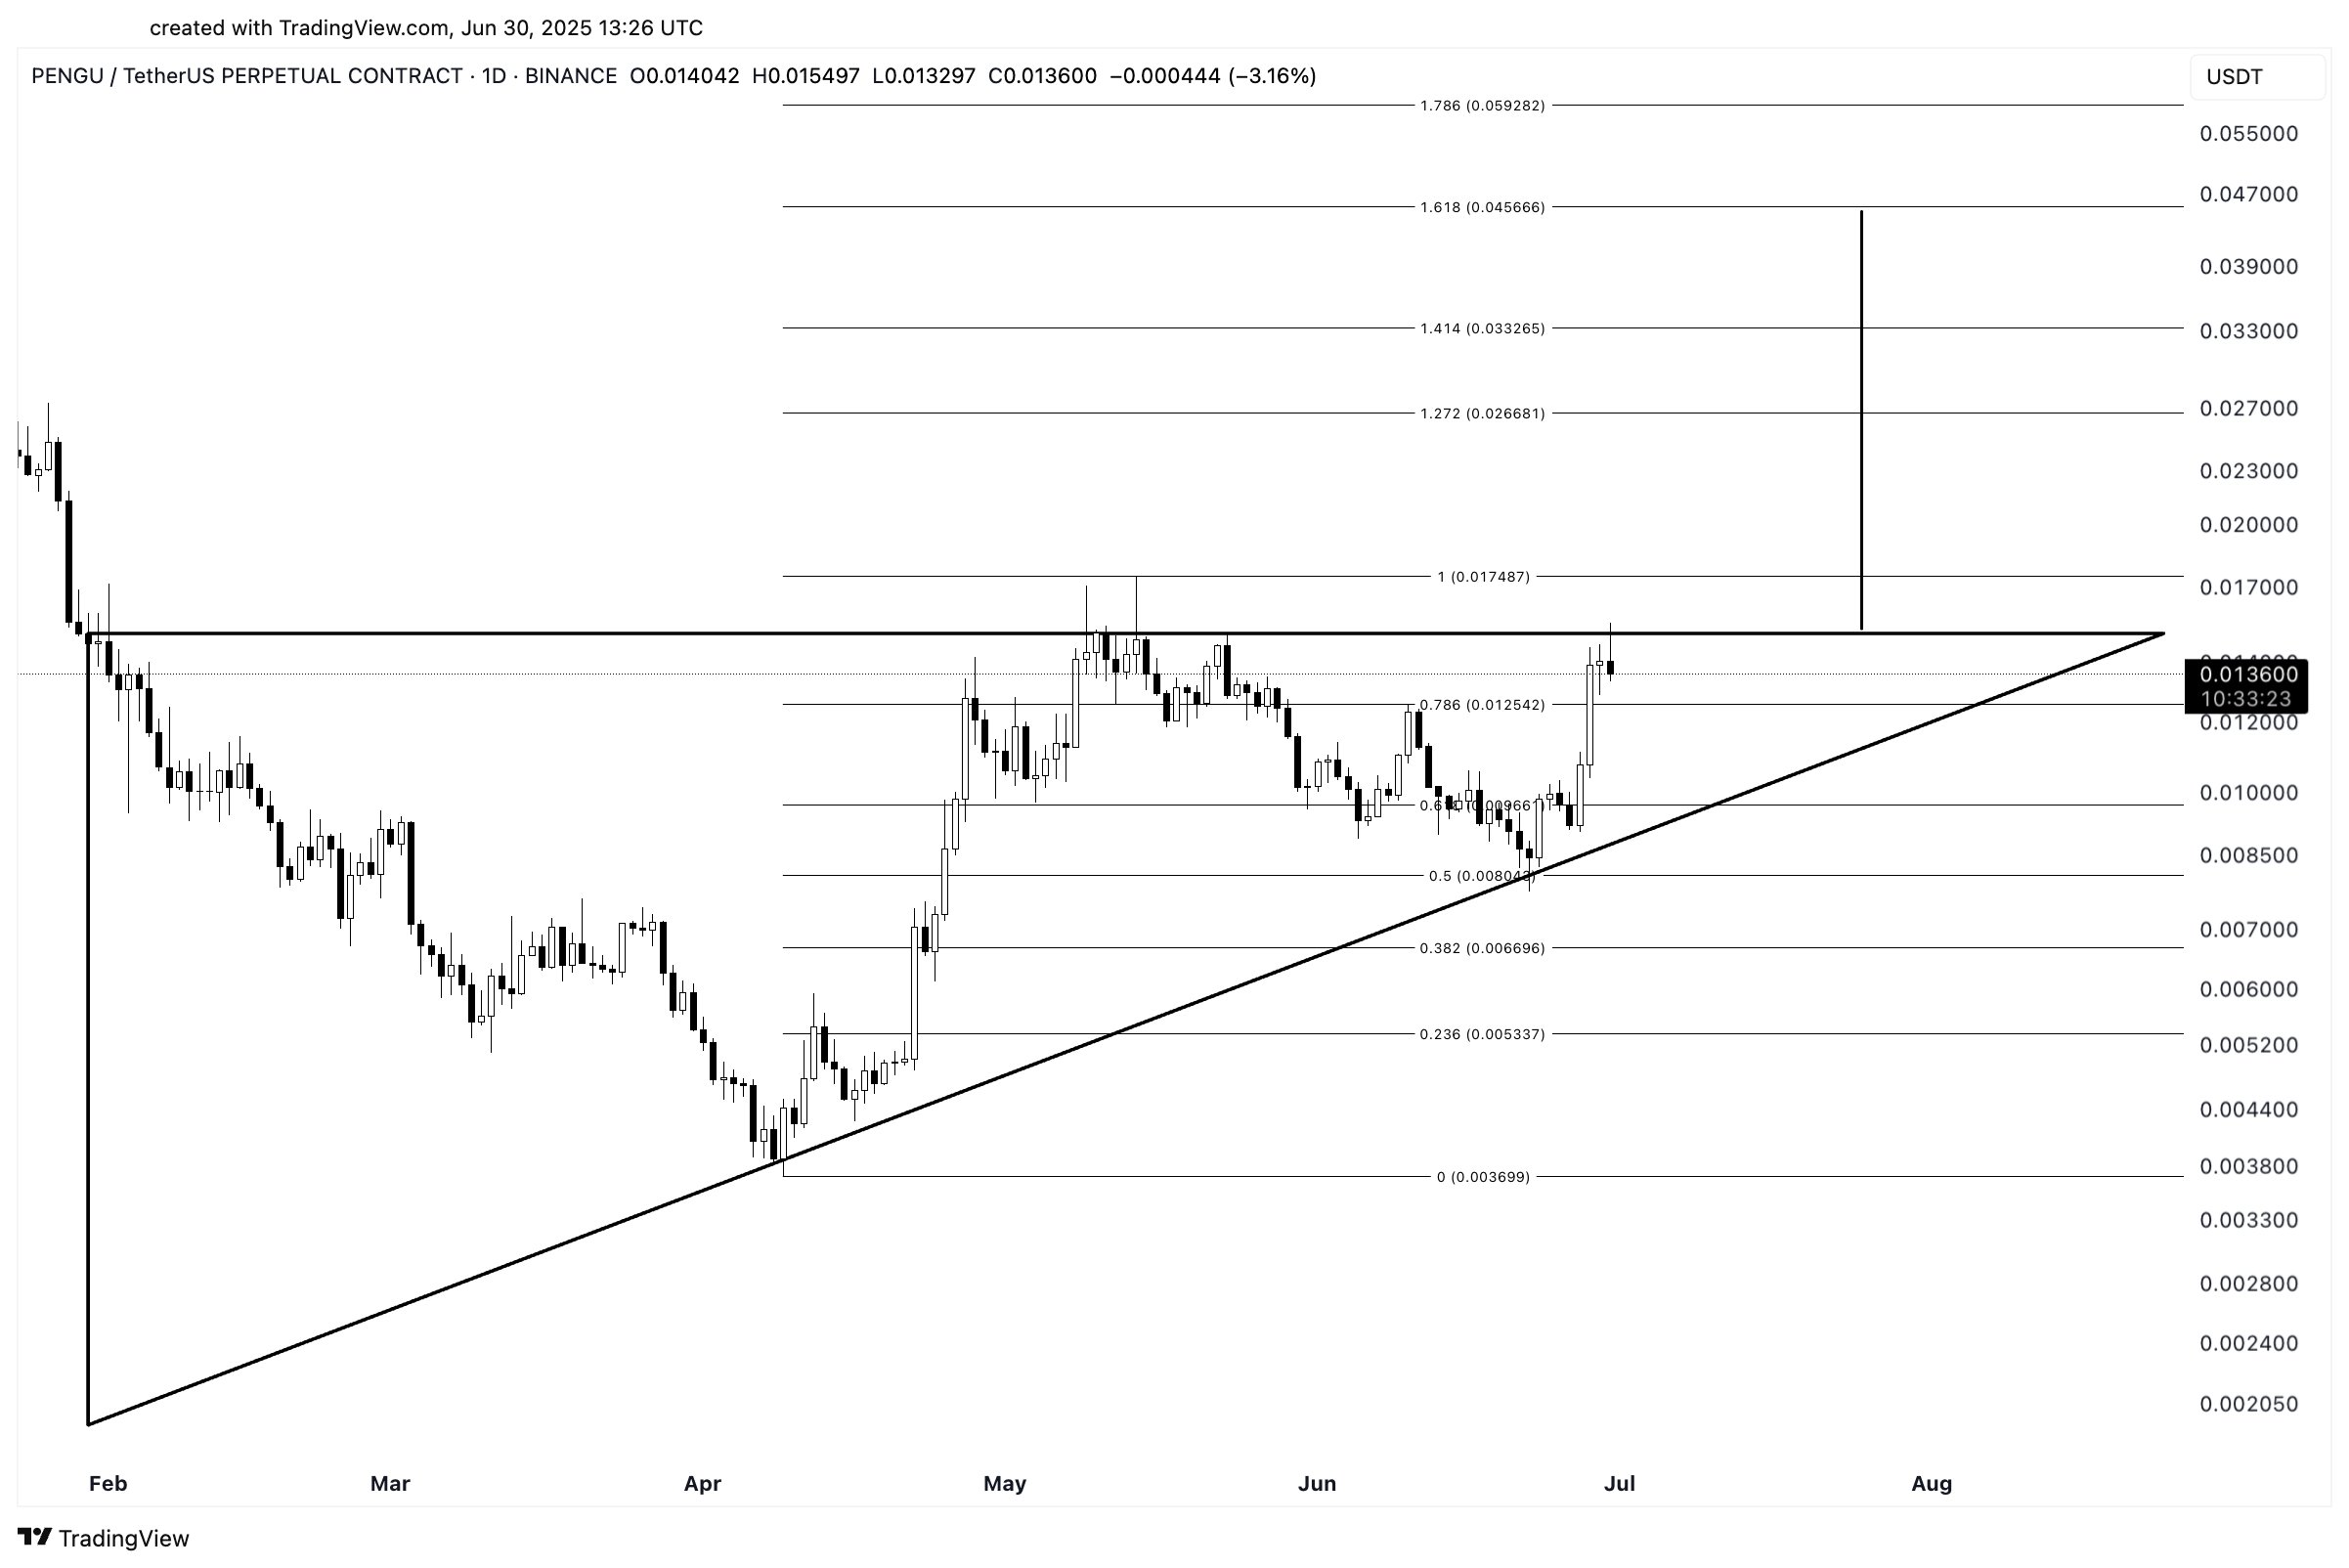
Something that could also point toward a potential breakout for PENGU is this chart shared by Martinez earlier, showcasing that the altcoin has been traveling inside an Ascending Triangle over the last few months.
Pudgy Penguins has recently climbed to the upper line of the pattern, situated around $0.015. Generally, breaks above the resistance line of an Ascending Triangle are considered to be bullish signals. So far, the coin hasn’t been able to surge past the line.
PENGU Price
At the time of writing, Pudgy Penguins is trading around $0.0148, up over 4% in the last 24 hours.
* The content presented above, whether from a third party or not, is considered as general advice only. This article should not be construed as containing investment advice, investment recommendations, an offer of or solicitation for any transactions in financial instruments.


