


US Dollar Index Price Forecast: Hovers near 100.00 after breaking above descending channel
- The US Dollar Index may find immediate support at the nine-day EMA of 99.71.
- A potential bullish reversal is taking shape as the DXY breaks out above a descending channel.
- The US Dollar Index may target the resistance at the 50-day EMA of 102.34.
The US Dollar Index (DXY), which tracks the performance of the US Dollar (USD) against a basket of six major currencies, is losing ground after registering gains in the previous three successive sessions, trading near 100.10 at the time of writing. Market sentiment remains cautious ahead of the upcoming Nonfarm Payrolls (NFP) report, as investors look for insight into how tariffs may be impacting employment trends.
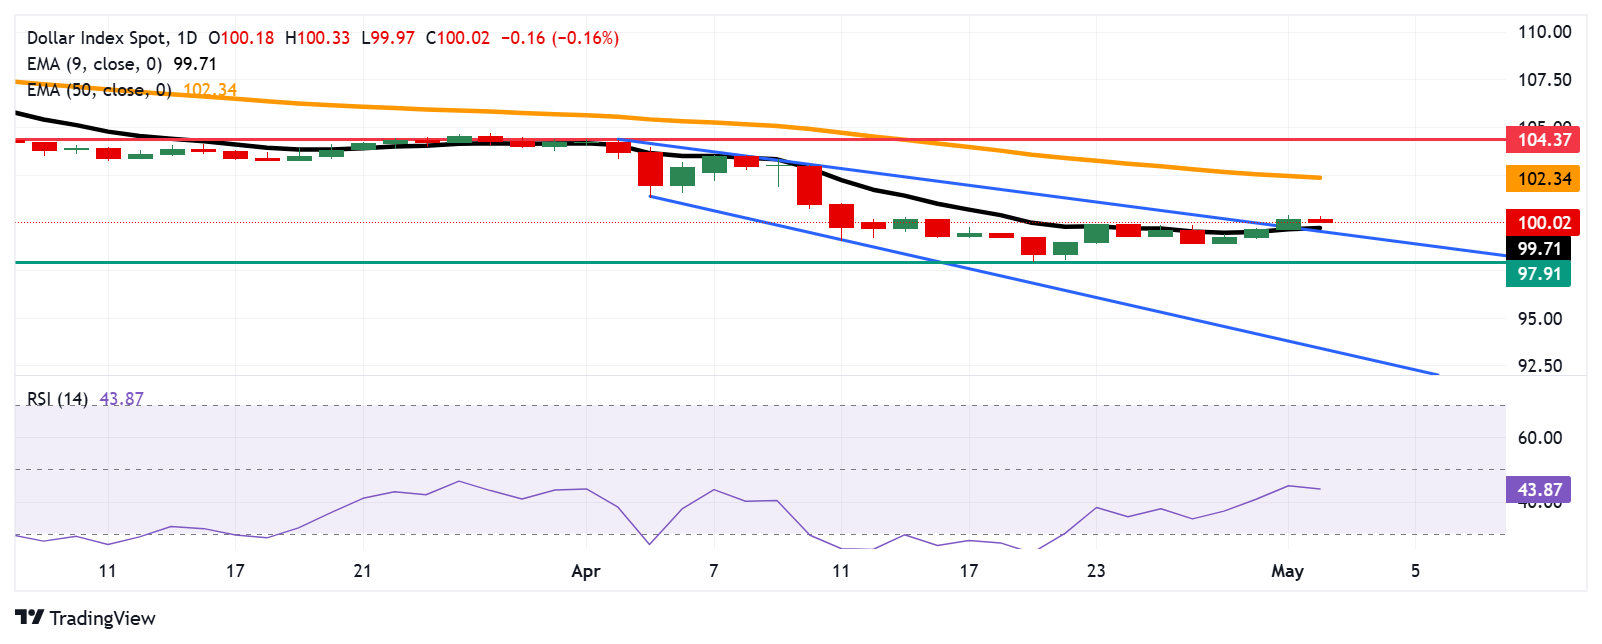
On the daily chart, technical analysis indicates a potential bullish reversal, as the index breaks out above a descending channel pattern. Furthermore, the DXY has moved above the nine-day Exponential Moving Average (EMA), signaling strengthening short-term momentum.
However, the 14-day Relative Strength Index (RSI) is remaining below the 50 mark, suggesting a bearish bias is still in play. A decisive break above the 50 mark could confirm the emergence of the bullish bias.
On the downside, immediate support is seen at the nine-day EMA of 99.71, aligned with the upper boundary of the descending channel. A successful return to the channel could revive the bearish bias and put the downward pressure on the DXY to navigate the region around 97.91 — the lowest level since March 2022, which was recorded on April 21. A break below this level could reinforce the bearish bias and put downward pressure on the US Dollar Index to approach the lower boundary of the descending channel around the 93.50 level.
To the upside, the US Dollar Index may target the 50-day EMA at the 102.34 level. A break above this level could improve the medium-term price momentum and support the index to explore the area around the two-month high at 104.37, reached on April 1.
US Dollar Index: Daily Chart
US Dollar PRICE Today
The table below shows the percentage change of US Dollar (USD) against listed major currencies today. US Dollar was the weakest against the New Zealand Dollar.
| USD | EUR | GBP | JPY | CAD | AUD | NZD | CHF | |
|---|---|---|---|---|---|---|---|---|
| USD | -0.12% | -0.23% | -0.03% | -0.25% | -0.47% | -0.48% | -0.01% | |
| EUR | 0.12% | -0.11% | 0.10% | -0.12% | -0.34% | -0.33% | 0.13% | |
| GBP | 0.23% | 0.11% | 0.19% | -0.01% | -0.23% | -0.22% | 0.23% | |
| JPY | 0.03% | -0.10% | -0.19% | -0.24% | -0.45% | -0.45% | 0.03% | |
| CAD | 0.25% | 0.12% | 0.01% | 0.24% | -0.23% | -0.21% | 0.24% | |
| AUD | 0.47% | 0.34% | 0.23% | 0.45% | 0.23% | 0.01% | 0.47% | |
| NZD | 0.48% | 0.33% | 0.22% | 0.45% | 0.21% | -0.01% | 0.45% | |
| CHF | 0.01% | -0.13% | -0.23% | -0.03% | -0.24% | -0.47% | -0.45% |
The heat map shows percentage changes of major currencies against each other. The base currency is picked from the left column, while the quote currency is picked from the top row. For example, if you pick the US Dollar from the left column and move along the horizontal line to the Japanese Yen, the percentage change displayed in the box will represent USD (base)/JPY (quote).
Recommended Articles


