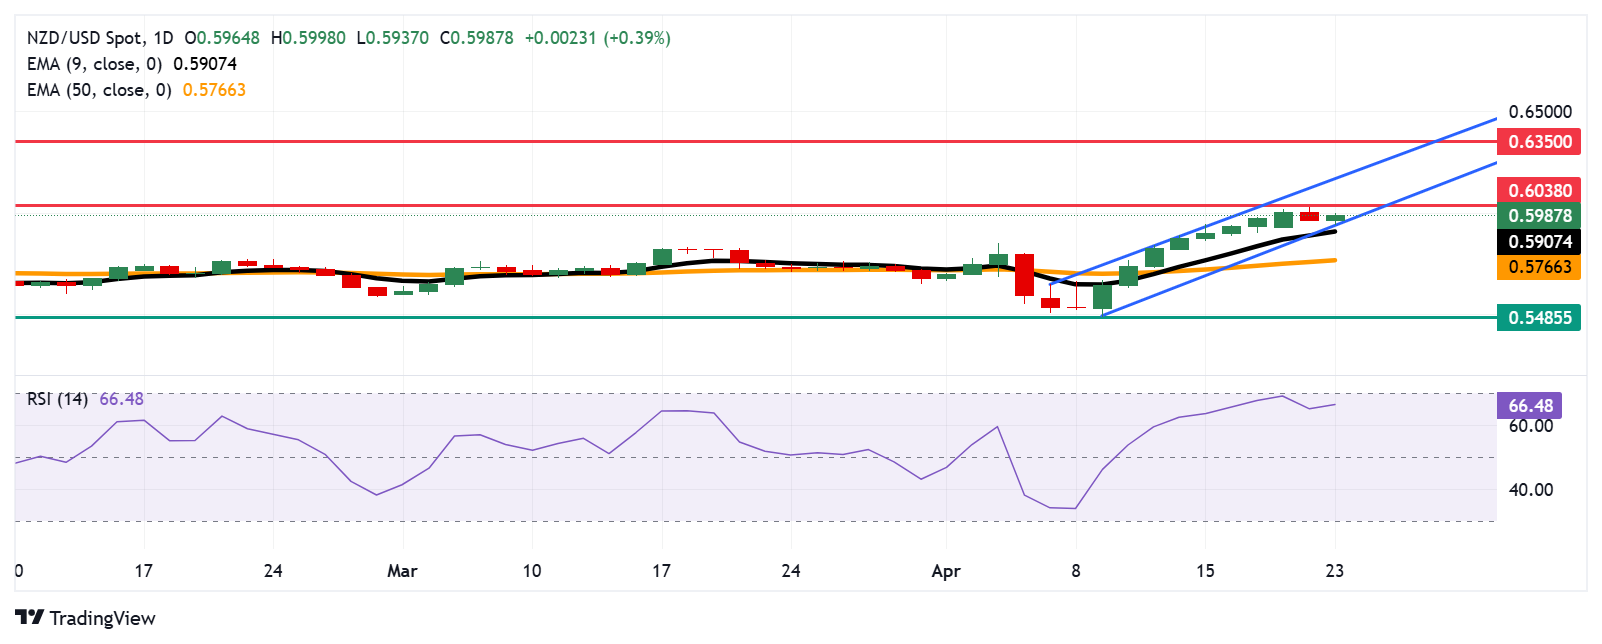
NZD/USD Price Forecast: Bounces off 0.5950 near ascending channel’s lower boundary
- NZD/USD may test the key resistance at 0.6038 — a six-month high last reached in November 2024.
- Daily chart analysis suggests a bullish bias, highlighted by the presence of an ascending channel pattern.
- Initial support lies near the lower boundary of this channel, around 0.5940.
The NZD/USD pair recovers its recent losses registered in the previous session, trading around 0.6000 during early European trading hours on Wednesday. Technical analysis on the daily chart indicates a bullish bias, with the formation of an ascending channel pattern. Moreover, the pair remains above the nine-day Exponential Moving Average (EMA), signaling improved short-term price momentum.
Moreover, the 14-day Relative Strength Index (RSI) is climbing back toward the 70 mark, reinforcing the prevailing bullish bias. A decisive move above this level could indicate overbought conditions, potentially increasing the risk of a short-term pullback.
On the upside, the NZD/USD pair could challenge the key resistance at the six-month high of 0.6038, last seen in November 2024. A sustained break above this level would pave the way for a move toward the upper boundary of the ascending channel around 0.6190. A successful breach of this resistance would likely reinforce the bullish outlook and potentially open the path toward the seven-month high near 0.6350, recorded in October 2024.
The initial support is located at the lower boundary of the ascending channel around 0.5940, followed by the nine-day EMA at 0.5907. A break below these levels could weaken the short-term bullish momentum and open the door for further downside toward the 50-day EMA at 0.5766. Additional support is seen at 0.5485—a level not visited since March 2020.
NZD/USD: Daily Chart

New Zealand Dollar PRICE Today
The table below shows the percentage change of New Zealand Dollar (NZD) against listed major currencies today. New Zealand Dollar was the strongest against the Swiss Franc.
| USD | EUR | GBP | JPY | CAD | AUD | NZD | CHF | |
|---|---|---|---|---|---|---|---|---|
| USD | 0.24% | 0.09% | -0.01% | 0.04% | -0.81% | -0.40% | 0.24% | |
| EUR | -0.24% | -0.17% | -0.24% | -0.21% | -0.99% | -0.65% | -0.01% | |
| GBP | -0.09% | 0.17% | -0.09% | -0.05% | -0.84% | -0.48% | 0.17% | |
| JPY | 0.01% | 0.24% | 0.09% | 0.05% | -0.68% | -0.41% | 0.27% | |
| CAD | -0.04% | 0.21% | 0.05% | -0.05% | -0.74% | -0.41% | 0.22% | |
| AUD | 0.81% | 0.99% | 0.84% | 0.68% | 0.74% | 0.37% | 1.03% | |
| NZD | 0.40% | 0.65% | 0.48% | 0.41% | 0.41% | -0.37% | 0.66% | |
| CHF | -0.24% | 0.01% | -0.17% | -0.27% | -0.22% | -1.03% | -0.66% |
The heat map shows percentage changes of major currencies against each other. The base currency is picked from the left column, while the quote currency is picked from the top row. For example, if you pick the New Zealand Dollar from the left column and move along the horizontal line to the US Dollar, the percentage change displayed in the box will represent NZD (base)/USD (quote).


