


Dow Jones Industrial Average melt-up continues as markets await trade talk results
- The Dow Jones remains stuck near 43,000, but investor optimism remains buoyant.
- US-China trade talks are close to wrapping up in London.
- US CPI inflation data and consumer sentiment figures loom large later this week.
The Dow Jones Industrial Average (DJIA) is still trading into the high end of recent congestion on Tuesday. Market momentum remains limited overall as traders brace for a one-two punch of trade headlines and key post-tariff Consumer Price Index (CPI) inflation data due on Wednesday.
Delegates from the Trump administration are in the process of wrapping up trade talks with Chinese officials in London. Trade negotiations are close to being finished, with the final loose ends of this meeting expected to be tucked away after market close on Tuesday. Any major concessions from either side remain either unannounced or unachieved, and investors may be growing apprehensive about a lack of movement from either side as trade tensions continue to simmer away at the policy level.
Read more stock news: Nike stock advances over 3% as Lutnick claims trade talks going smoothly
The first batch of CPI inflation data, which will include initial price impacts from the Trump administration’s global “reciprocal” tariffs, is expected to hit markets on Wednesday. Median market forecasts are calling for an uptick in headline and core CPI figures. May’s annualized headline CPI inflation is expected to rise to 2.5% YoY from 2.3%, while core CPI inflation is forecast to tick up to 2.9% from 2.8%.
Producer Price Index (PPI) business-level inflation will be printing on Thursday, and is expected to hold steady at 3.1% YoY. The University of Michigan’s (UoM) latest Consumer Sentiment Index will land on Friday, and investors are again expecting an uptick in general consumer sentiment.
Dow Jones price forecast
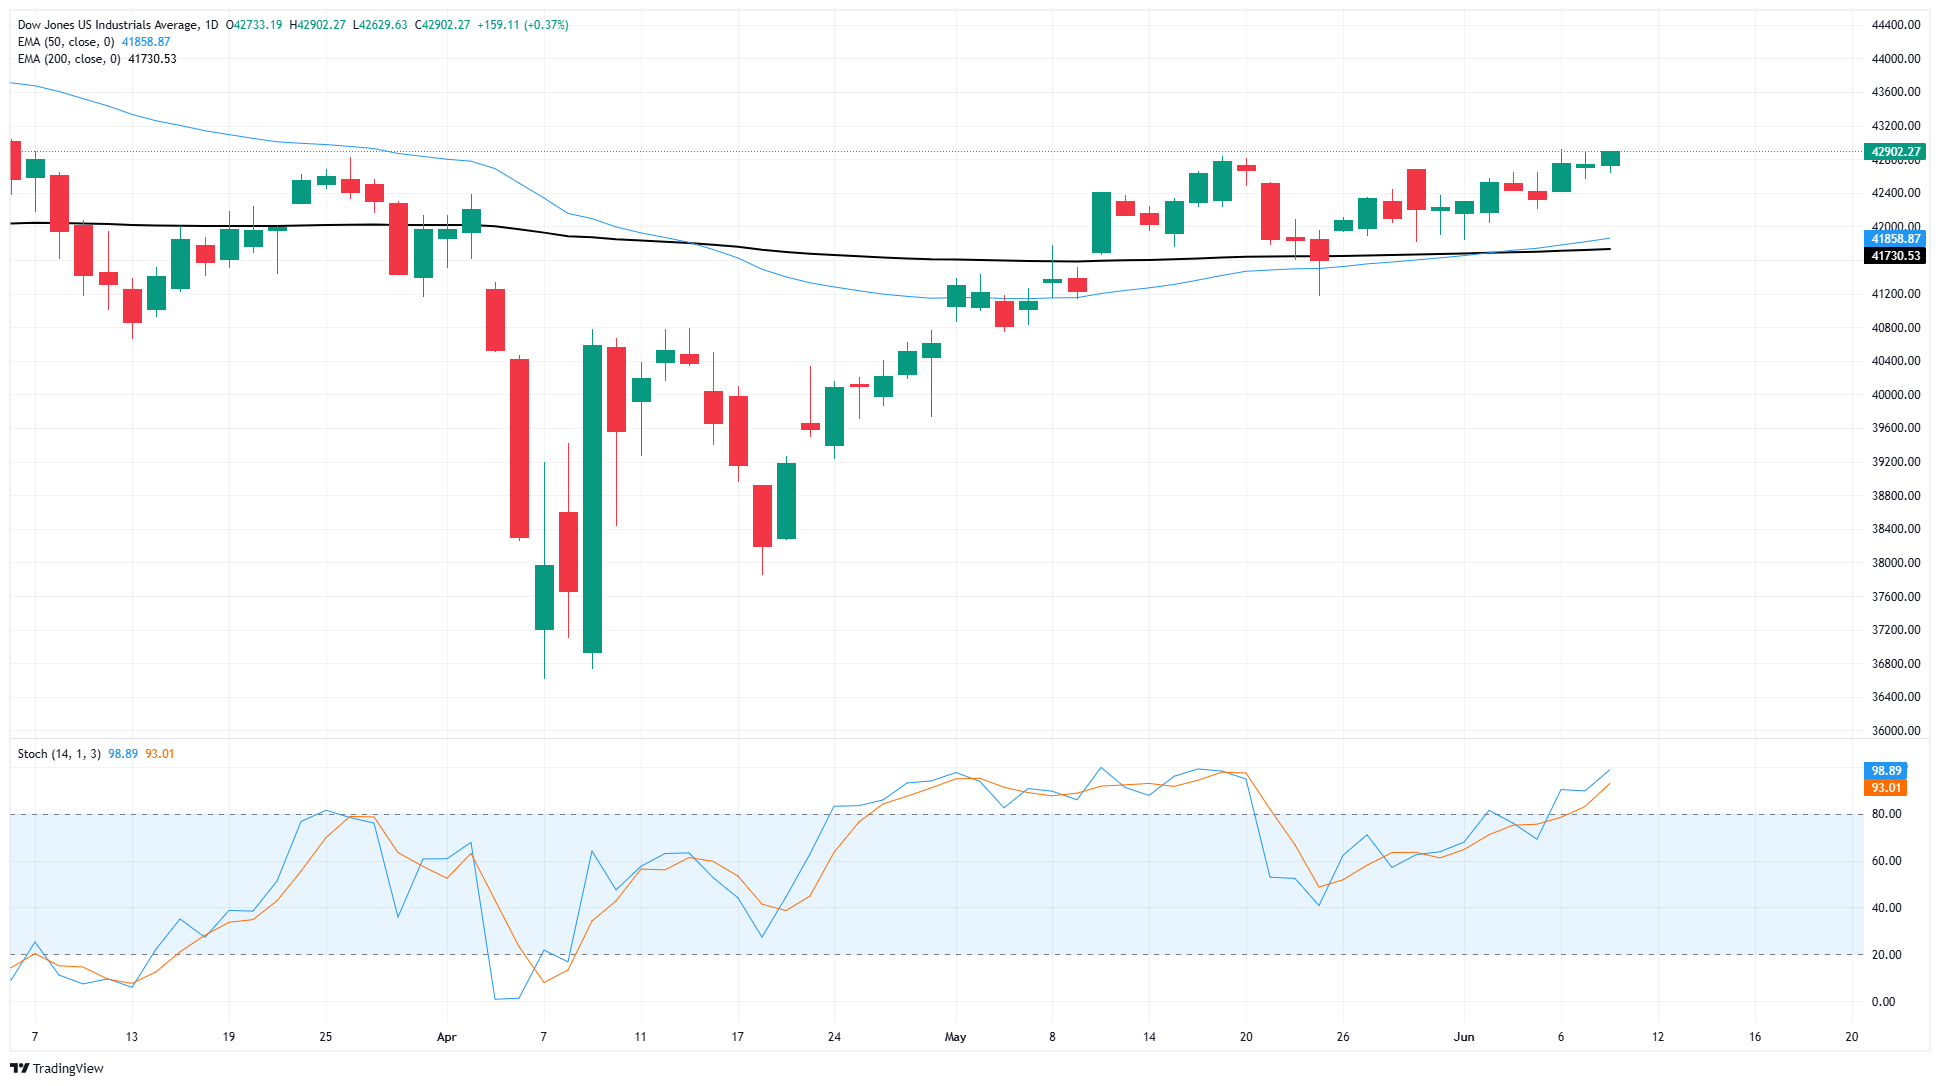
The Dow Jones Industrial Average (DJIA) is steadily approaching the upper limit of its recent consolidation, getting closer to a near-term technical ceiling at the significant level of 43,000. Currently, price movements are strong, remaining above the 200-day Exponential Moving Average (EMA) around 41,650. Bullish momentum might experience a temporary pause as technical oscillators indicate overbought conditions.
Dow Jones daily chart
Dow Jones FAQs
The Dow Jones Industrial Average, one of the oldest stock market indices in the world, is compiled of the 30 most traded stocks in the US. The index is price-weighted rather than weighted by capitalization. It is calculated by summing the prices of the constituent stocks and dividing them by a factor, currently 0.152. The index was founded by Charles Dow, who also founded the Wall Street Journal. In later years it has been criticized for not being broadly representative enough because it only tracks 30 conglomerates, unlike broader indices such as the S&P 500.
Many different factors drive the Dow Jones Industrial Average (DJIA). The aggregate performance of the component companies revealed in quarterly company earnings reports is the main one. US and global macroeconomic data also contributes as it impacts on investor sentiment. The level of interest rates, set by the Federal Reserve (Fed), also influences the DJIA as it affects the cost of credit, on which many corporations are heavily reliant. Therefore, inflation can be a major driver as well as other metrics which impact the Fed decisions.
Dow Theory is a method for identifying the primary trend of the stock market developed by Charles Dow. A key step is to compare the direction of the Dow Jones Industrial Average (DJIA) and the Dow Jones Transportation Average (DJTA) and only follow trends where both are moving in the same direction. Volume is a confirmatory criteria. The theory uses elements of peak and trough analysis. Dow’s theory posits three trend phases: accumulation, when smart money starts buying or selling; public participation, when the wider public joins in; and distribution, when the smart money exits.
There are a number of ways to trade the DJIA. One is to use ETFs which allow investors to trade the DJIA as a single security, rather than having to buy shares in all 30 constituent companies. A leading example is the SPDR Dow Jones Industrial Average ETF (DIA). DJIA futures contracts enable traders to speculate on the future value of the index and Options provide the right, but not the obligation, to buy or sell the index at a predetermined price in the future. Mutual funds enable investors to buy a share of a diversified portfolio of DJIA stocks thus providing exposure to the overall index.
Recommended Articles


