Solana Price Forecast: SOL slips below support as sell pressure builds

Source Fxstreet
  • Solana price closes below its daily support level at $184.13, signaling weakness in price action.
  • On-chain data show SOL’s Spot Taker CVD is negative, reflecting sell-side dominance.
  • Technical analysis suggests weakness in momentum indicators, indicating a potential short-term correction.

Solana (SOL) trades in red below $183 at the time of writing on Tuesday after closing below its key support level the previous day. The bearish case for SOL is further reinforced by Spot Taker Cumulative Volume Delta (CVD) turning negative, indicating a shift toward sell-side dominance. The technical analysis shows weakening momentum, raising concerns about a potential short-term correction.

Solana bears take control of momentum

CryptoQuant data, as shown in the graph below, highlights selling pressure on Solana. The Taker CVD (Cumulative Volume Delta) for SOL turned negative last week, and the value has been steadily decreasing since then. This indicator measures the cumulative difference between market buy and sell volumes over three months. When the 90-day CVD is positive and increasing, it suggests the Taker Buy Dominant Phase, while a negative and decreasing value indicates the Taker Sell Dominant Phase.

SOL Spot Taker CVD chart. Source: CryptoQuant

SOL Spot Taker CVD chart. Source: CryptoQuant

Another aspect that bolsters the platform’s bearish outlook is a recent decline in traders’ interest and liquidity on the SOL chain. Artemis Terminal data indicate that SOL Chain's decentralized exchange (DEX) trading volume has been steadily declining since early July. 

SOL DEX volume chart. Source: Artemis Terminal

SOL DEX volume chart. Source: Artemis Terminal

Solana Price Forecast: Bears taking control of the momentum

Solana price faced rejection around its February 14 high of $205.34 on Wednesday and declined by 10.29%. However, SOL consolidated around its daily level of $184.13 over the next three days and closed below it on Monday. At the time of writing on Tuesday, it trades at around $181.43.

If SOL continues its pullback, it could extend toward its 50-day Exponential Moving Average (EMA) at $167.12.

The Relative Strength Index (RSI) on the daily chart reads 55, pointing downwards, having fallen sharply from its overbought levels last week, indicating a fading of bullish momentum. Moreover, the Moving Average Convergence Divergence (MACD) also showed a bearish crossover on Monday, giving sell signals and indicating a downward trend ahead.
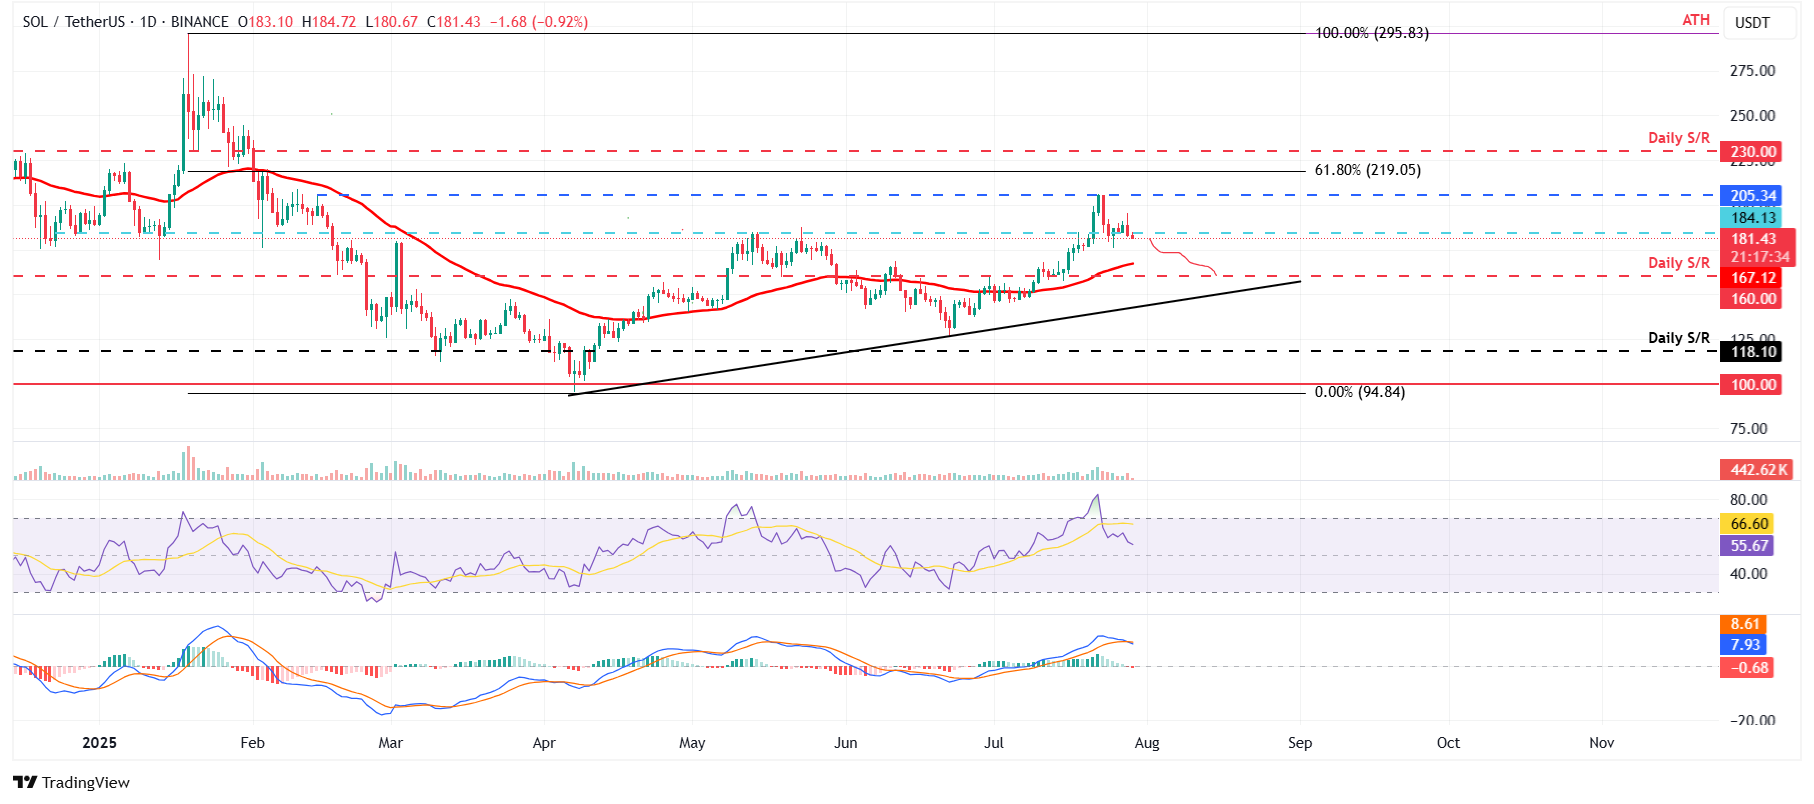
SOL/USDT daily chart 

SOL/USDT daily chart 

If SOL recovers and closes above the daily resistance at $184.13, it could extend the recovery toward the next resistance at $205.34.

Disclaimer: For information purposes only. Past performance is not indicative of future results.
placeholder
Bitcoin Moving With Stocks, But Ethereum’s Correlation Is FadingBitcoin has been showing notable correlation to the stock equities recently, but data shows Ethereum is charting a more independent path. Bitcoin & Ethereum Showing Different Degrees Of
Author  NewsBTC
7 Month 10 Day Thu
Bitcoin has been showing notable correlation to the stock equities recently, but data shows Ethereum is charting a more independent path. Bitcoin & Ethereum Showing Different Degrees Of
placeholder
Ripple’s $21 Trillion Dream: What Capturing 20% Of SWIFT Volume Means For XRPRipple Labs, a crypto payments company, continues to set its ambitions and those of XRP higher than ever as it edges closer to disrupting the global financial messaging giant SWIFT. After Ripple CEO
Author  NewsBTC
7 Month 14 Day Mon
Ripple Labs, a crypto payments company, continues to set its ambitions and those of XRP higher than ever as it edges closer to disrupting the global financial messaging giant SWIFT. After Ripple CEO
placeholder
Philippines' GDP Growth Rises to 5.5% in Second Quarter of 2025The Philippine economy expanded at a marginally faster pace in the second quarter of 2025, with GDP growing 5.5% year-on-year.
Author  Mitrade
8 Month 07 Day Thu
The Philippine economy expanded at a marginally faster pace in the second quarter of 2025, with GDP growing 5.5% year-on-year.
placeholder
Asia Stocks Cautious Before China Tariff Deadline; Australia Sets Record HighMost Asian stock markets were little changed on Monday as investors looked ahead to the looming expiration of the U.S.-China tariff truce, while Australian equities climbed to new highs on rate-cut expectations.
Author  FXStreet
3 hours ago
Most Asian stock markets were little changed on Monday as investors looked ahead to the looming expiration of the U.S.-China tariff truce, while Australian equities climbed to new highs on rate-cut expectations.
placeholder
Oil Prices Extend Losses as Traders Eye US-Russia Summit, Inflation DataOil prices declined in Asian trading on Monday, adding to sharp losses from last week as expectations of progress in U.S.-Russia talks dampened geopolitical risk premiums, while weak inflation data from China weighed on demand sentiment.
Author  FXStreet
3 hours ago
Oil prices declined in Asian trading on Monday, adding to sharp losses from last week as expectations of progress in U.S.-Russia talks dampened geopolitical risk premiums, while weak inflation data from China weighed on demand sentiment.
Related Instrument
goTop
quote