


Dog-based meme coins DOGE and SHIB signal more upside as Open Interest climbs
- Dogecoin price stabilizes near $0.27 on Tuesday, following a strong 38% rally last week.
- Shiba Inu breaks key resistance level, hinting at the potential for a continued rally.
- Derivatives data for both DOGE and SHIB indicate that open interest is increasing, signaling growing investor confidence.
Dog-themed meme coins Dogecoin (DOGE) and Shiba Inu (SHIB) are stabilizing around key levels after a double-digit rally in the previous week. Derivatives data for both meme coins suggest further gains as Open Interest (OI) is increasing, signaling growing investor confidence.
DOGE and SHIB could rally as derivatives data show bullish bias
Futures’ OI in DOGE at exchanges rose from $2.73 billion on Thursday to $5.35 billion on Tuesday, the highest level since January 20, according to data from CoinGlass.
Similarly, during the same period, the OI for SHIB has risen from $215.87 million to $328.49 million, levels not seen since early February.
An increasing OI represents new or additional money entering the market and new buying, which could fuel the current price rallies of Dogecoin and Shiba Inu.
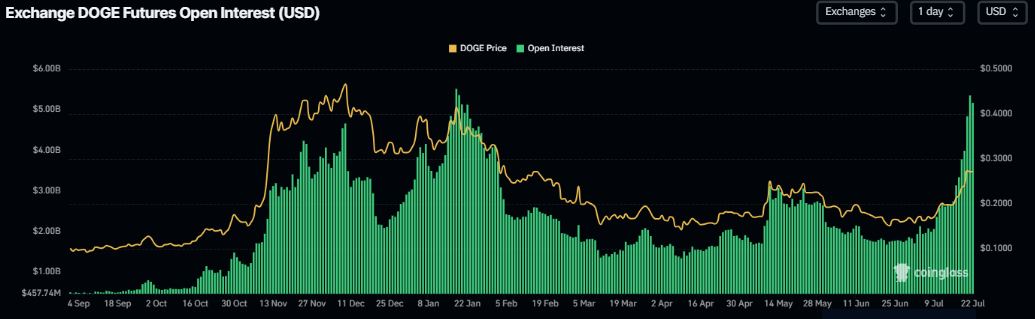
Dogecoin Open Interest chart. Source: CoinGlass
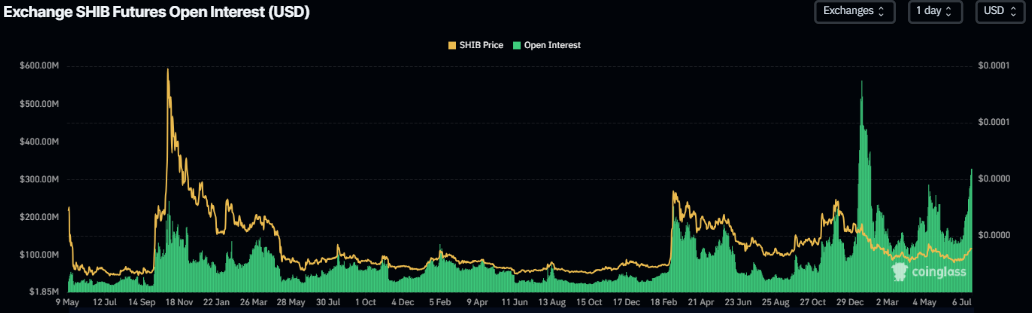
Shiba Inu Open Interest chart. Source: CoinGlass
Another aspect bolstering the dog-based meme coins’ bullish outlook is a positive spike in funding rate data. The metric, as shown in the graph below, has flipped to a positive rate and exhibits a massive spike for both meme coins, with readings of 0.033% for DOGE and 0.023% for SHIB, indicating that longs are paying shorts. Historically, when funding rates have shown a massive positive spike, the prices of DOGE and SHIB have rallied sharply.
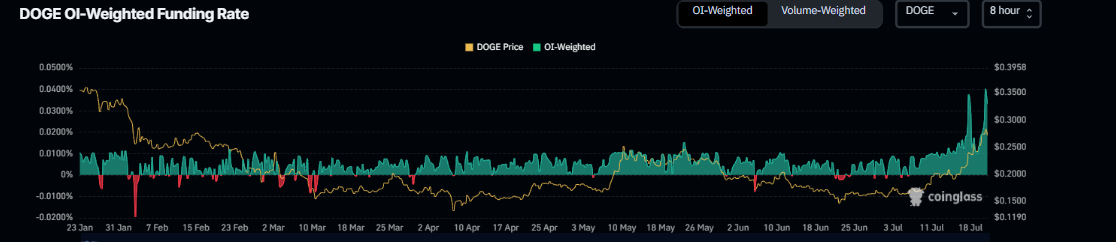
DOGE funding rate chart. Source: Coinglass
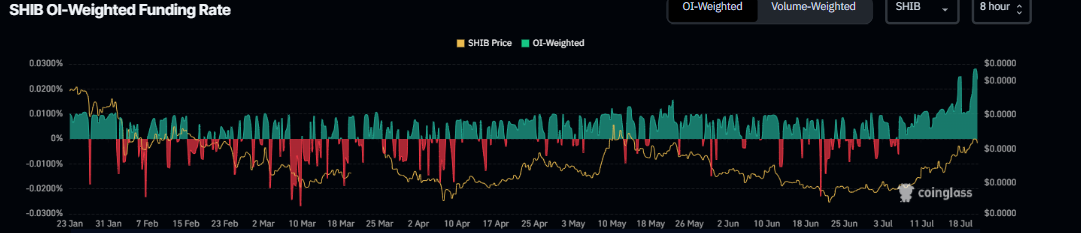
SHIB funding rate chart. Source: Coinglass
Dogecoin Price Forecast: DOGE could rally if the daily support at $0.24 holds
Dogecoin price broke above the descending trendline (drawn by connecting multiple highs since early December) on Friday. It rallied by 15.11% over the next two days, closing above the daily resistance at $0.24. At the time of writing on Tuesday, it trades slightly down at around $0.26.
If the daily level at $0.24 holds as support, DOGE could extend the rally toward its next daily resistance at $0.31.
The Relative Strength Index (RSI) on the daily chart reads 78, indicating an extreme overbought condition, which traders should be cautious of. The Moving Average Convergence Divergence (MACD) indicator on the daily chart showed a bullish crossover at the end of June, which remains in effect. The rising green histogram bars above its neutral zero line suggest that bullish momentum is gaining traction.
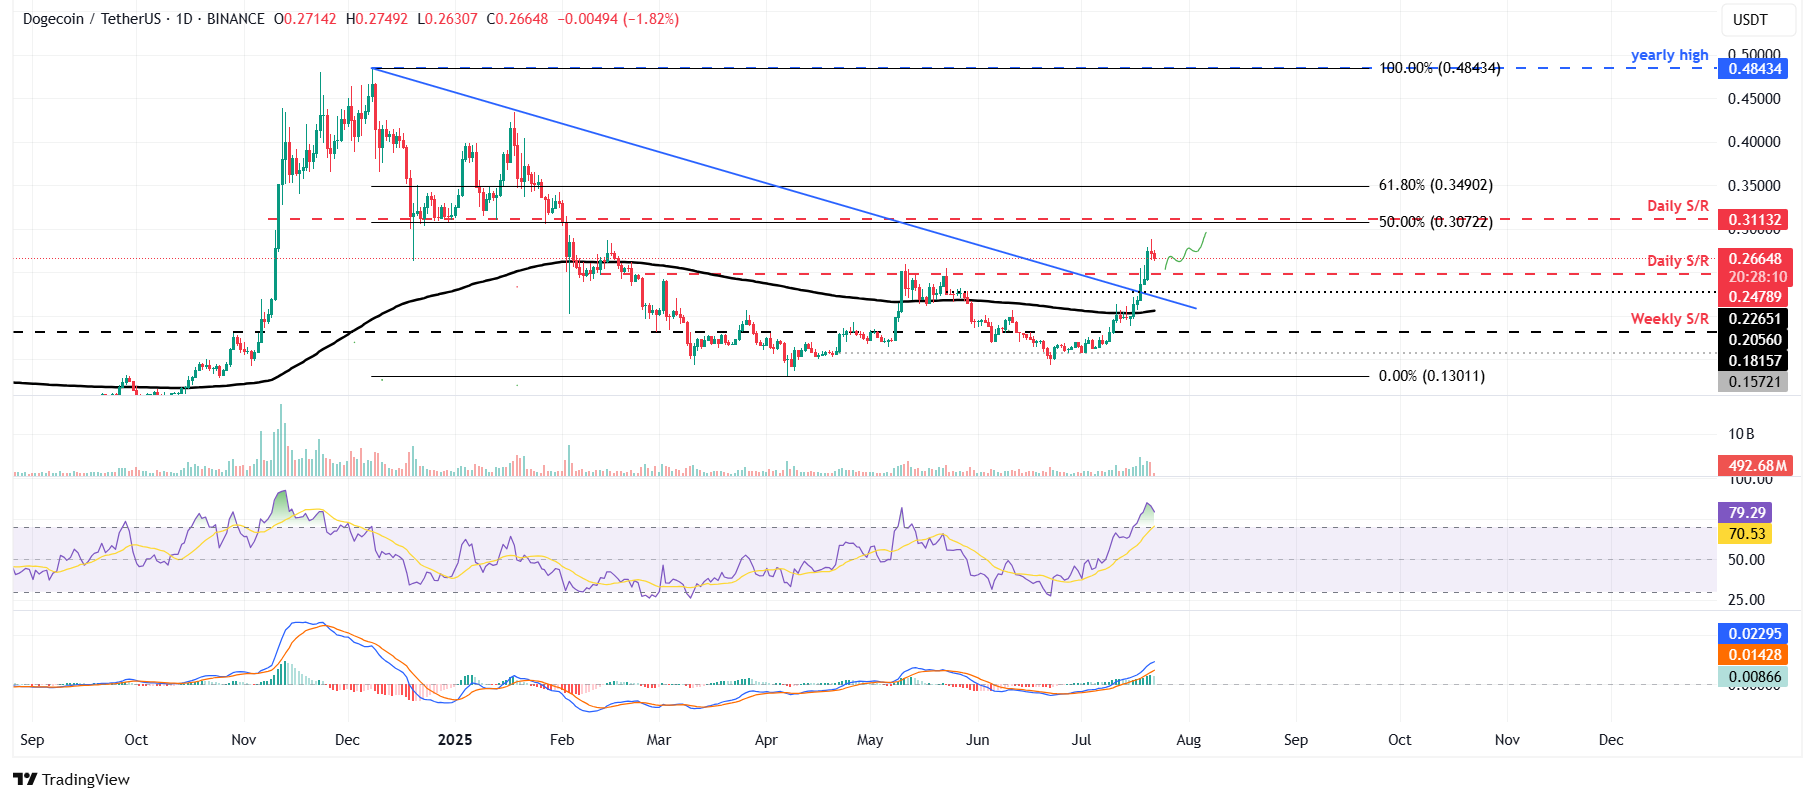
DOGE/USDT daily chart
However, if DOGE faces a pullback and closes below its daily support at $0.24, it could extend the decline to find support around the trendline breakout level at $0.22.
Shiba Inu Price Forecast: SHIB could rally if 200-day EMA holds
Shiba Inu price closed above the 200-day Exponential Moving Average (EMA) at $0.000014 on Friday and rallied by 5.45% over the next three days. At the time of writing on Tuesday, it trades slightly down at around $0.000015.
If the 200-day EMA at $0.000014 holds as support, SHIB could extend the rally toward May 12 high of $0.000017.
Like Dogecoin, SHIB’s RSI indicates an overbought condition while MACD suggests continuation of a bullish momentum.
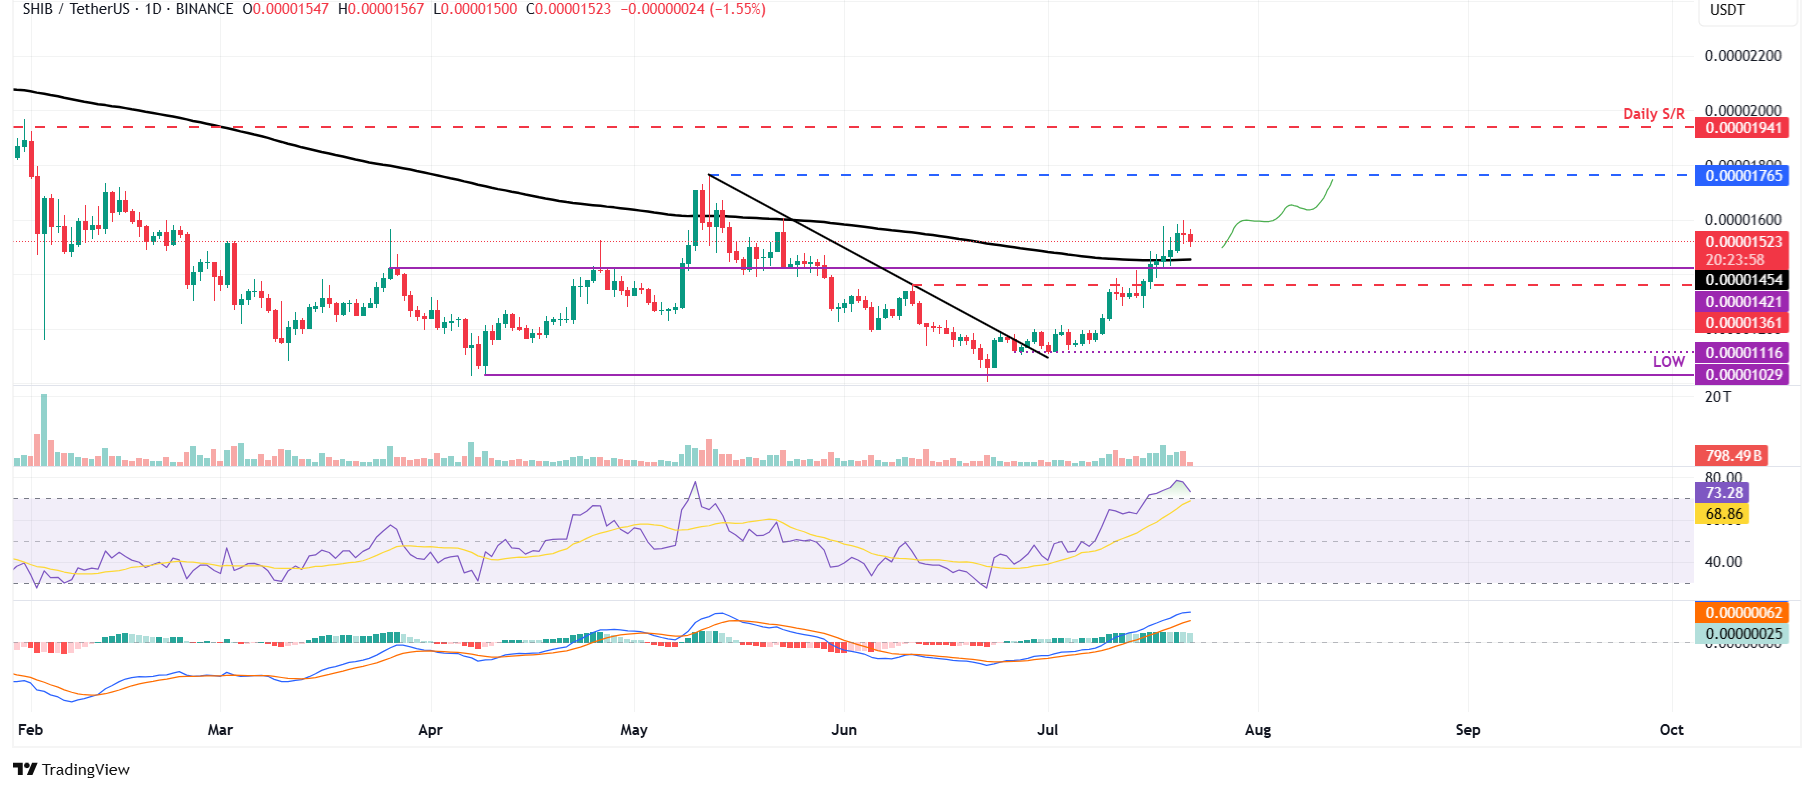
SHIB/USDT daily chart
On the other hand, if SHIB faces a correction and closes below the 200-day EMA, it could extend the decline to find support around its daily level at $0.000013.
Recommended Articles


