


Top Crypto Gainers: XLM, HBAR, ALGO – Double-digit breakout gains outpace crypto market
- Stellar’s XLM extends the trendline breakout rally for the seventh consecutive day, nearing $0.50.
- Hedera’s recovery registers a four-month high, eyes $0.37.
- Algorand’s quick trend reversal also hits a four-month high with its seventh consecutive day of gains, targeting $0.31.
Bitcoin (BTC) reached a record high of $119,488 on Sunday, positioning itself as a hedge like Gold (XAU) against the US dollar amid tightening global trade tensions by President Donald Trump. With the increased capital inflows in the crypto market, Stellar (XLM), Hedera (HBAR), and Algorand (ALGO) post double-digit gains in the last 24 hours, outpacing the other top 100 cryptocurrencies. The technical outlook for the top performers suggests extended trendline breakout gains as the bullish momentum holds.
Stellar eyes further gains as it exceeds $0.50
XLM edges higher by 8% at press time on Monday, reclaiming the $0.50 psychological mark. Stellar extends the trendline breakout rally with its seventh positive day, which could be on the back of growing anticipation of PayPal’s USD stablecoin issuance on its network.
A daily close above $0.50 would increase the chances of XLM surpassing the year-to-date at $0.5150. Beyond this, the December 1 high of $0.5607 could be the next immediate price target.
The shift in the cross-border payment tokens’ trend catalyzes an upshift in the 50-day Exponential Moving Average (EMA), teasing a golden crossover with the 200-day EMA at $0.2772. Typically, sidelined investors consider this a sign of trend reversal and a buying opportunity.
The technical indicators share a bullish bias as the Moving Average Convergence/Divergence (MACD) indicator displays a surge of histogram bars above the zero line, while the Relative Strength Index (RSI) at 91 tags the condition as overbought.
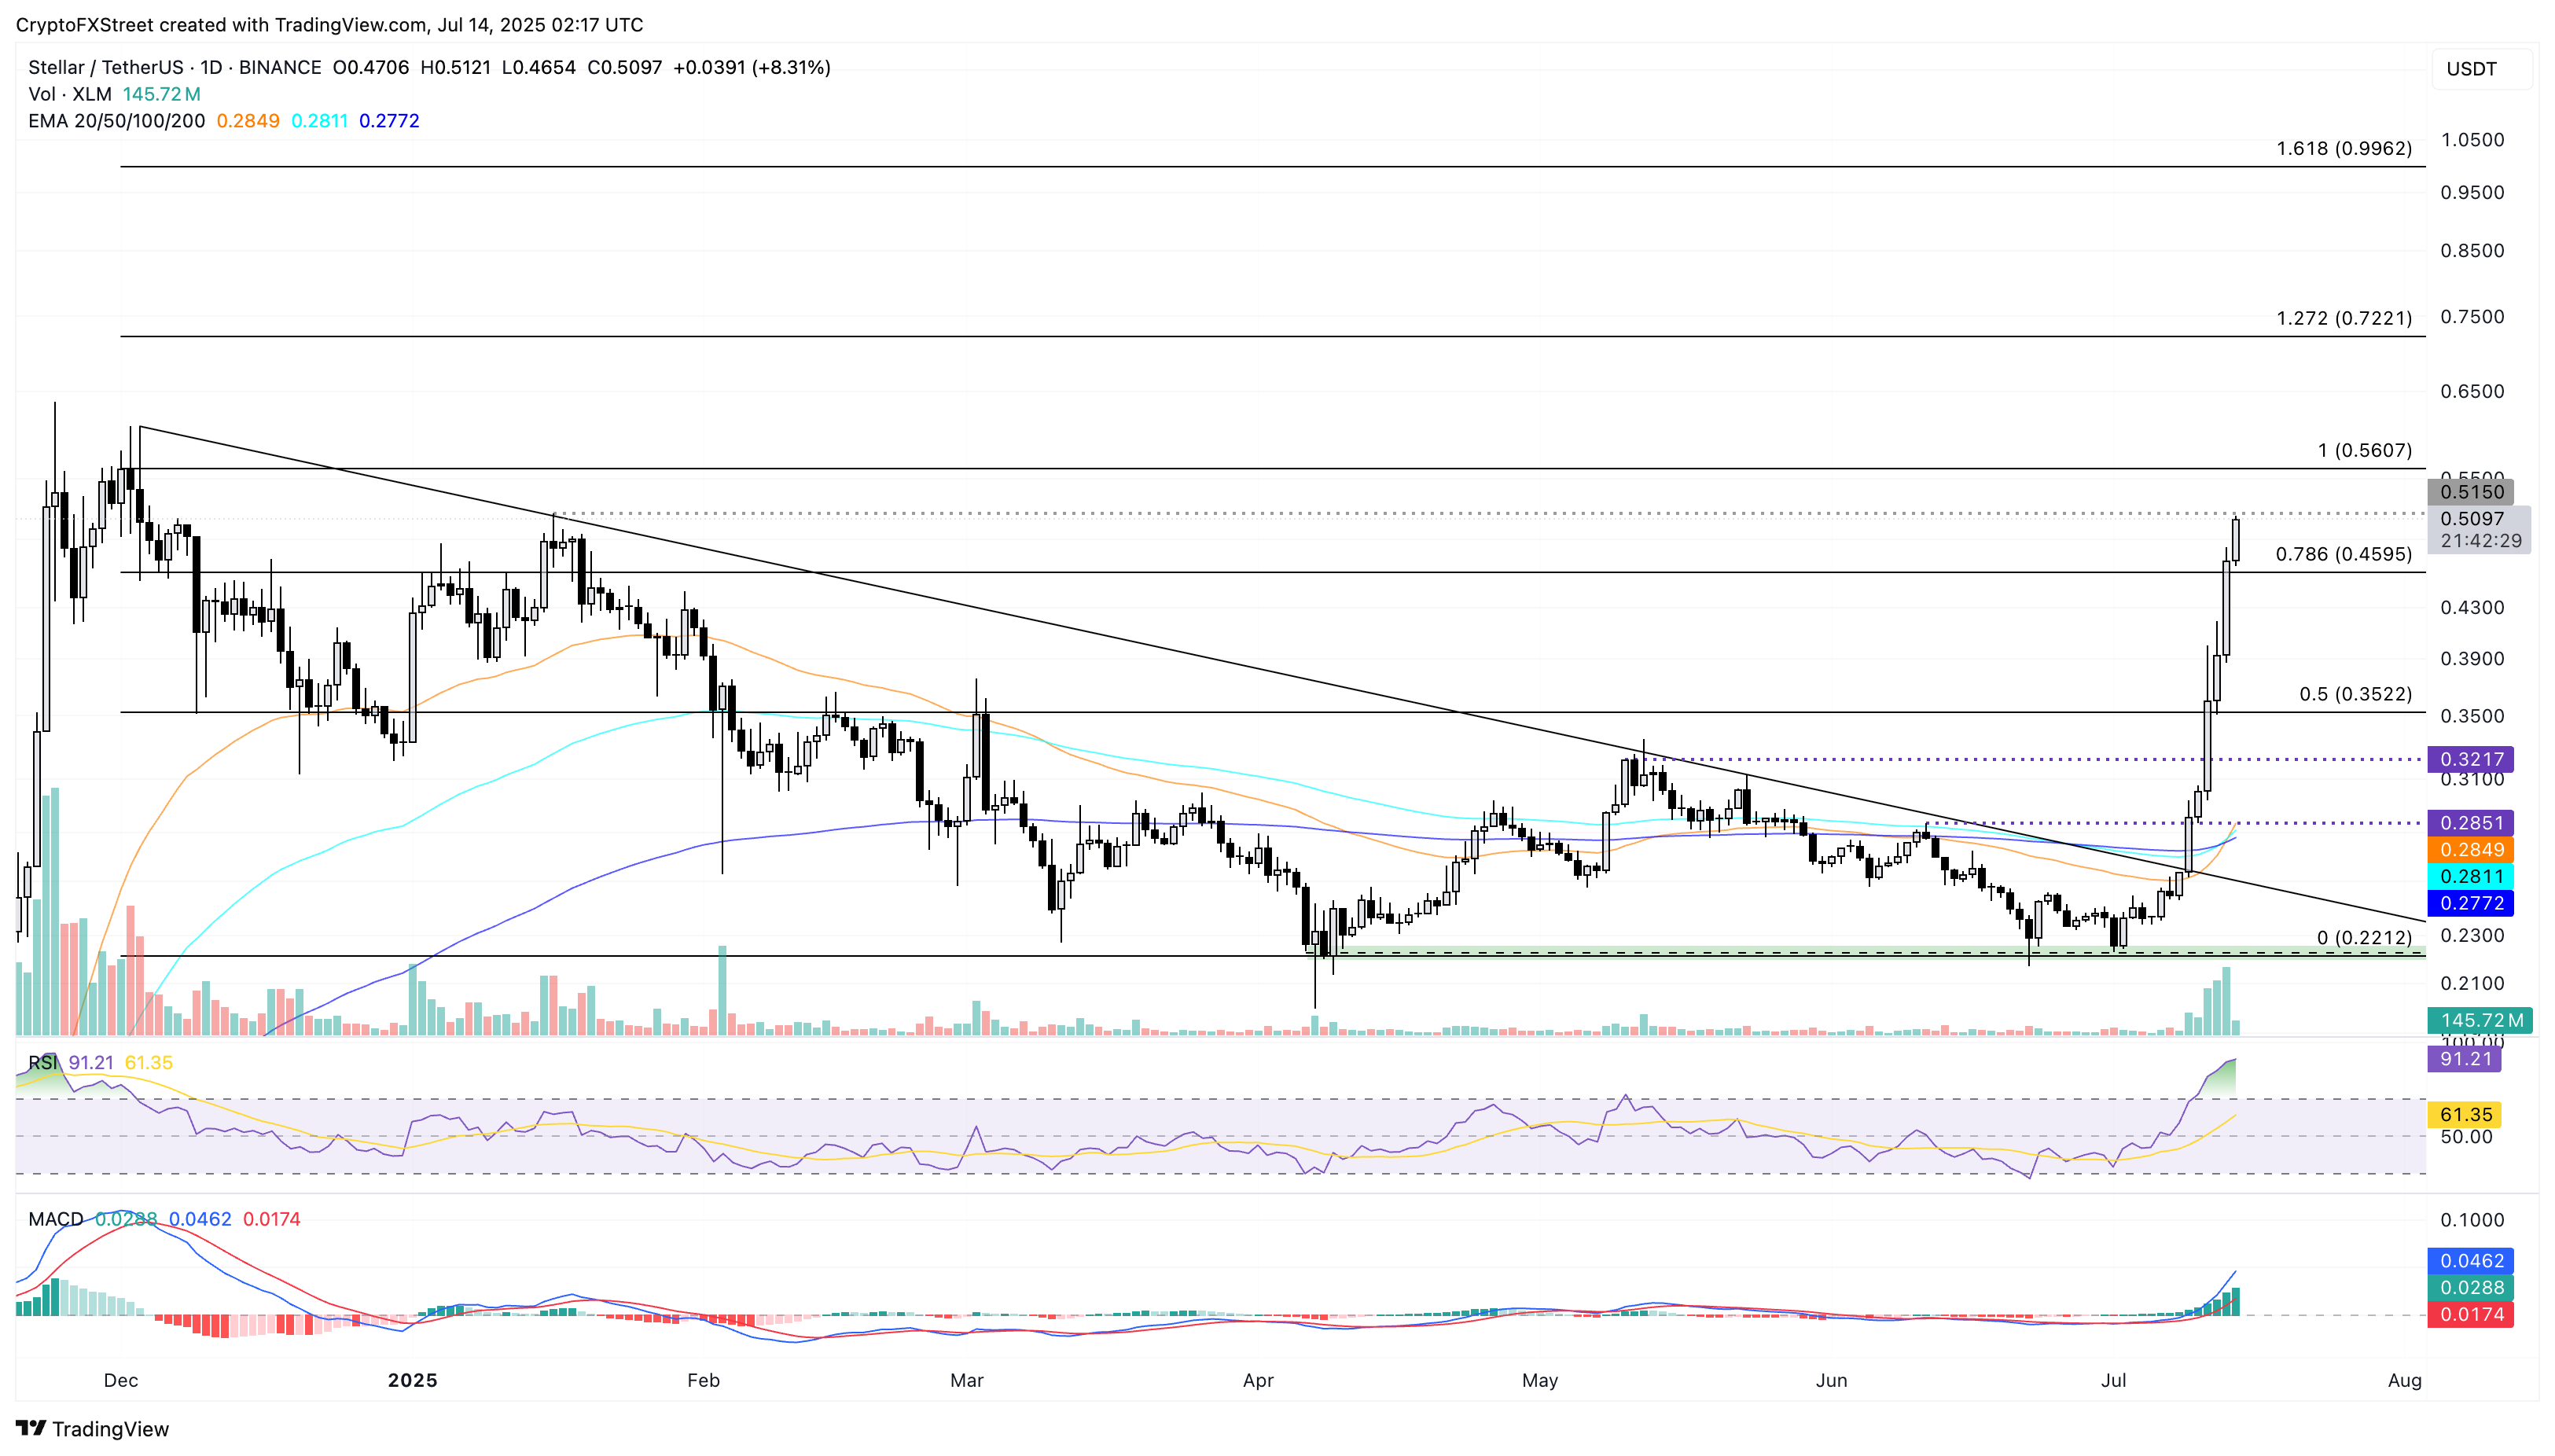
XLM/USDT daily price chart.
If XLM fails to uphold above $0.50, it could retest the $0.4595 level.
Hedera’s breakout rally holds bullish momentum
Hedera trades in the green for the seventh consecutive day with over 3% gains at press time. The sudden spark of bullish momentum in Hedera could be on the back of Hedera’s council member, Australian Payment Plus (AP+), selected to participate in the Reserve Bank of Australia’s tokenization pilot, Acacia, on Thursday.
Hedera’s trendline breakout rally inches closer to the $0.2659 resistance, last tested on March 3. A decisive daily close above this level would increase the chances of further gains in HBAR, targeting the $0.3288 level last tested on January 26.
The MACD indicator shows a surge in green histogram bars from the zero line, suggesting increased bullish momentum, while the RSI at 85 points to overbought conditions.
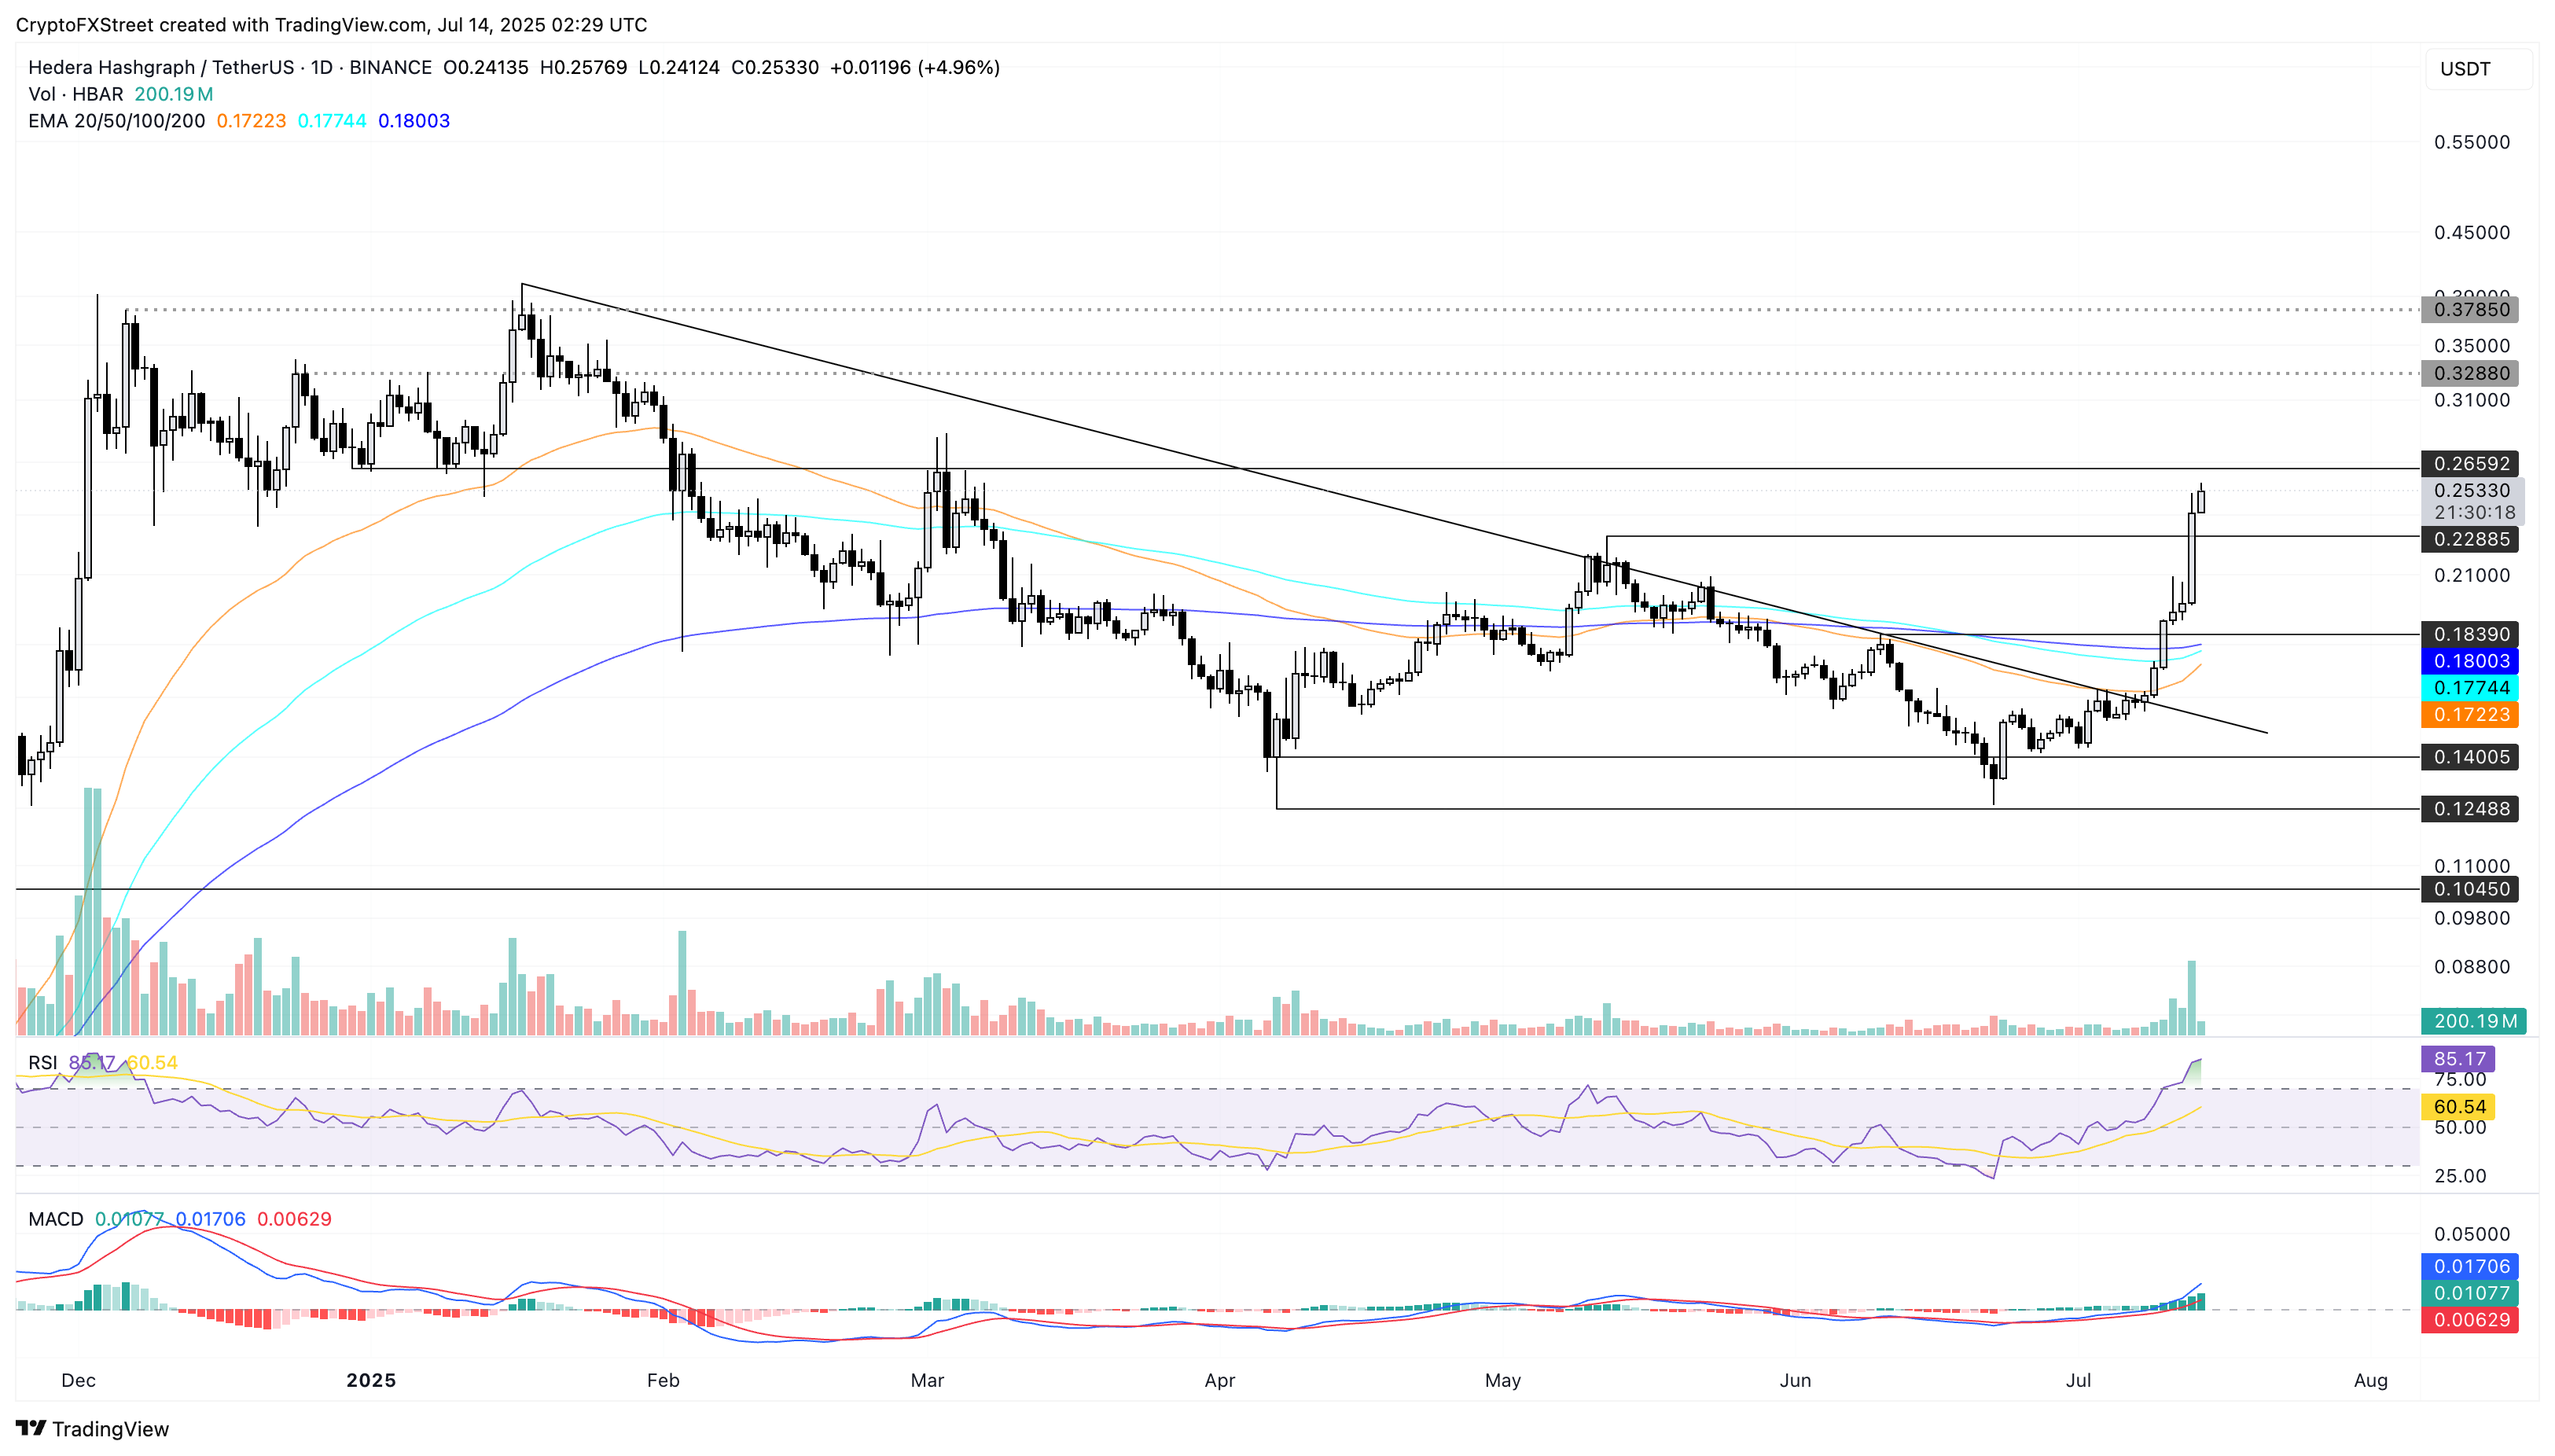
HBAR/USDT daily price chart.
A failure to hold above the $0.2288 level marked by the high of May 12 could extend the declining trend towards the 200-day EMA at $0.1800.
Algorand’s trend reversal eyes further gains
Algorand mimics the price action of the other two top performers, extending a trendline breakout rally. ALGO trades higher by over 2% on the day at the time of writing, recording a four-month high.
The uptrend targets the $0.3129 resistance level, last tested on February 11.
An upshift in the 50-day, 100-day, and 200-day EMAs increases the crossover chances, while they could absorb supply pressure in case of a bearish turnaround.
The MACD and RSI indicators are significantly higher above their neutral levels, pointing to increased bullish momentum.
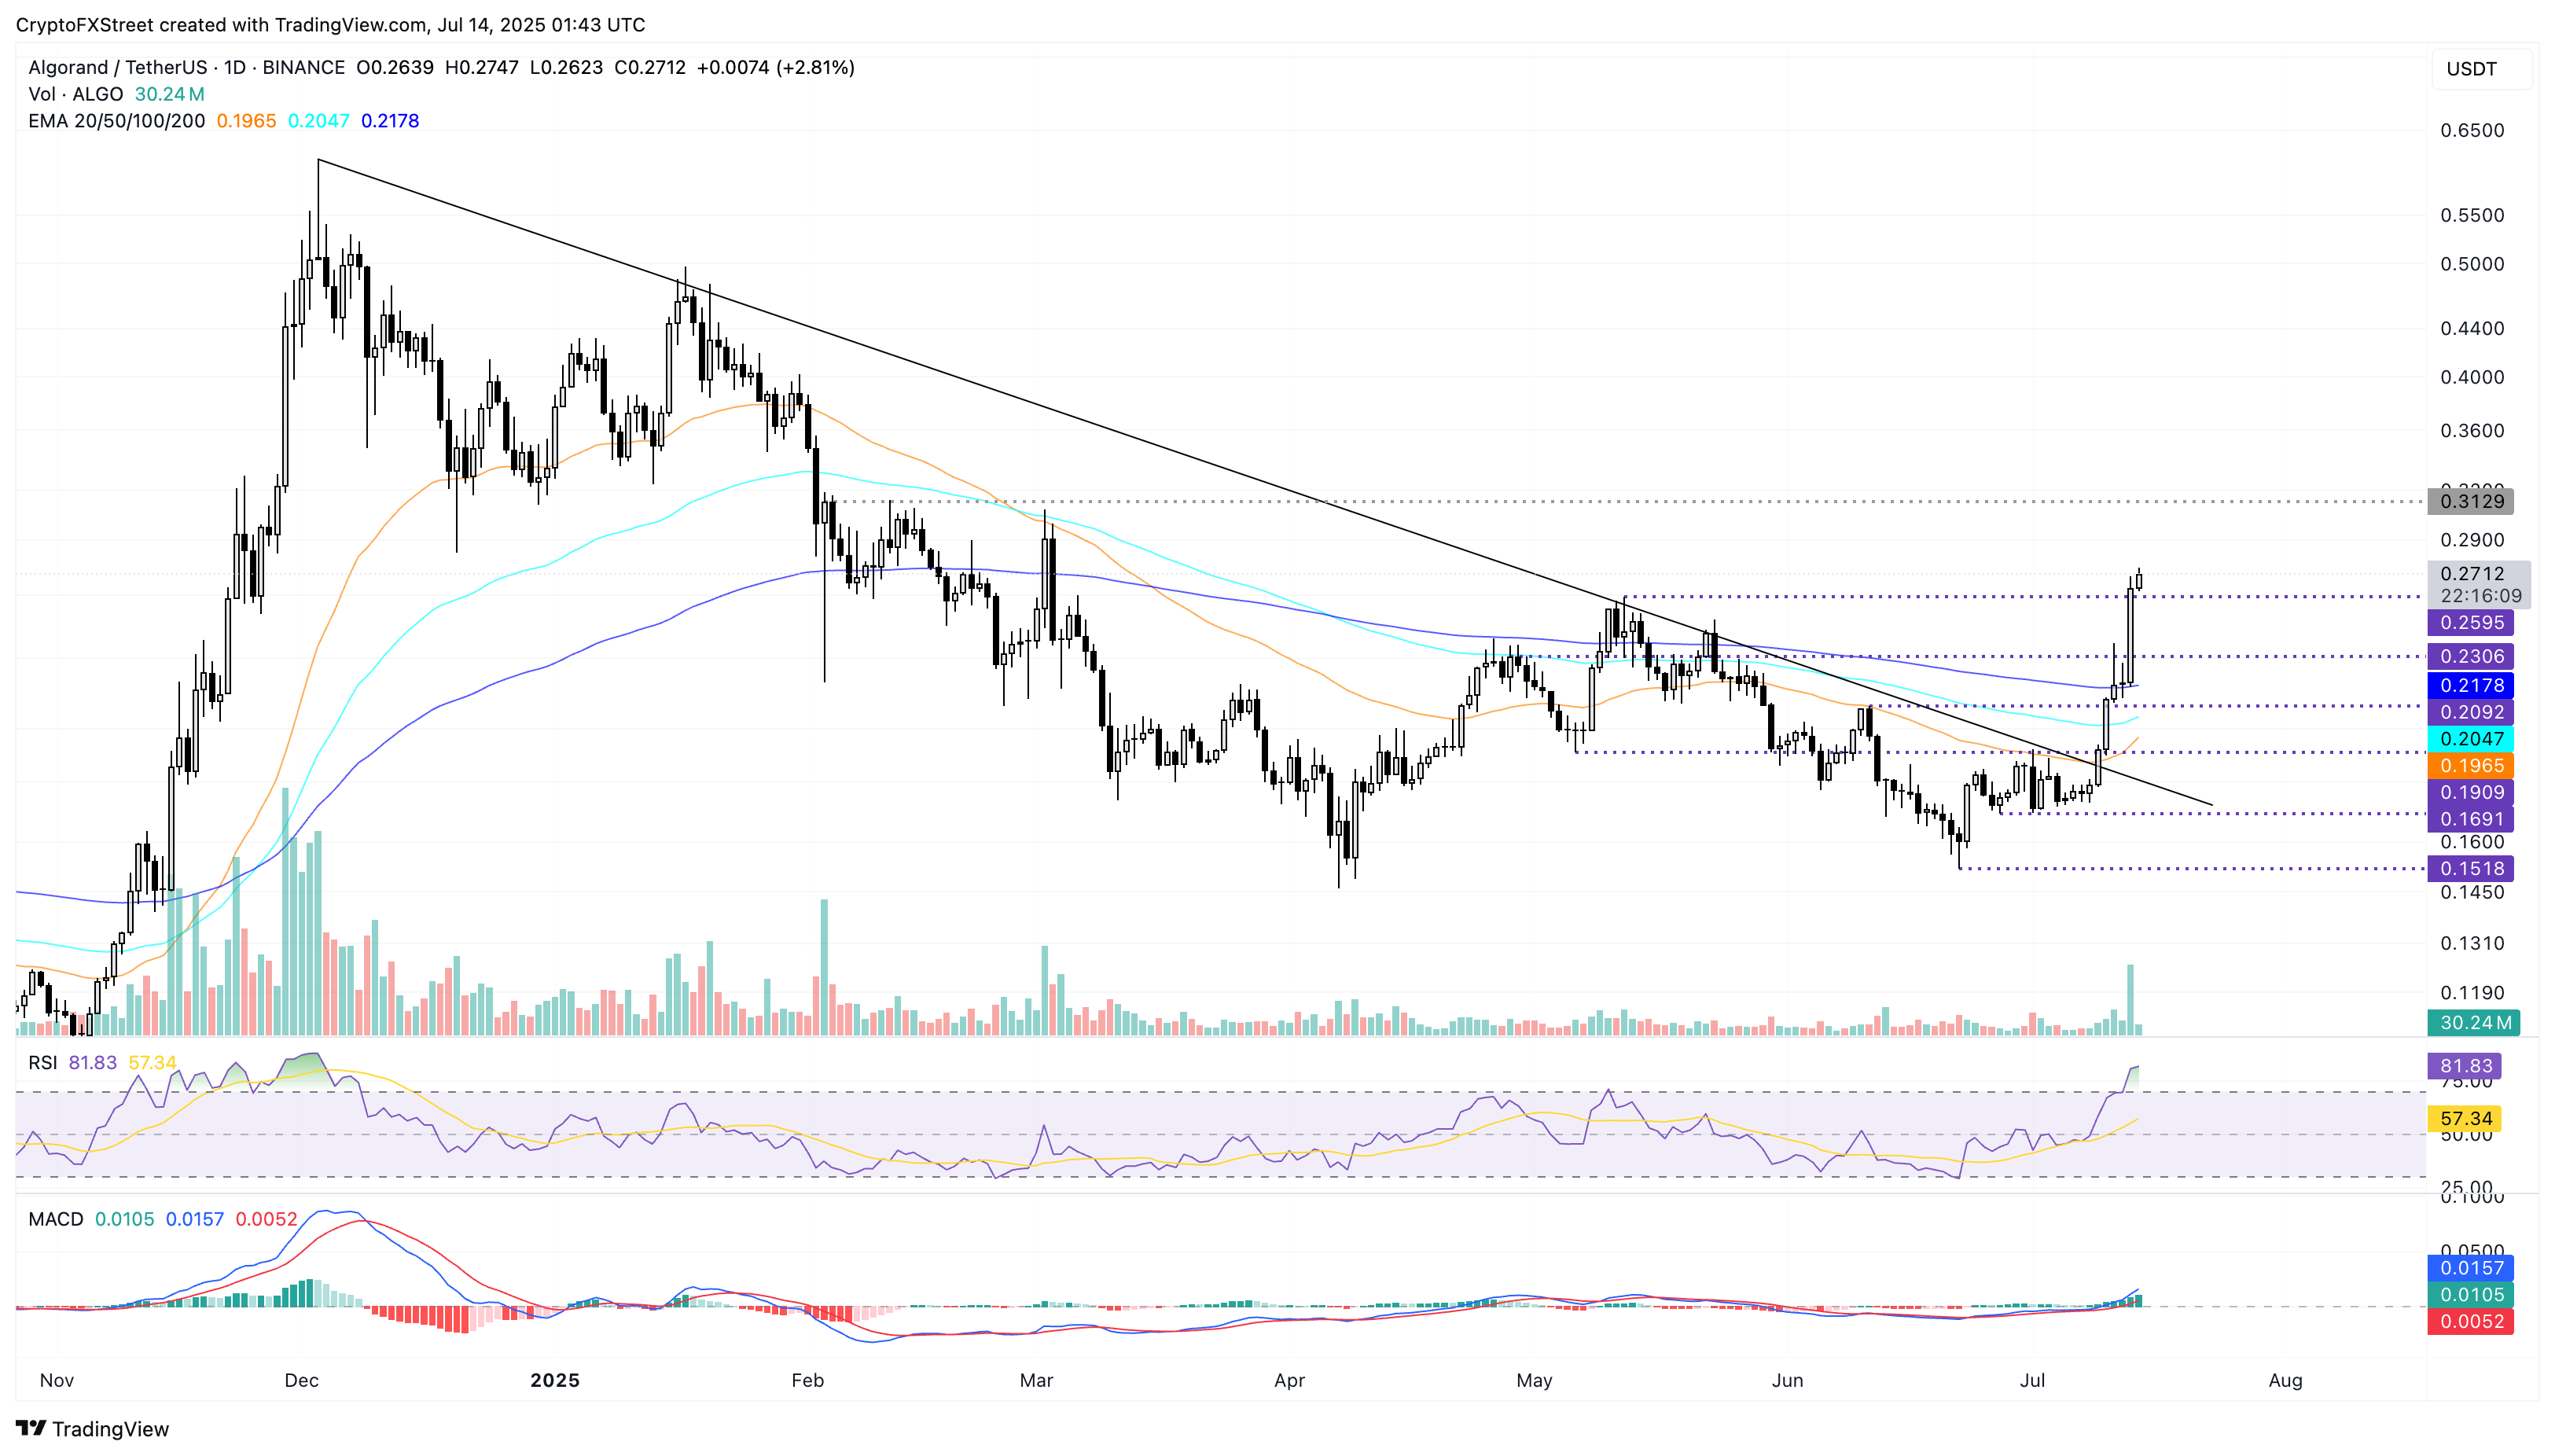
ALGO/USDT daily price chart.
If Algorand fails to uphold momentum, a reversal below $0.2595 support level could test the $0.2306 level, last tested on Friday.
Recommended Articles


