
Litecoin Nears Oversold Levels – What’s Next for LTC Price?
Litecoin (LTC) is down 5.6% in the last 24 hours, bringing its market cap close to $6.3 billion as selling pressure intensifies. The sharp drop has pushed key technical indicators into bearish territory, with momentum metrics weakening quickly.
RSI is approaching oversold levels, while the Ichimoku Cloud and EMA structures both suggest continued downside risk. Unless LTC finds support soon, its price could break lower before any meaningful recovery attempt begins.
Litecoin RSI Nears Oversold Territory as Momentum Weakens
Litecoin’s Relative Strength Index (RSI) has dropped sharply to 35.92, down from 61.4 just a day ago, reflecting a rapid shift in market momentum. The RSI is a momentum oscillator that measures the speed and magnitude of recent price changes, helping traders identify potential overbought or oversold conditions.
Values above 70 typically suggest an asset is overbought and may be due for a correction, while values below 30 indicate it may be oversold and potentially poised for a rebound.
Readings between 30 and 70 are considered neutral, signaling that price action is more balanced or consolidating.
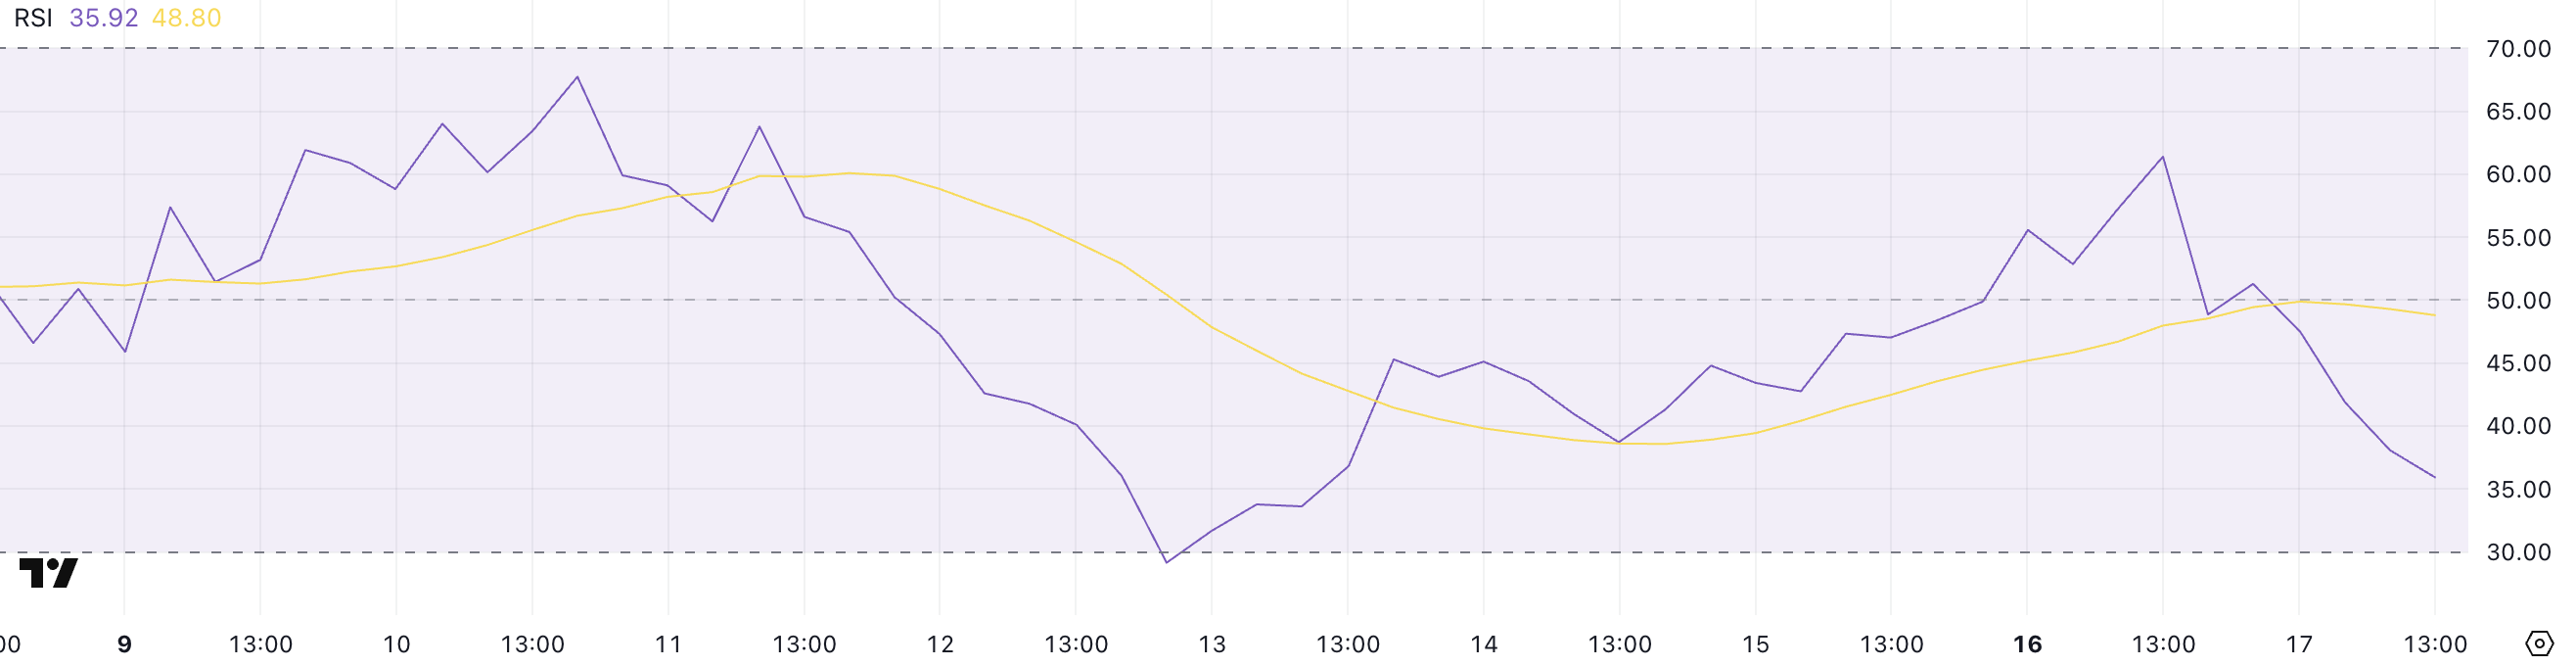 LTC RSI. Source: TradingView.
With Litecoin’s RSI now hovering just above the oversold threshold, the indicator suggests weakening bullish momentum and rising selling pressure.
While a reading of 35.92 does not yet confirm an oversold condition, it puts LTC dangerously close to levels where buyers might start looking for value opportunities. If the RSI dips below 30, it could signal a potential bottom and a short-term rebound.
However, if bearish sentiment continues to build, the RSI may stay suppressed—suggesting more downside risk before any meaningful recovery.
Litecoin Bearish Bias Strengthens as Ichimoku Cloud Turns Red
Litecoin’s Ichimoku Cloud chart currently presents a bearish configuration, with price action well below the red cloud (Kumo), indicating downward momentum.
The leading span lines—Senkou Span A (green) and Senkou Span B (red)—form a red cloud ahead, suggesting that the bearish trend may persist in the short term.
A thick red cloud typically reflects strong resistance above current price levels, making upward breakouts more difficult unless momentum decisively shifts.
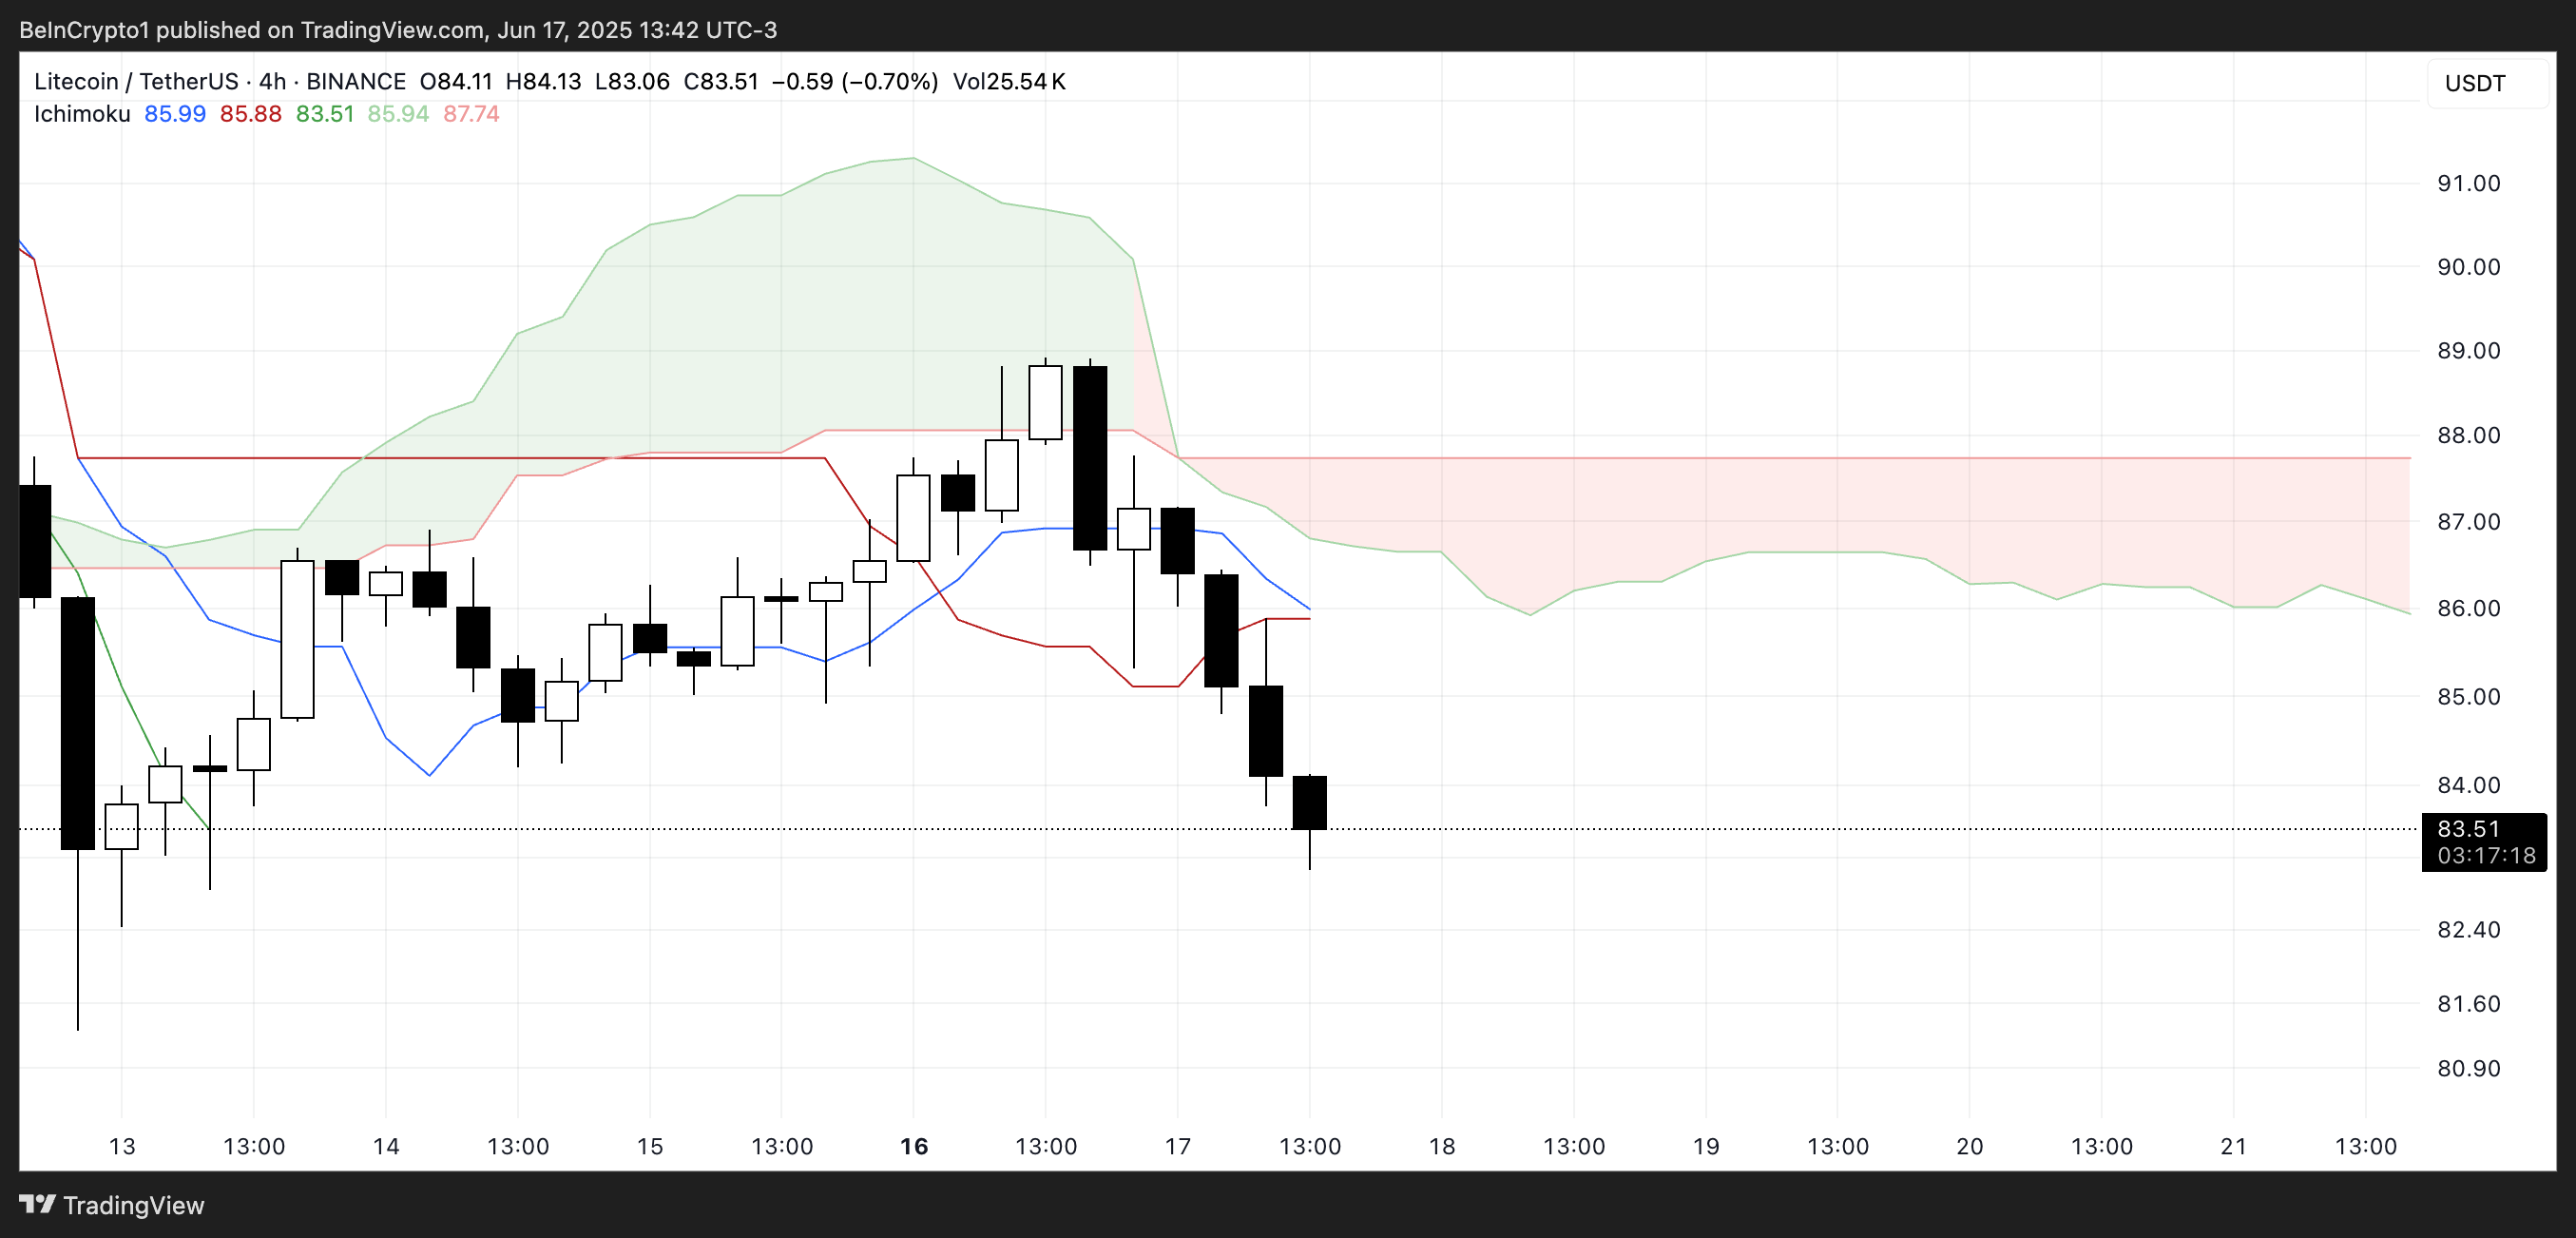 LTC Ichimoku Cloud. Source: TradingView.
Additionally, the Tenkan-sen (blue line) has crossed below the Kijun-sen (red line), further confirming the bearish bias.
This crossover reinforces short-term weakness, while the cloud ahead remains flat, signaling a lack of bullish conviction or volatility expansion.
With price candles continuing to move downward away from the cloud, the chart shows little sign of immediate trend reversal.
Litecoin Hovers Near Key Support as EMA Lines Keep Bearish
Litecoin price is currently hovering near a key support level at $83.11, with its price action showing signs of weakening momentum.
The EMA structure is bearish, as short-term moving averages remain below the longer-term ones—often interpreted as a signal of downward continuation.
If this support fails, LTC could slip toward lower levels, with $81.30 as the next potential downside target.
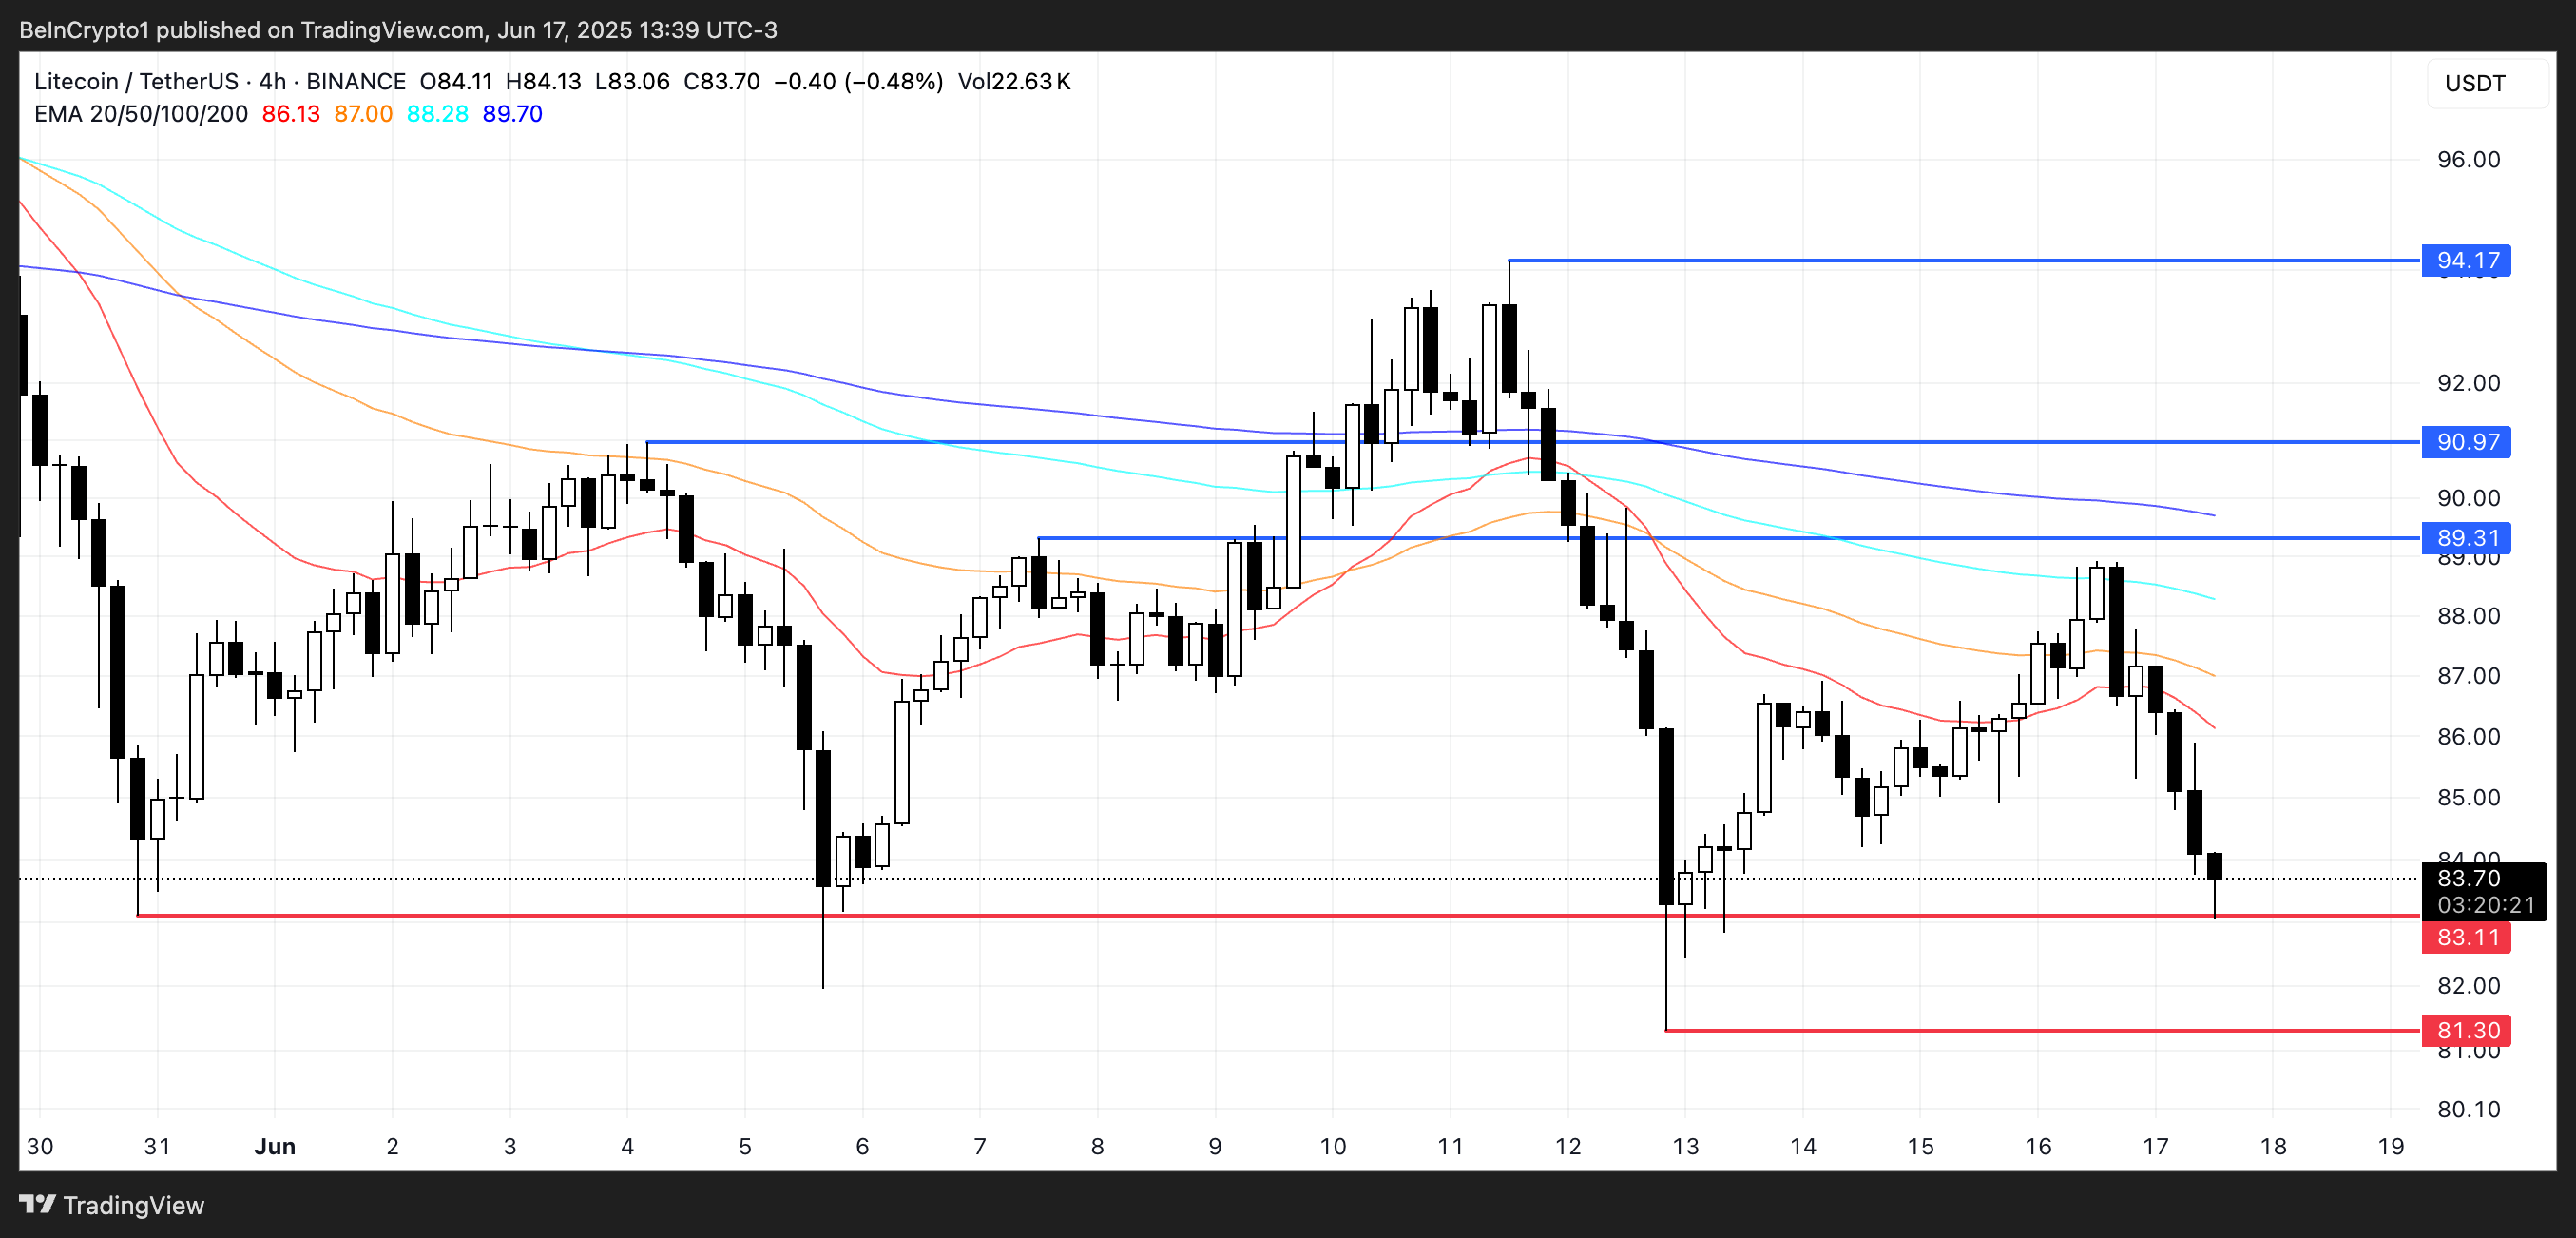 LTC Price Analysis. Source: TradingView.
However, a shift in momentum could lead to a recovery, especially if Litecoin reclaims higher ground and retests resistance at $89.31.
A clean breakout above that level may open the door for further gains toward $90.97 and possibly $94.17.
For now, the market remains at a technical crossroads, with both risk and opportunity hinging on the $83.11 support zone.
Recommended Articles


