
Ethereum Exchange Supply Drops To Record Low Of 4.9%
On-chain data shows the Ethereum Supply on Exchanges has plunged to a new all-time low as investors have continued to withdraw ETH.
Ethereum Supply On Exchanges Has Continued Its Downtrend Recently
In a new post on X, the on-chain analytics firm Santiment has discussed about the latest trend in the Supply on Exchanges for Ethereum. The “Supply on Exchanges” refers to an indicator that measures, as its name already suggests, the percentage of the total ETH supply that’s currently sitting in the wallets attached to centralized exchanges.
When the value of this metric rises, it means the investors are depositing a net number of tokens to these platforms. As one of the main reasons why holders may transfer their coins to exchanges is for selling-related purposes, this kind of trend can have a bearish impact on the coin’s price.
On the other hand, the indicator going down implies that supply is leaving the exchanges. Generally, investors withdraw their coins into self-custodial wallets when they plan to hold them in the long term, so such a trend can be bullish for the cryptocurrency.
Now, here is the chart shared by the analytics firm that shows the trend in the Supply on Exchanges for Ethereum over the last few years:
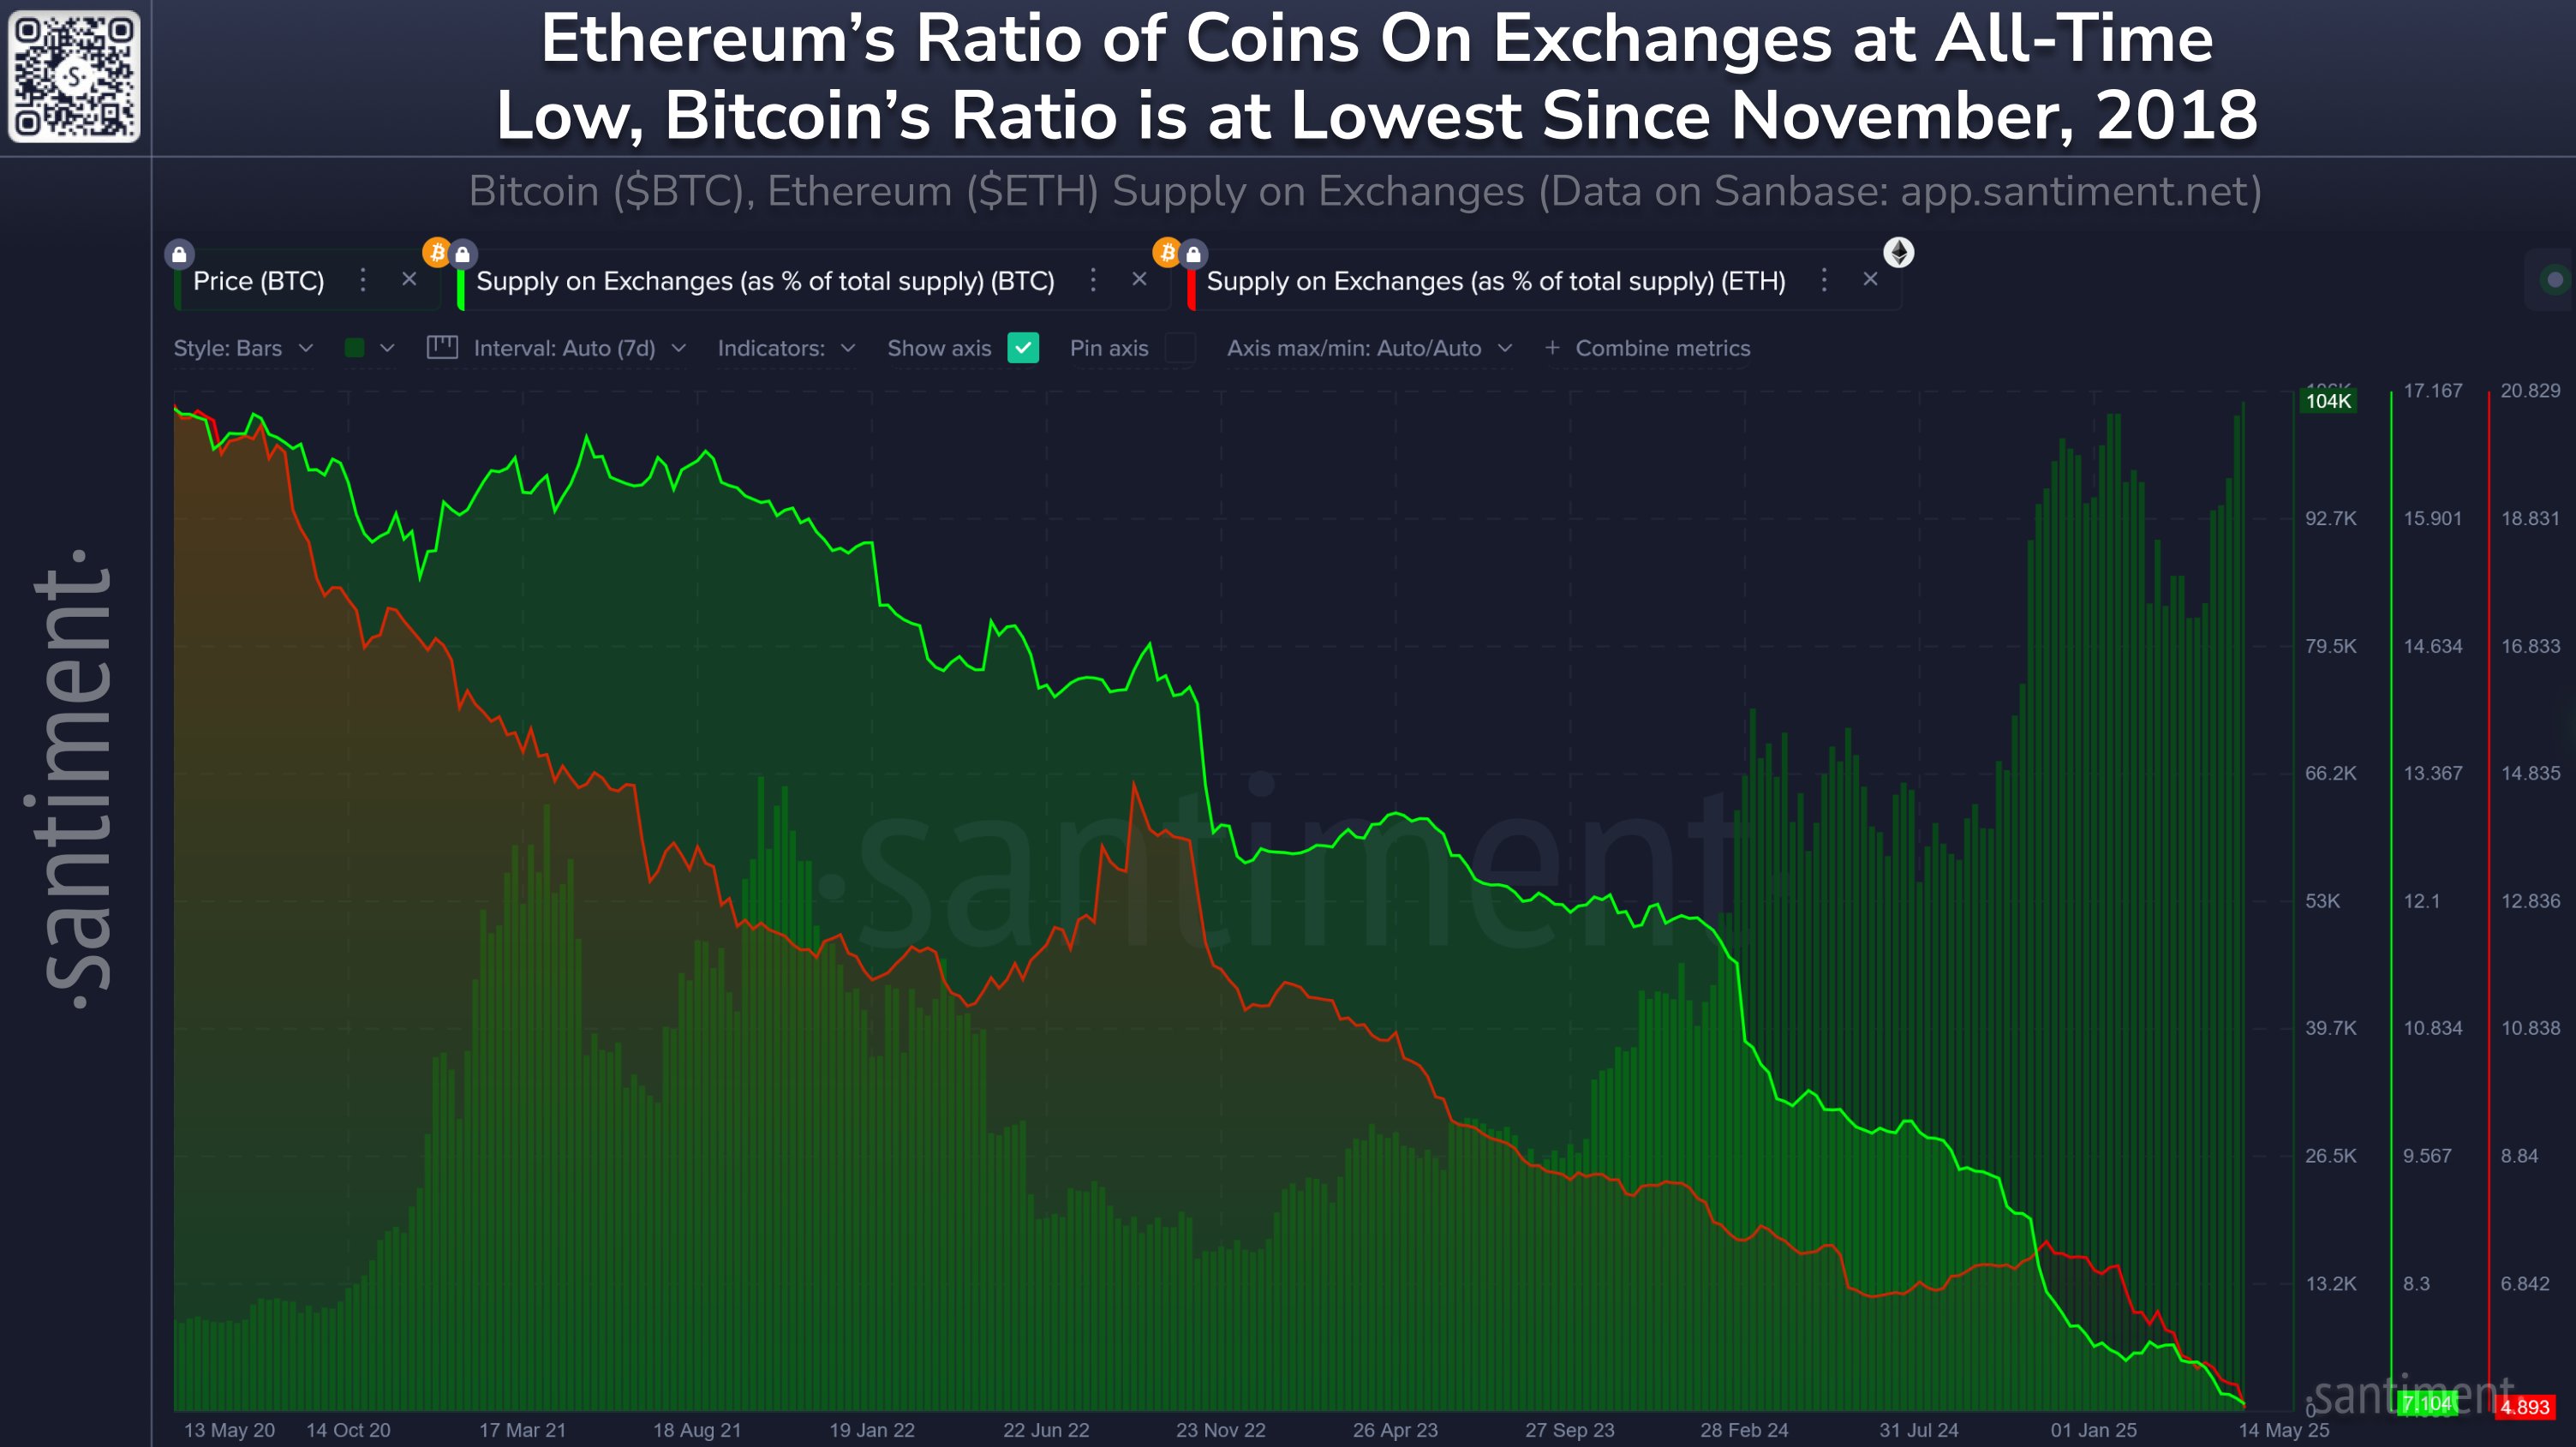
As displayed in the above graph, the Ethereum Supply on Exchanges has been showing a long-term downtrend, but there have been periods of temporary deviation.
One such phase came around the time of the bull run toward the end of 2024, a potential sign that some investors decided to exit from ETH during the profitable opportunity.
In the months since the peak, though, the indicator has gone back to the downward trajectory, suggesting that holders have resumed their accumulation. Today, the metric is sitting at 4.9%, which is the lowest value ever recorded.
In the same chart, Santiment has also attached the data for the Supply on Exchanges of Bitcoin. It would appear that the number one cryptocurrency has also seen a trend of net outflows during the last few years and unlike ETH, there haven’t been any notable instances of deviation.
Over the past five years, investors have withdrawn 1.7 million BTC from exchanges. This decline has taken the metric’s value to 7.1%, which is the lowest since November 2018. In the same period, ETH holders have taken out 15.3 million tokens of the asset from these platforms.
Something to keep in mind is that while exchanges played a central role in the market years ago, that’s no longer strictly the case. The emergence of the exchange-traded funds (ETFs) means there is now another major gateway into the sector, so exchange outflows may not carry quite the same impact as before anymore.
ETH Price
At the time of writing, Ethereum is floating around $2,500, down more than 2% in the last week.
Recommended Articles


