




Crypto Overview: Bitcoin dips below $78,000 – NEAR, ZEC sustain gains
- Bitcoin edges below $78,000 on Thursday, extending a near-term pullback for the fourth consecutive day.
- US Treasury increases buyback operations to $6 billion in long-term debt to tackle rising bond yields.
- Near Protocol and Zcash have sustained gains over the last 24 hours, emerging as top performers.
Bitcoin (BTC) trades below $78,000 on Thursday, maintaining a near-term corrective tone amid hawkish macroeconomic factors. US bond market shrugs off the US Treasury's increase in buyback operations to $6 billion in long-term debt as yields continue to rise, signaling an insufficient step amid the ongoing war with Iran.
CoinMarketCap’s Fear and Greed shows a reading of 70, projecting a consistent risk-on sentiment in the crypto market, but is down from 78 last week, indicating moderation. Near Protocol (NEAR) and Zcash (ZEC) have sustained gains over the last 24 hours, emerging as top performers.
Bitcoin extends pullback as buying pressure eases
Bitcoin trades around $77,992 at press time on Thursday, maintaining a corrective tone so far this week. Still, BTC holds well above the main Exponential Moving Averages (EMAs), with the 50-day EMA near $73,011, the 200-day EMA around $73,425 and the 100-day EMA at about $70,731, suggesting a broadly supported uptrend.
Amid the ongoing pullback, upside momentum is easing, with the Relative Strength Index (RSI) easing to roughly 58 from overbought territory while the Moving Average Convergence Divergence (MACD) drifts below the signal line, reaffirming that upside traction is slowing.
On the downside, initial support emerges at the 50% retracement of the downswing from $97,924 to $57,800 at $75,233, followed by the 200-day EMA around $73,011, which reinforces the medium-term trend floor if sellers extend a corrective move. A deeper slide would expose the 50-day EMA near $72,762 ahead of the 100-day EMA around $70,731, where buyers would be expected to regroup to defend the broader bullish structure.
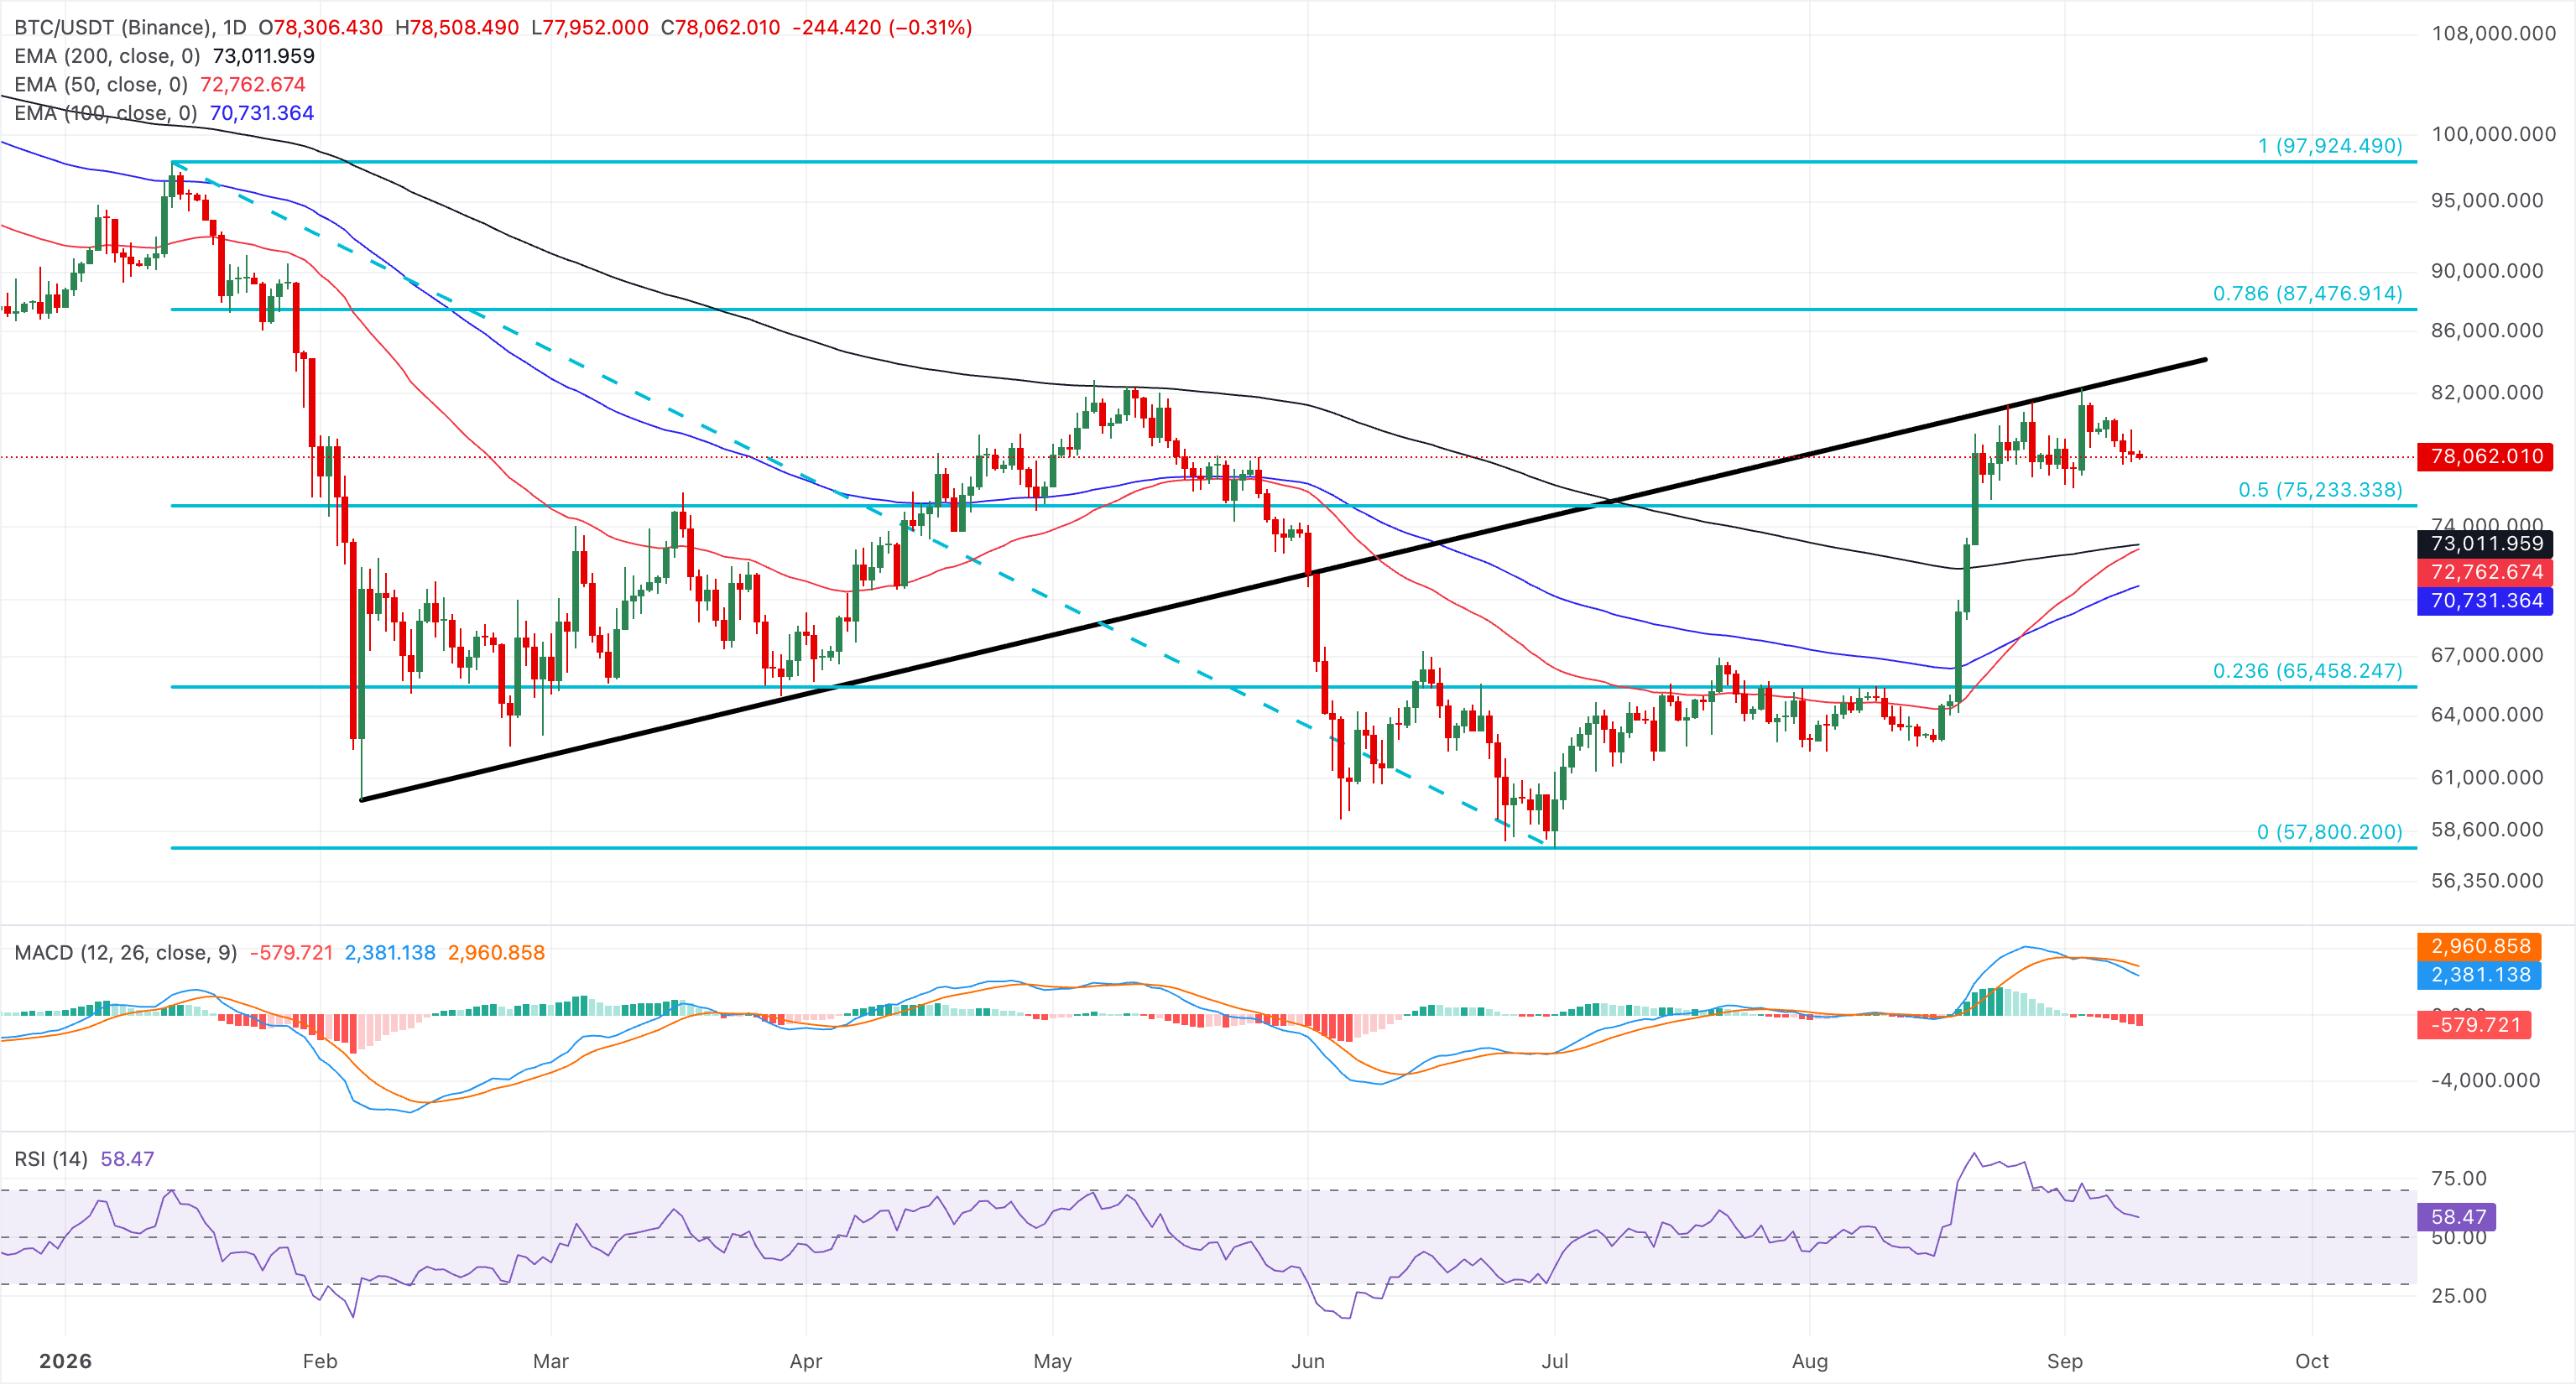
Looking up, Bitcoin must clear the $80,000 to $82,500 sell wall, reinforced by the broken support-turned-resistance trendline near $82,850 for a sustained recovery toward the 78.6% Fibonacci retracement level at $87,476.
Near Protocol and Zcash sustain upward momentum
Near Protocol trades around $2.44 on Thursday, keeping a clear bullish near-term bias. NEAR holds well above the 50-, 100-, and 200-day EMAs clustered between roughly $1.83 and $1.95.
The RSI around 69 hints at strong but stretched upside momentum, while the MACD remains in positive territory above its signal line, suggesting buyers still control the tape even as conditions approach overbought.
The immediate resistance for NEAR aligns with the 78.6% Fibonacci retracement at $2.65, measured from the high of $3.08 to the low of $1.53. A confirmed breakout above this level could target the $3.08 high.
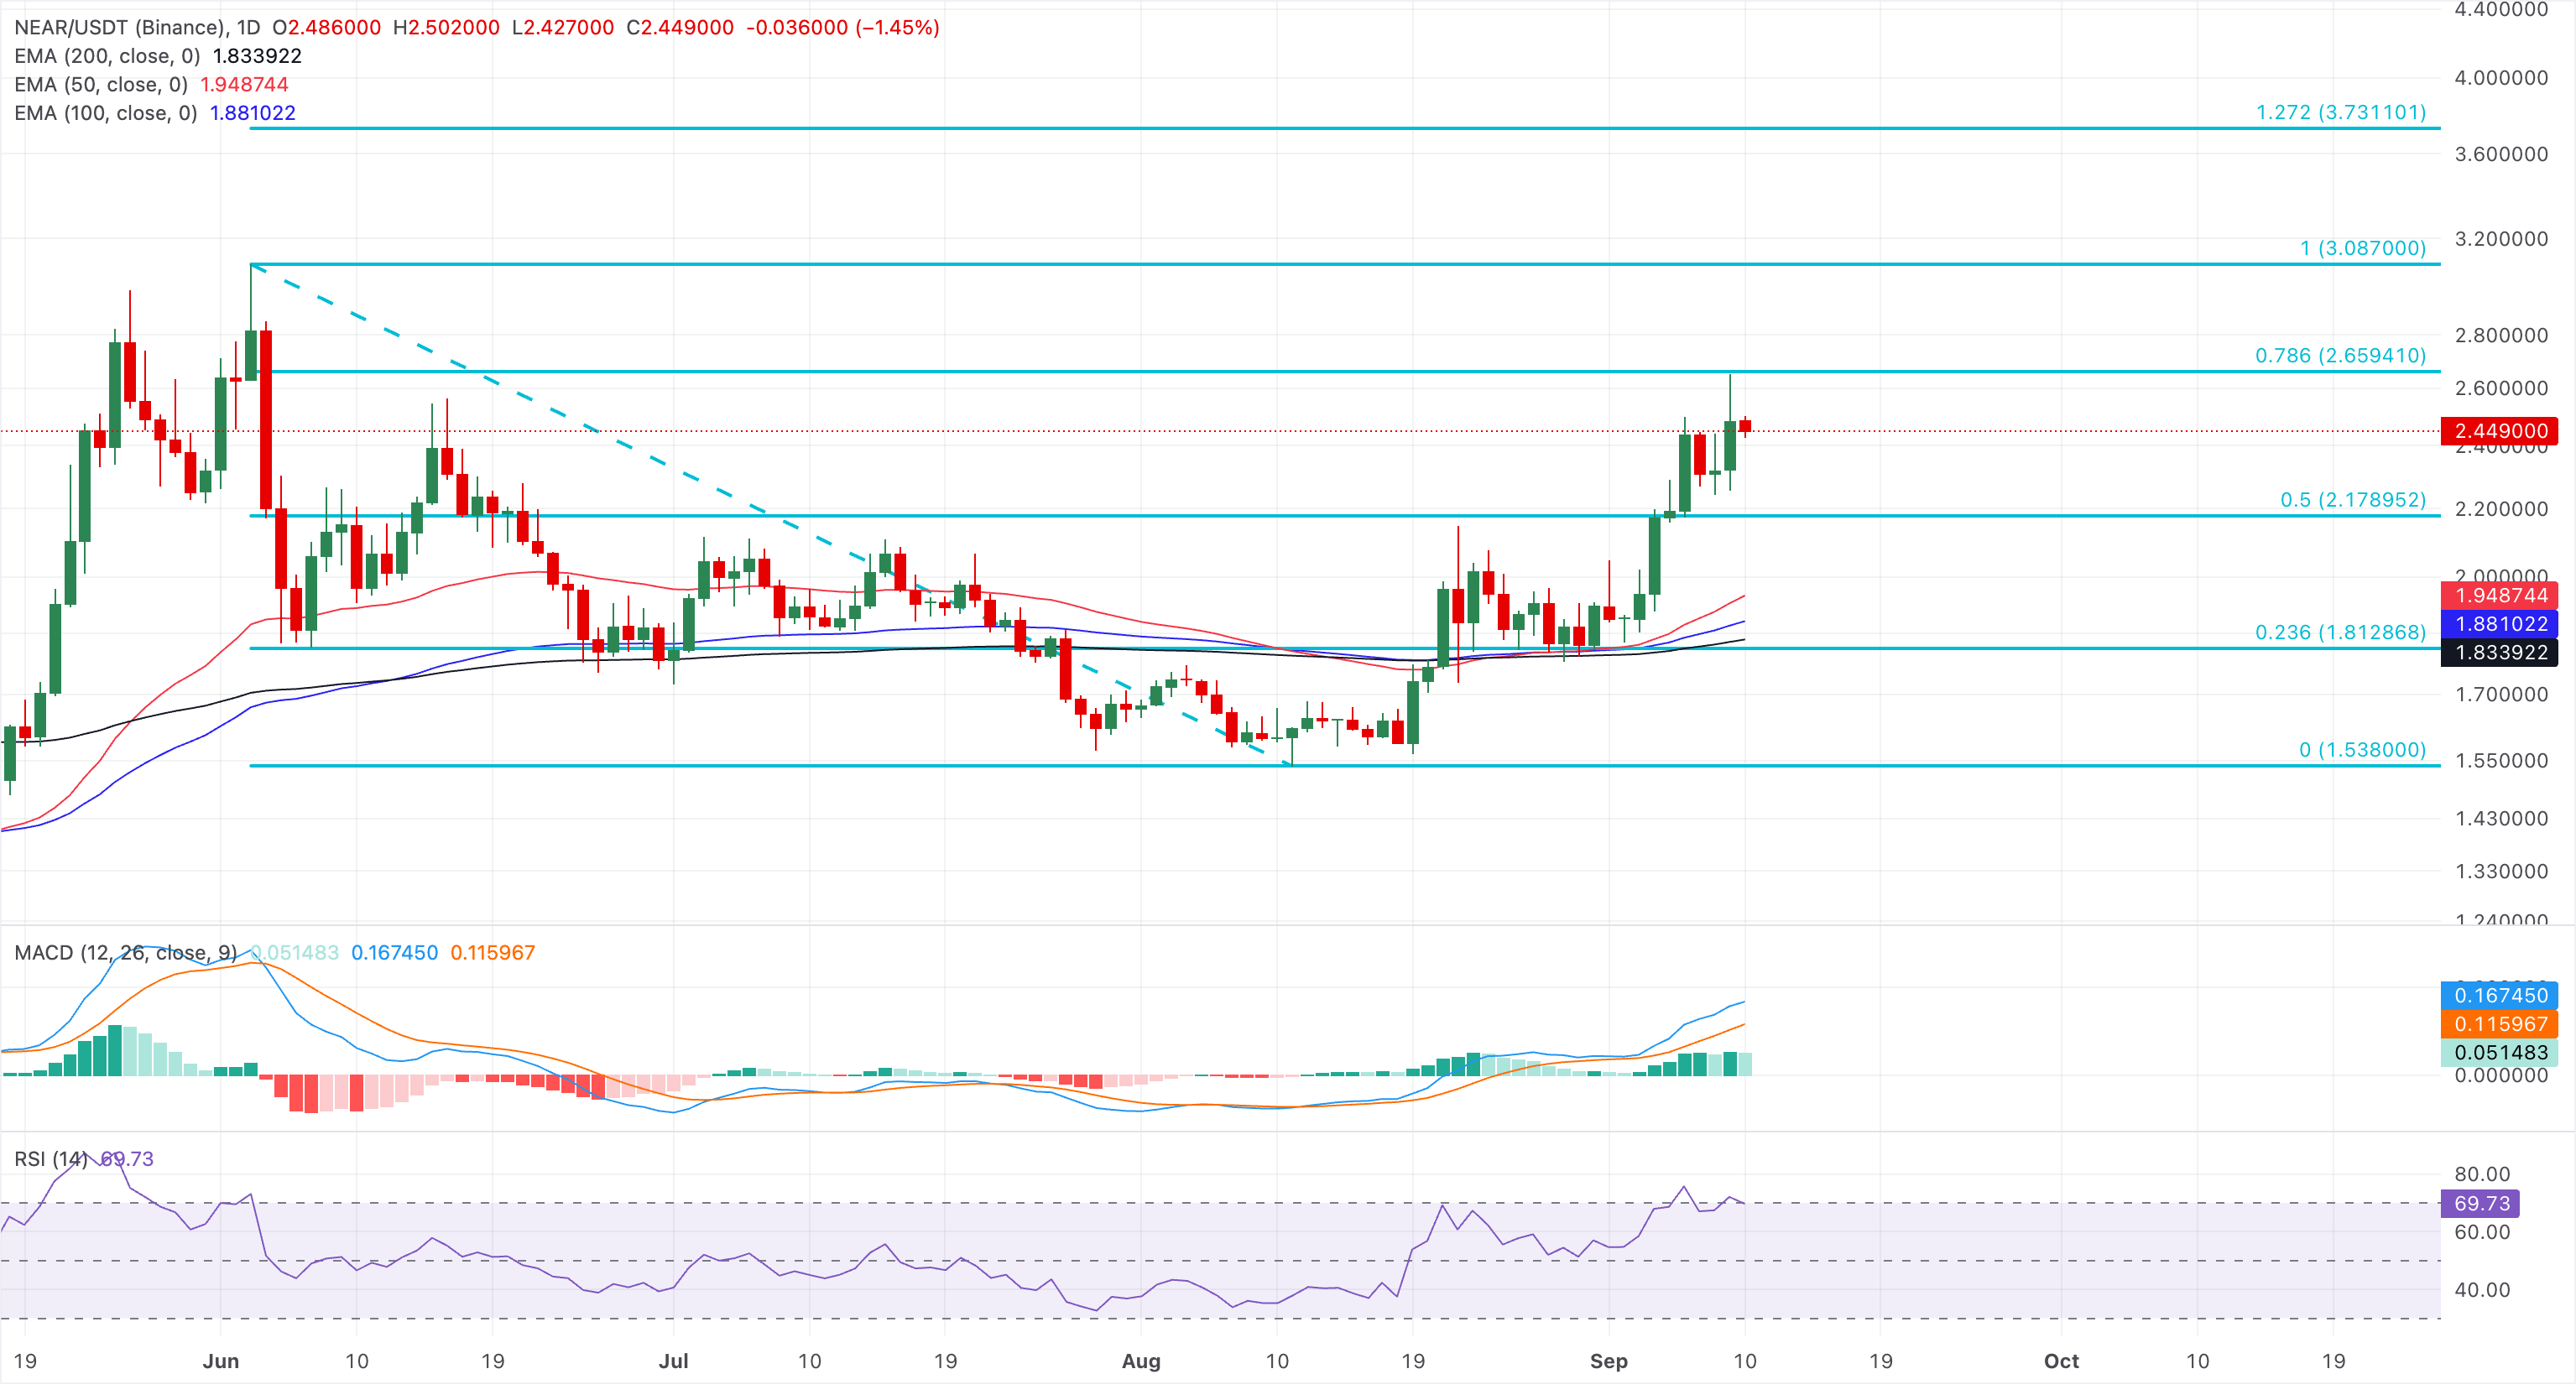
On the downside, initial support is seen at the 50% retracement level around $2.17, with deeper demand expected near the rising EMA stack between about $1.88 and $1.95, backed by the 38.2% retracement at $2.1297 and the 23.6% level at $1.81, reinforcing the broader constructive structure while it holds.
Zcash remains well above $1,200 at press time on Thursday, sustaining a strong bullish bias. The stacked configuration of the EMAs, with the 50-day EMA at $765 sitting above the 100-day EMA at $640 and the 200-day EMA at $530, reinforces an established uptrend.
Momentum remains overheated, with the RSI hovering around 75, and the MACD staying positive with a healthy spread above its signal line, suggesting a stretched bullish trend vulnerable to corrective pullbacks.
On the downside, initial support is seen at the psychological $1,200 area, ahead of a deeper cushion provided by the R2 and R1 pivot levels at $1,162 and $1,005, respectively. Further below, the 50-day EMA at $765 aligns with the prior consolidation range in late August, which could act as a key demand zone on any sharp retracement.
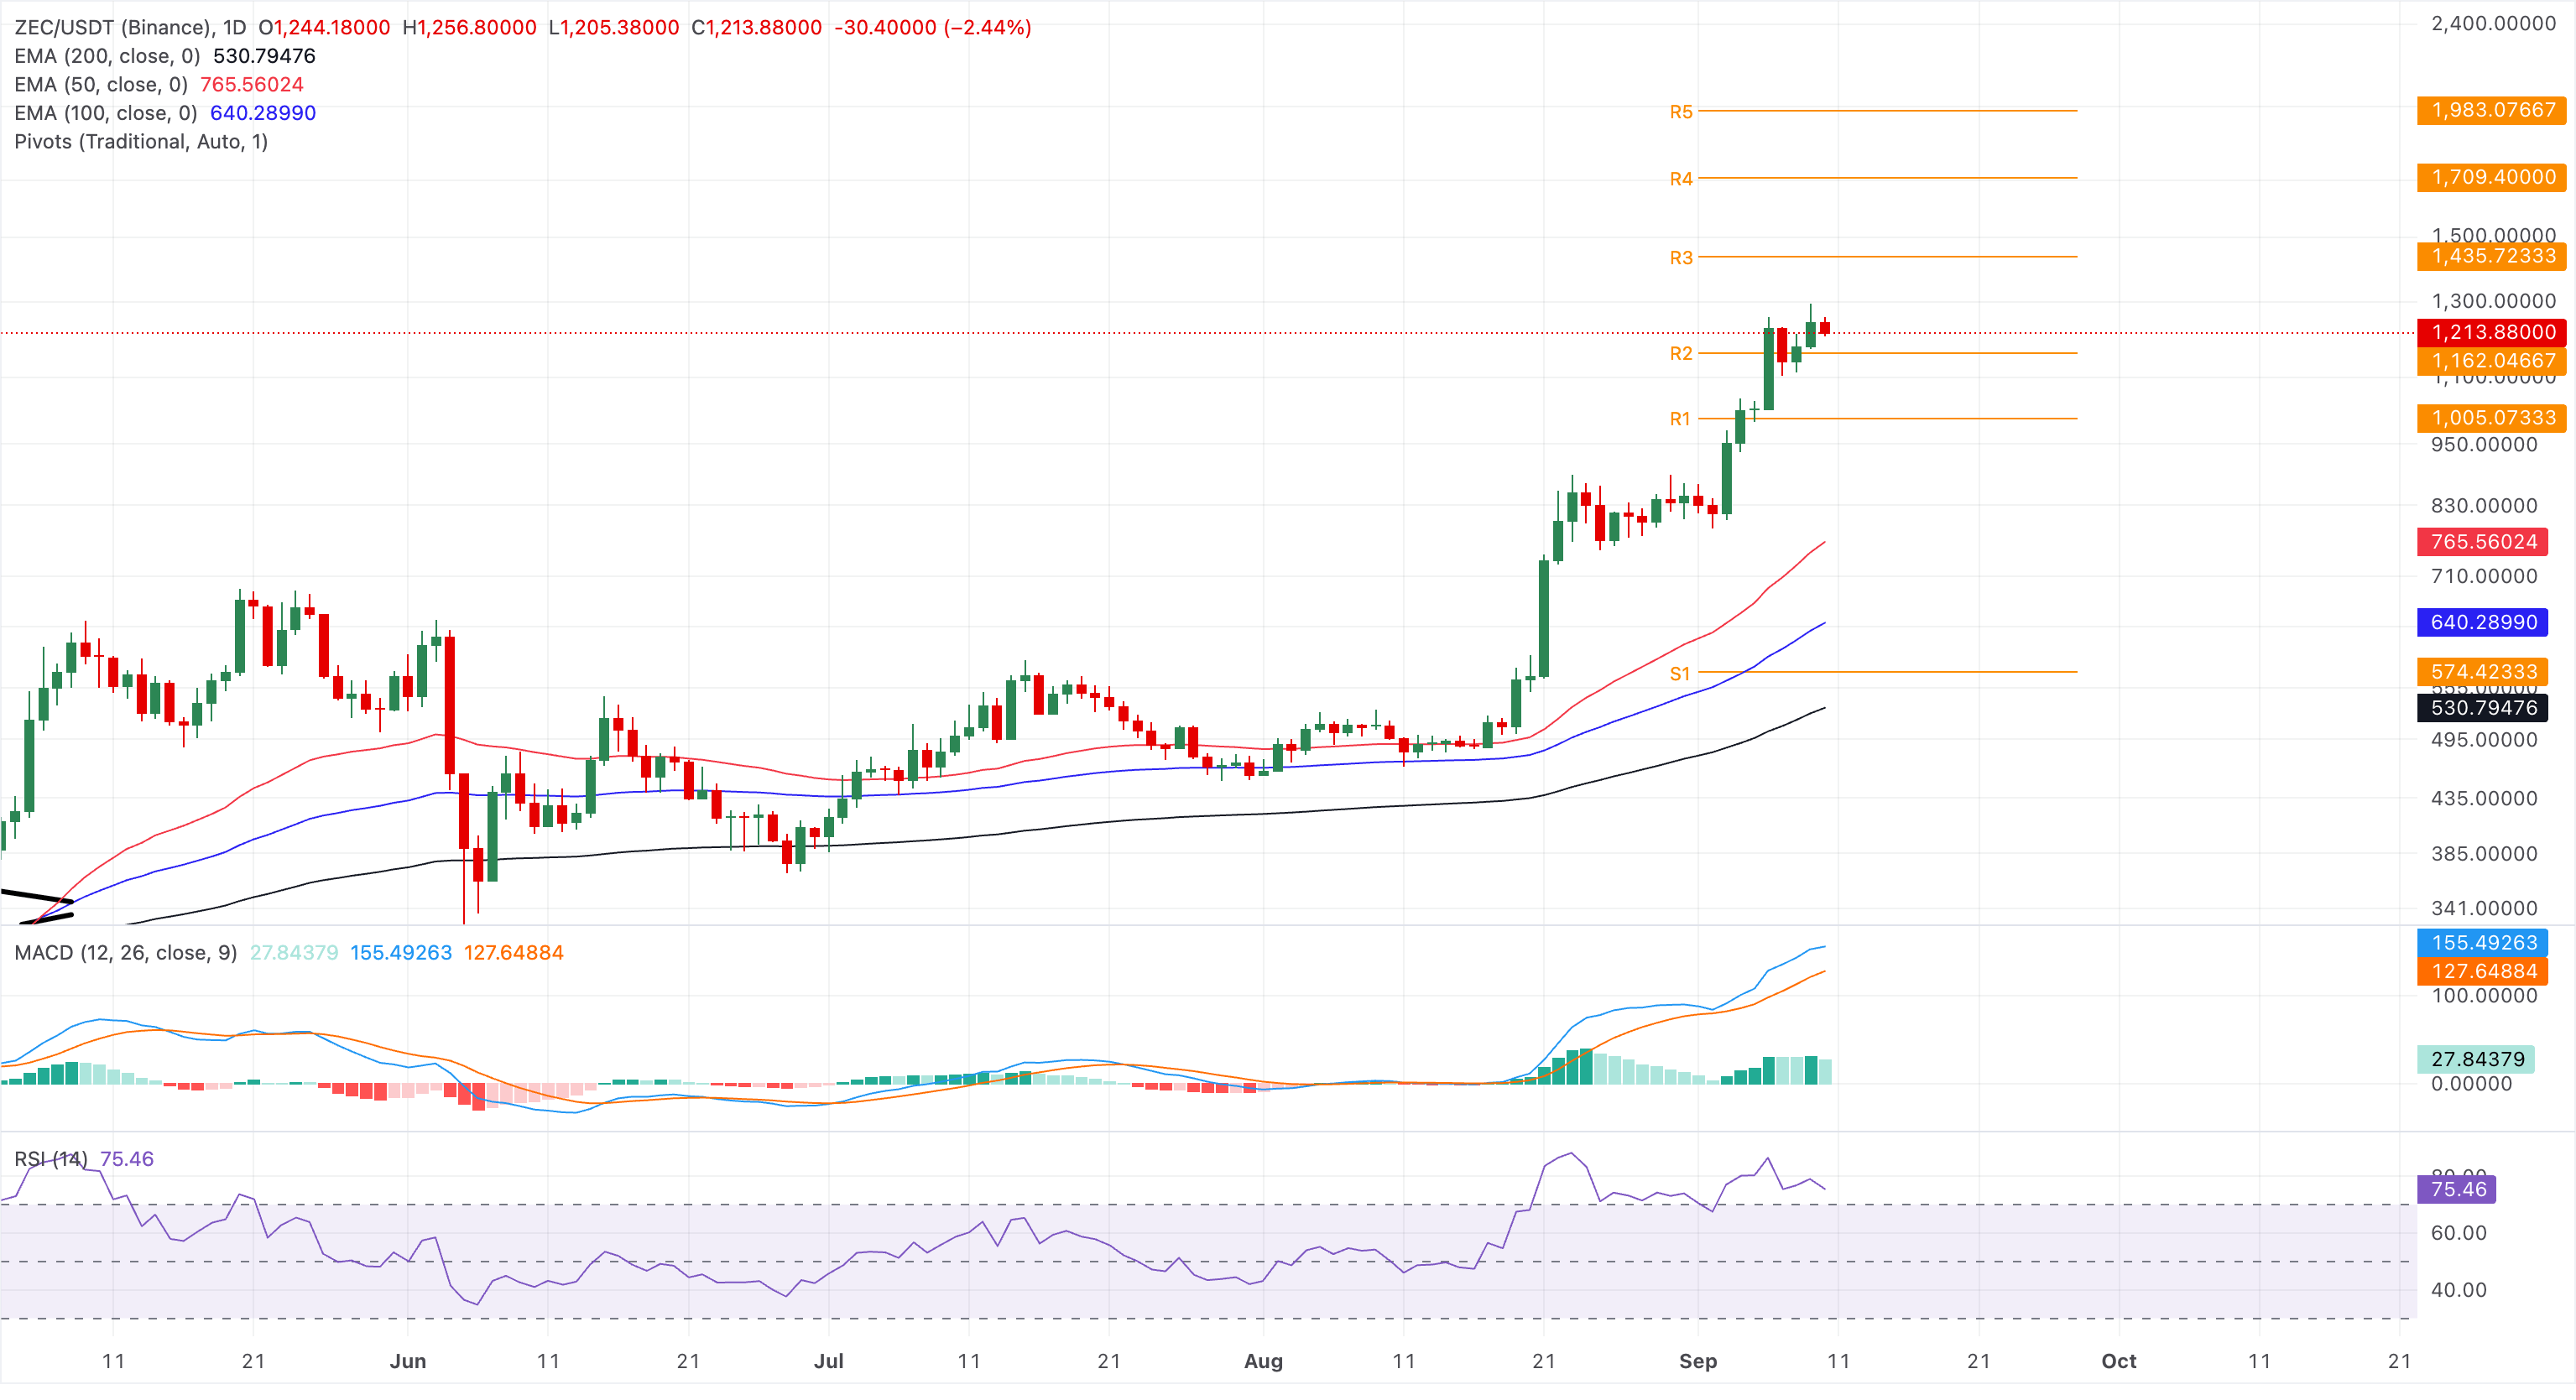
On the upside, the R3 and R4 pivot levels at $1,435 and $1,709 serve as potential bullish targets for the privacy coin.
(The technical analysis of this story was written with the help of an AI tool. Know more.)
Recommended Articles


