



Dogecoin Price Forecast: DOGE in survival mode returns to key support level

Source Fxstreet
  • Dogecoin drops below $0.0900 on Thursday under pressure from the descending 50-day EMA.
  • Derivatives data shows a sell-side dominance as funding rates flip negative.
  • Dogecoin must close below the $0.0879 support level to confirm further downside movement.

Dogecoin (DOGE) trades in the red at press time on Thursday, below the $0.0900 level, mounting pressure on the crucial support level of $0.0879. The meme coin is losing retail support under the weight of Donald Trump’s projection that the Iran war could last until late April, which sent oil prices back above $100. Technically, DOGE is at risk of breaking below its crucial support as selling pressure persists.

Dogecoin is losing demand

Dogecoin derivatives reflect bearish sentiment among traders, anticipating downside for the meme coin. CoinGlass data shows the DOGE futures Open Interest (OI) stands at $1.05 billion, down 0.81% in the last 24 hours, indicating a reduced notional value of open positions. This risk-off behavior aligns with the $4.55 million in liquidations in the same period, led by $3.48 million in long liquidations, reaffirming intense sell-side dominance.

The long-to-short ratio of active DOGE positions is at 0.967, suggesting a greater number of active short positions. Additionally, a sharp drop in the funding rate to -0.0097% confirms the bearish sentiment among traders, as they are willing to hold short positions at a premium.
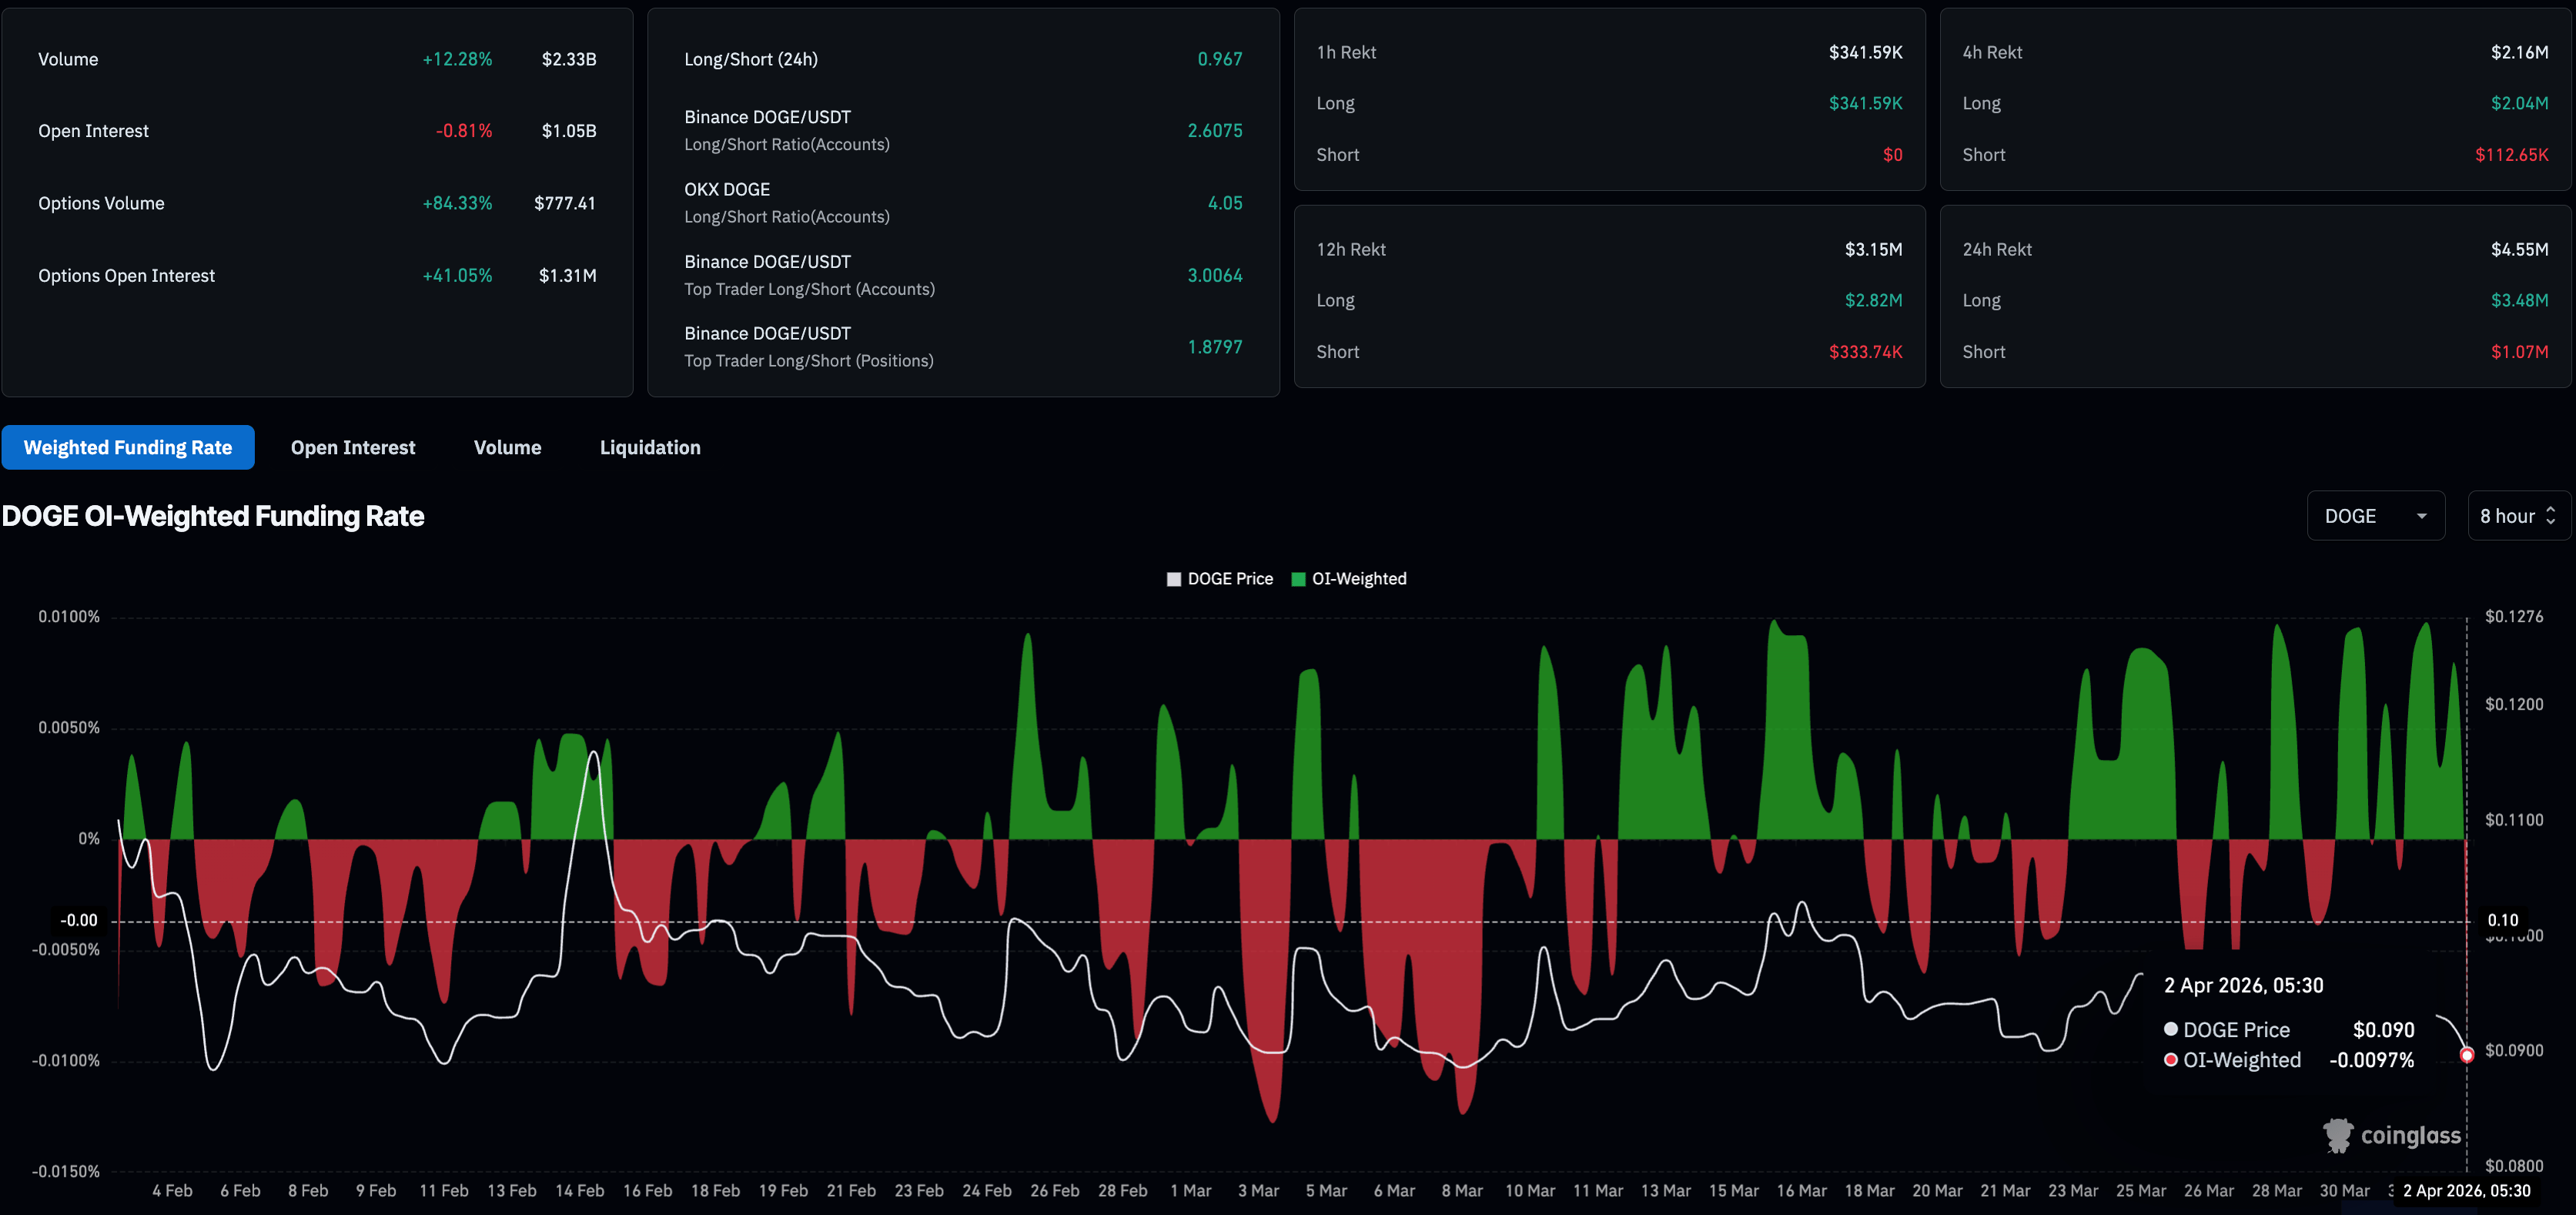
DOGE derivatives data. Source: CoinGlass

Technical outlook: Is Dogecoin preparing for the next leg down?

Dogecoin is down over 2% at press time on Thursday, maintaining a steady decline under the influence of the descending 50-day Exponential Moving Average (EMA). The 50-, 100-, and 200-day EMAs maintain a broader bearish tone.

The Moving Average Convergence Divergence (MACD) line has slipped marginally below its signal line around the zero area, and the flattening histogram suggests weak downside momentum rather than an impulsive selloff. The Relative Strength Index (RSI) near 43 remains below the midline, reinforcing a mild bearish bias while avoiding oversold territory and leaving scope for a two-way trade.

DOGE shows buoyancy above the $0.0879 support level marked by the February 11 low. However, a daily close below this level could threaten the February 6 low at $0.0800, and if this level is breached, the meme coin could revisit the January 8, 2024, low at $0.0741.

Chart Analysis DOGE/USDT (Binance)
DOGE/USDT daily price chart.

Looking up, the 50- and 100-day EMAs at $0.0974 and $0.1107, respectively, serve as overhead resistances.

(The technical analysis of this story was written with the help of an AI tool.)

Disclaimer: For information purposes only. Past performance is not indicative of future results.
placeholder
Apple Stock Price Prediction: Can July Earnings Push AAPL Past $5 Trillion?Apple stock (AAPL) is within roughly 4% of a $5 Trillion milestone after a rapid rally. The next earnings report will test whether fundamentals can support the move.Apple shares currently remain 9.8%
Author  Beincrypto
Jul 21, Tue
Apple stock (AAPL) is within roughly 4% of a $5 Trillion milestone after a rapid rally. The next earnings report will test whether fundamentals can support the move.Apple shares currently remain 9.8%
placeholder
Intel Stock Jumps 9% on Chip Price Hike Report, US Stake Gains $36 BillionIntel stock (INTC) climbed as much as 9.5% on Tuesday following a supply chain report that said the company will raise personal computer processor prices by roughly 10% in early October.The move lifte
Author  Beincrypto
Sept 09, Wed
Intel stock (INTC) climbed as much as 9.5% on Tuesday following a supply chain report that said the company will raise personal computer processor prices by roughly 10% in early October.The move lifte
placeholder
3 Days of Losses: Dow, S&P, Nasdaq Slide as Yields, Oil RiseUS stocks fell for a third straight session on Wednesday. Rising Treasury yields and another jump in oil prices weighed on sentiment.The Dow Jones Industrial Average dropped 405.41 points, or 0.77%, t
Author  Beincrypto
22 hours ago
US stocks fell for a third straight session on Wednesday. Rising Treasury yields and another jump in oil prices weighed on sentiment.The Dow Jones Industrial Average dropped 405.41 points, or 0.77%, t
placeholder
Trump Gives Timeline for Oil Prices to Fall, Brent Pushes to May HighsPresident Donald Trump said Wednesday that oil prices will not fall until right after the November midterm elections. He tied relief at the pump to an Iran war he expects Tehran to abandon once Americ
Author  Beincrypto
22 hours ago
President Donald Trump said Wednesday that oil prices will not fall until right after the November midterm elections. He tied relief at the pump to an Iran war he expects Tehran to abandon once Americ
placeholder
Bitcoin Chart Flashes Golden Cross. Is the Bear Market Finally Over?After its strongest August since 2017, Bitcoin (BTC) has faced renewed volatility in September as hawkish Fed signals and strong jobs data pressure risk assets.Yet, the daily chart has flashed a key b
Author  Beincrypto
22 hours ago
After its strongest August since 2017, Bitcoin (BTC) has faced renewed volatility in September as hawkish Fed signals and strong jobs data pressure risk assets.Yet, the daily chart has flashed a key b
Related Instrument
goTop
quote