


Was the XRP Price Bounce Exit Liquidity as Holders Dumped 90% of Their Stash?
The XRP price rebounded more than 30% after bouncing from its early February low near $1.12. The move revived hopes of a recovery and briefly pushed the token toward the $1.50 zone. On the surface, the rally looked constructive. Momentum indicators improved. A breakout pattern began to form. Traders started discussing a possible trend reversal.
But blockchain data tells a different story. Instead of showing strong accumulation, on-chain metrics suggest that many holders used the rebound to exit losing positions. Selling at a loss remains dominant. Several groups are still reducing exposure. This raises a key question: was the bounce genuine demand, or simply exit liquidity for trapped sellers?
Technical Setup Shows Bounce Potential, But It Needs Confirmation
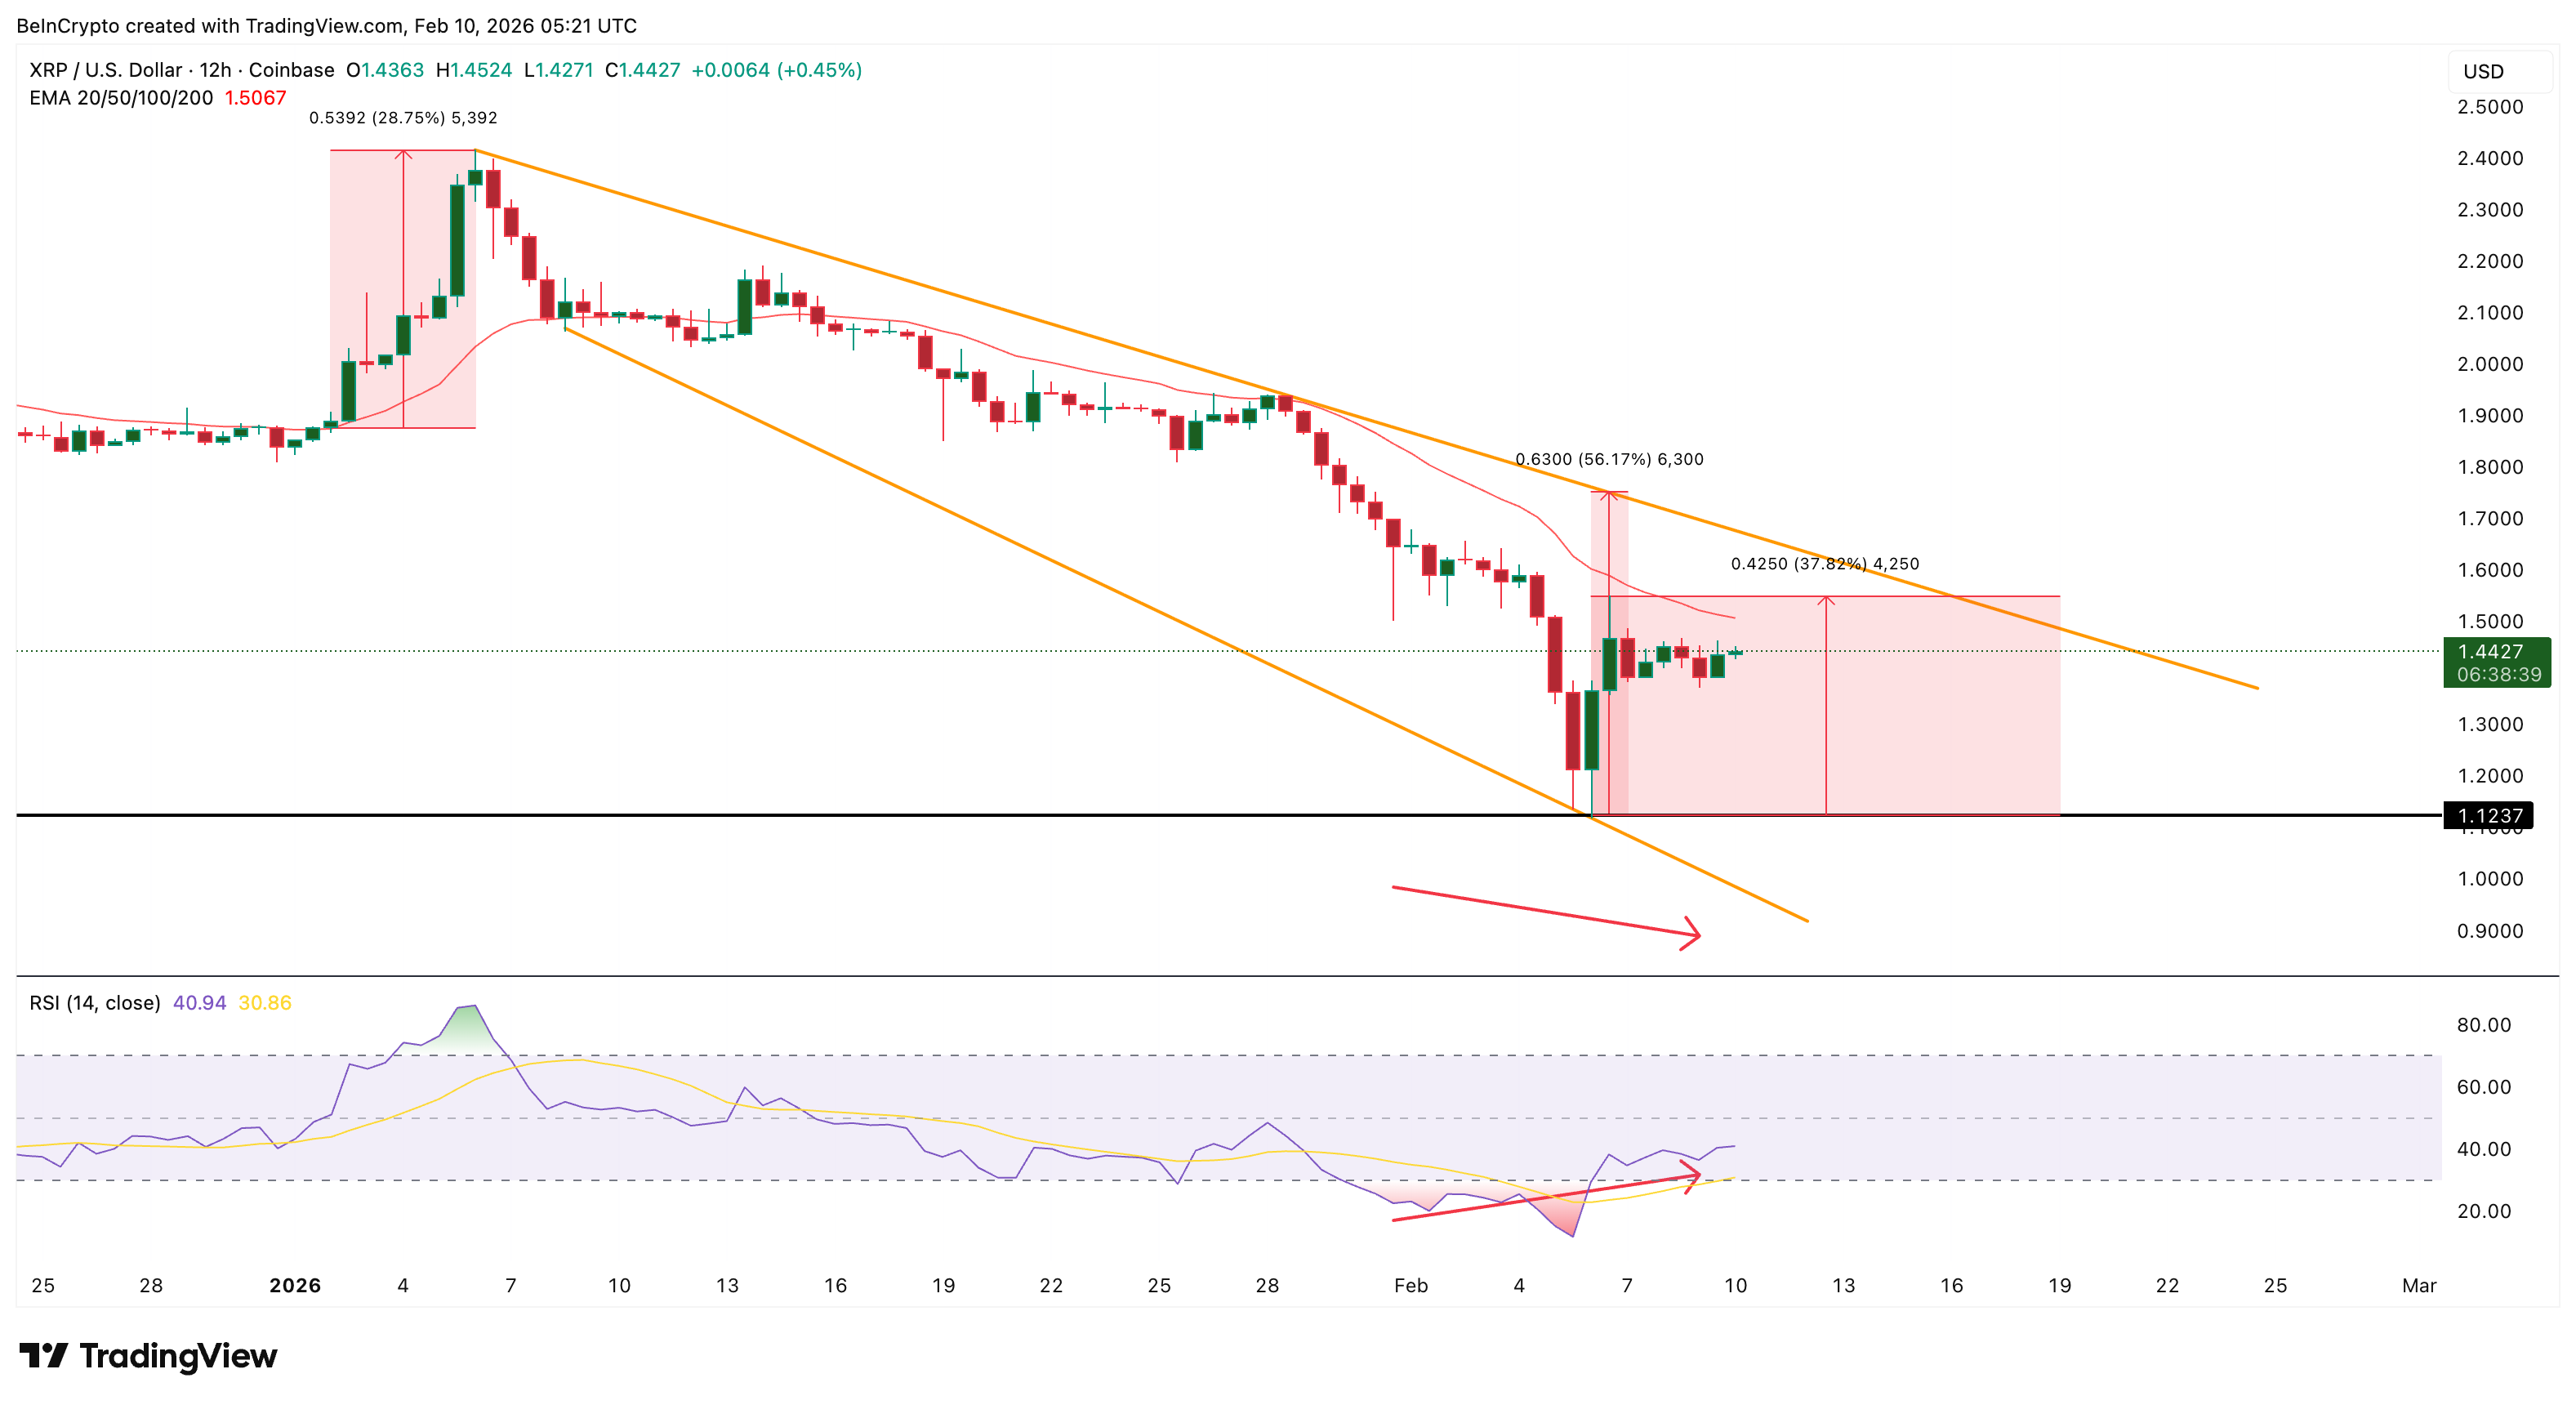
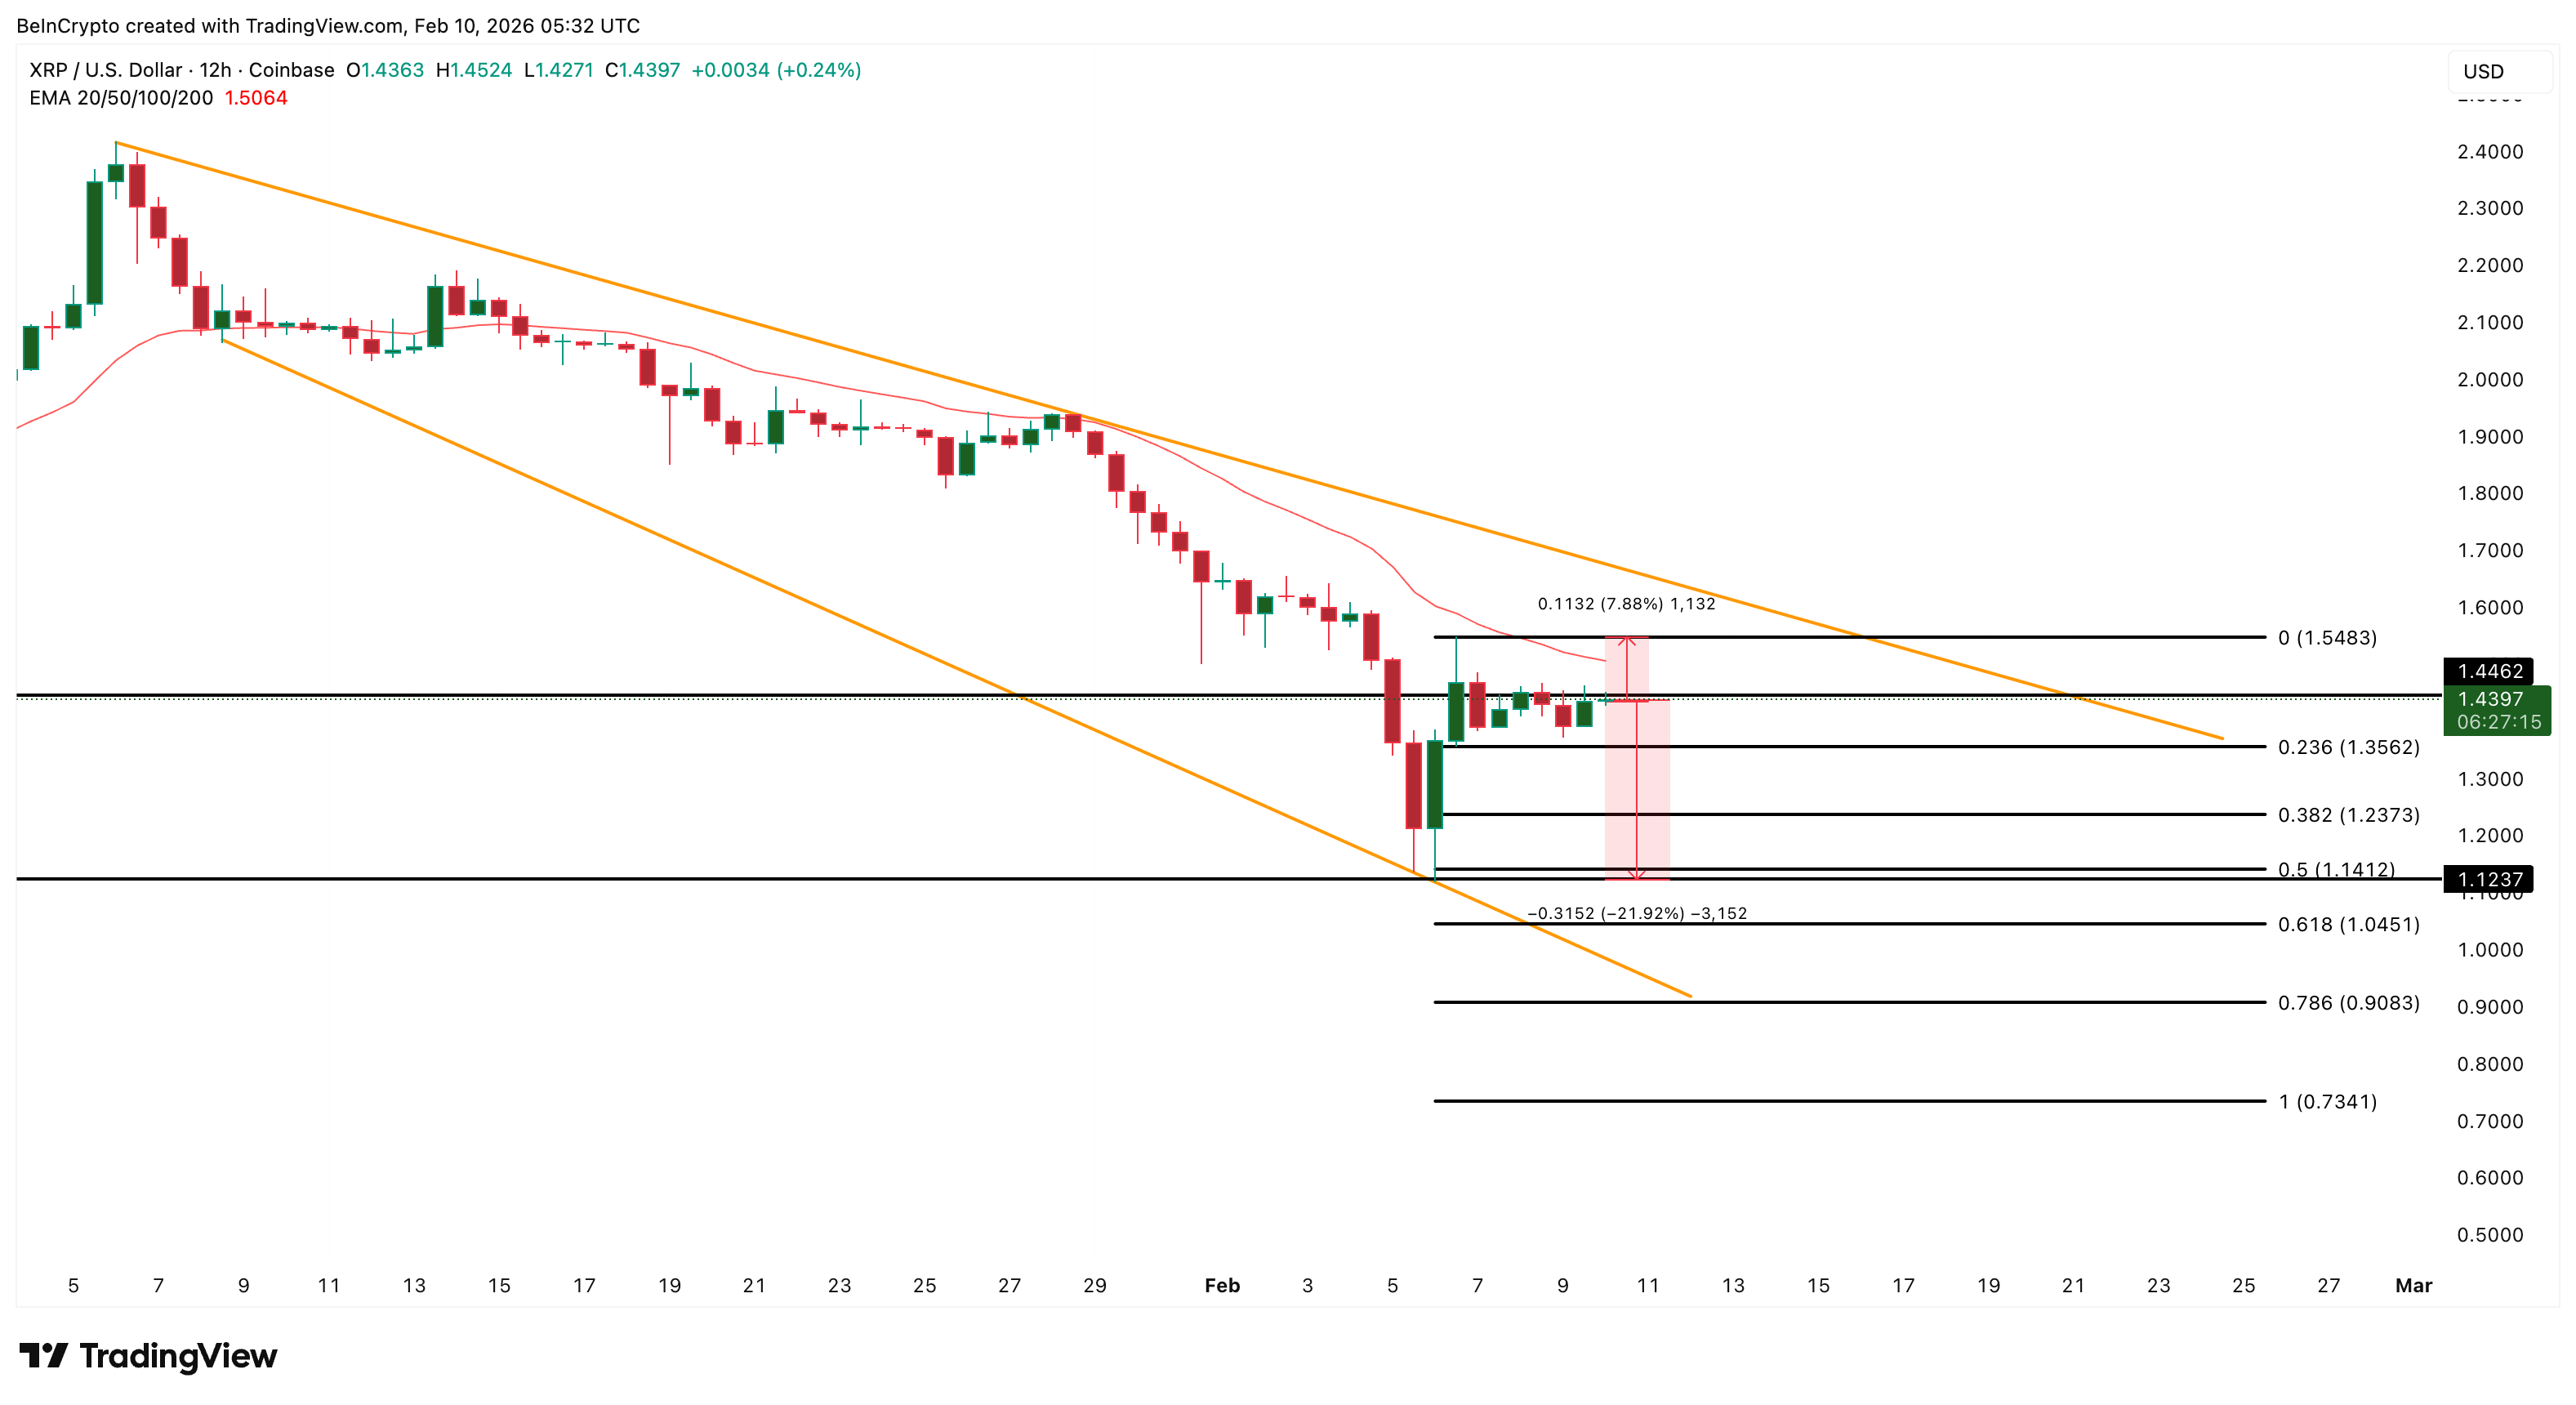
On the 12-hour chart, XRP is trading inside a falling wedge pattern, with a 56% breakout potential above the upper trendline.
For this pattern to activate, XRP needs to first reclaim its short-term moving average, the 20-period exponential moving average (EMA), which gives more weight to recent prices. This level acts as dynamic resistance in downtrends. In early January, a clean break above this EMA triggered a rally of nearly 30%.
Momentum is also showing early improvement.
Between January 31 and February 9, XRP printed a lower low in price. At the same time, the Relative Strength Index (RSI), a momentum indicator that measures buying and selling pressure, formed a higher low. This bullish divergence suggests that sellers are losing strength.
 XRP Price Structure: TradingView
Want more token insights like this? Sign up for Editor Harsh Notariya’s Daily Crypto Newsletter here.
On its own, this setup points to a possible bounce.
But technical patterns only work when holders are willing to stay invested. To understand whether this bounce has real support, we need to look at how investors are behaving on-chain.
SOPR Shows Holders Are Still Selling at Losses Despite the Bounce
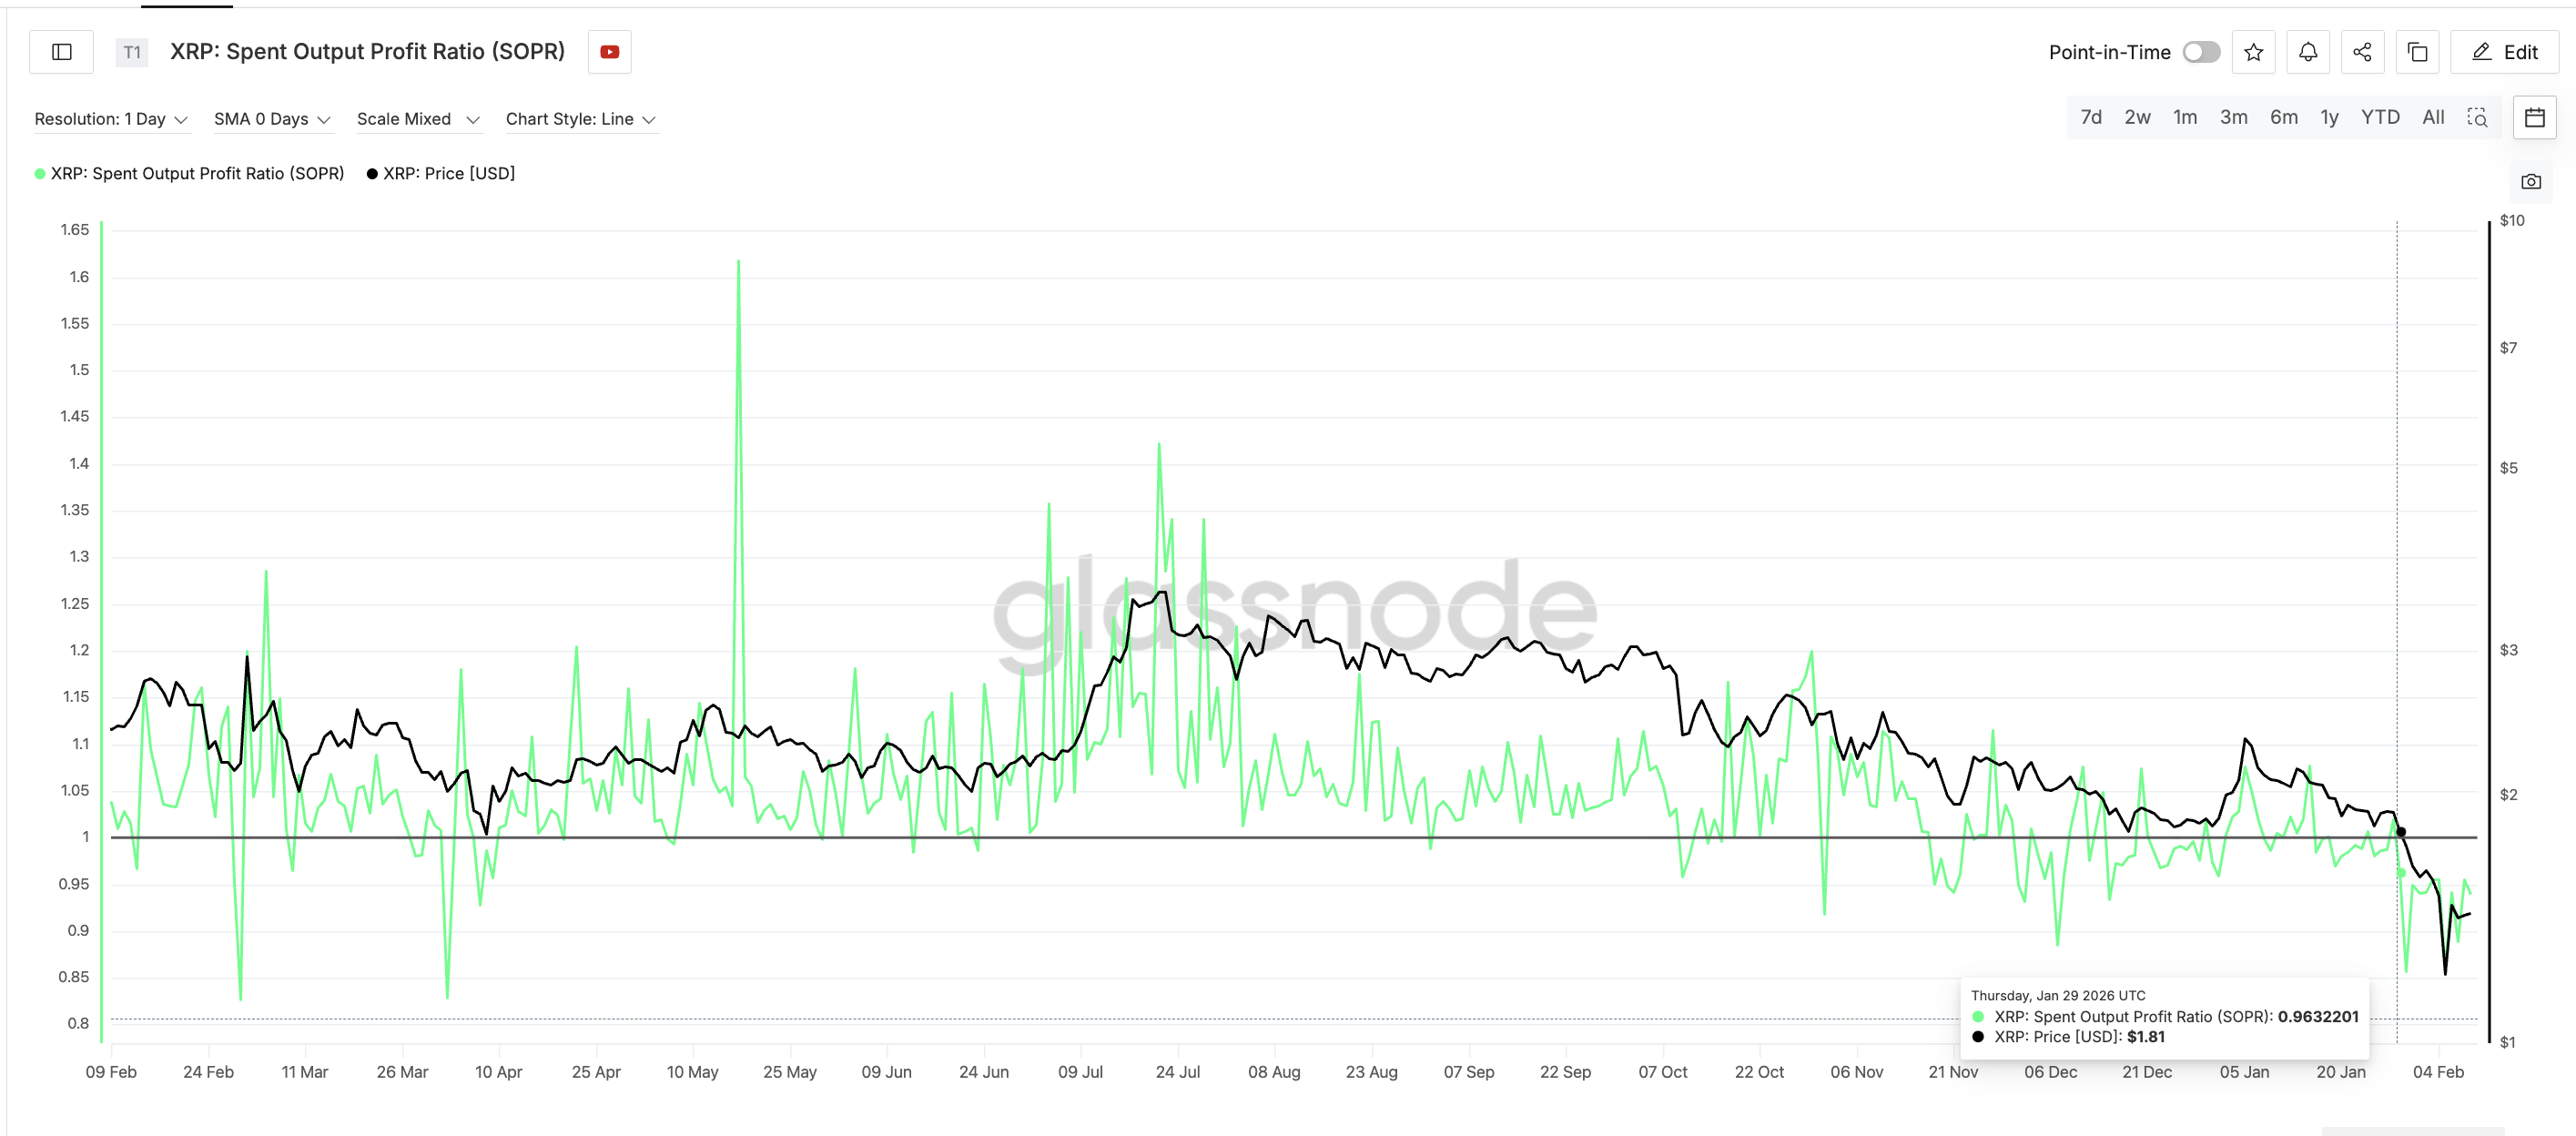
One of the clearest warning signals comes from the Spent Output Profit Ratio, or SOPR. SOPR measures whether coins being moved on-chain are sold in profit or at a loss. When it stays above 1, it shows profit-taking. When it remains below 1, it shows loss-selling.
Since late January, XRP’s SOPR has remained below 1 for more than ten consecutive days.
 SOPR Under 1: Glassnode
This is unusual. After a 30%+ rebound, short-term traders are normally sitting in profit. That usually pushes SOPR higher. But in XRP’s case, profitability never returned. Loss selling continued even as the price recovered. This means many holders are still exiting underwater positions.
In simple terms, the market is not seeing confident profit-taking. It is seeing stress-driven exits. To understand who is responsible, we need to look at holder cohorts.
Holder Data Confirms the XRP Bounce Is Being Used to Exit, Not Accumulate
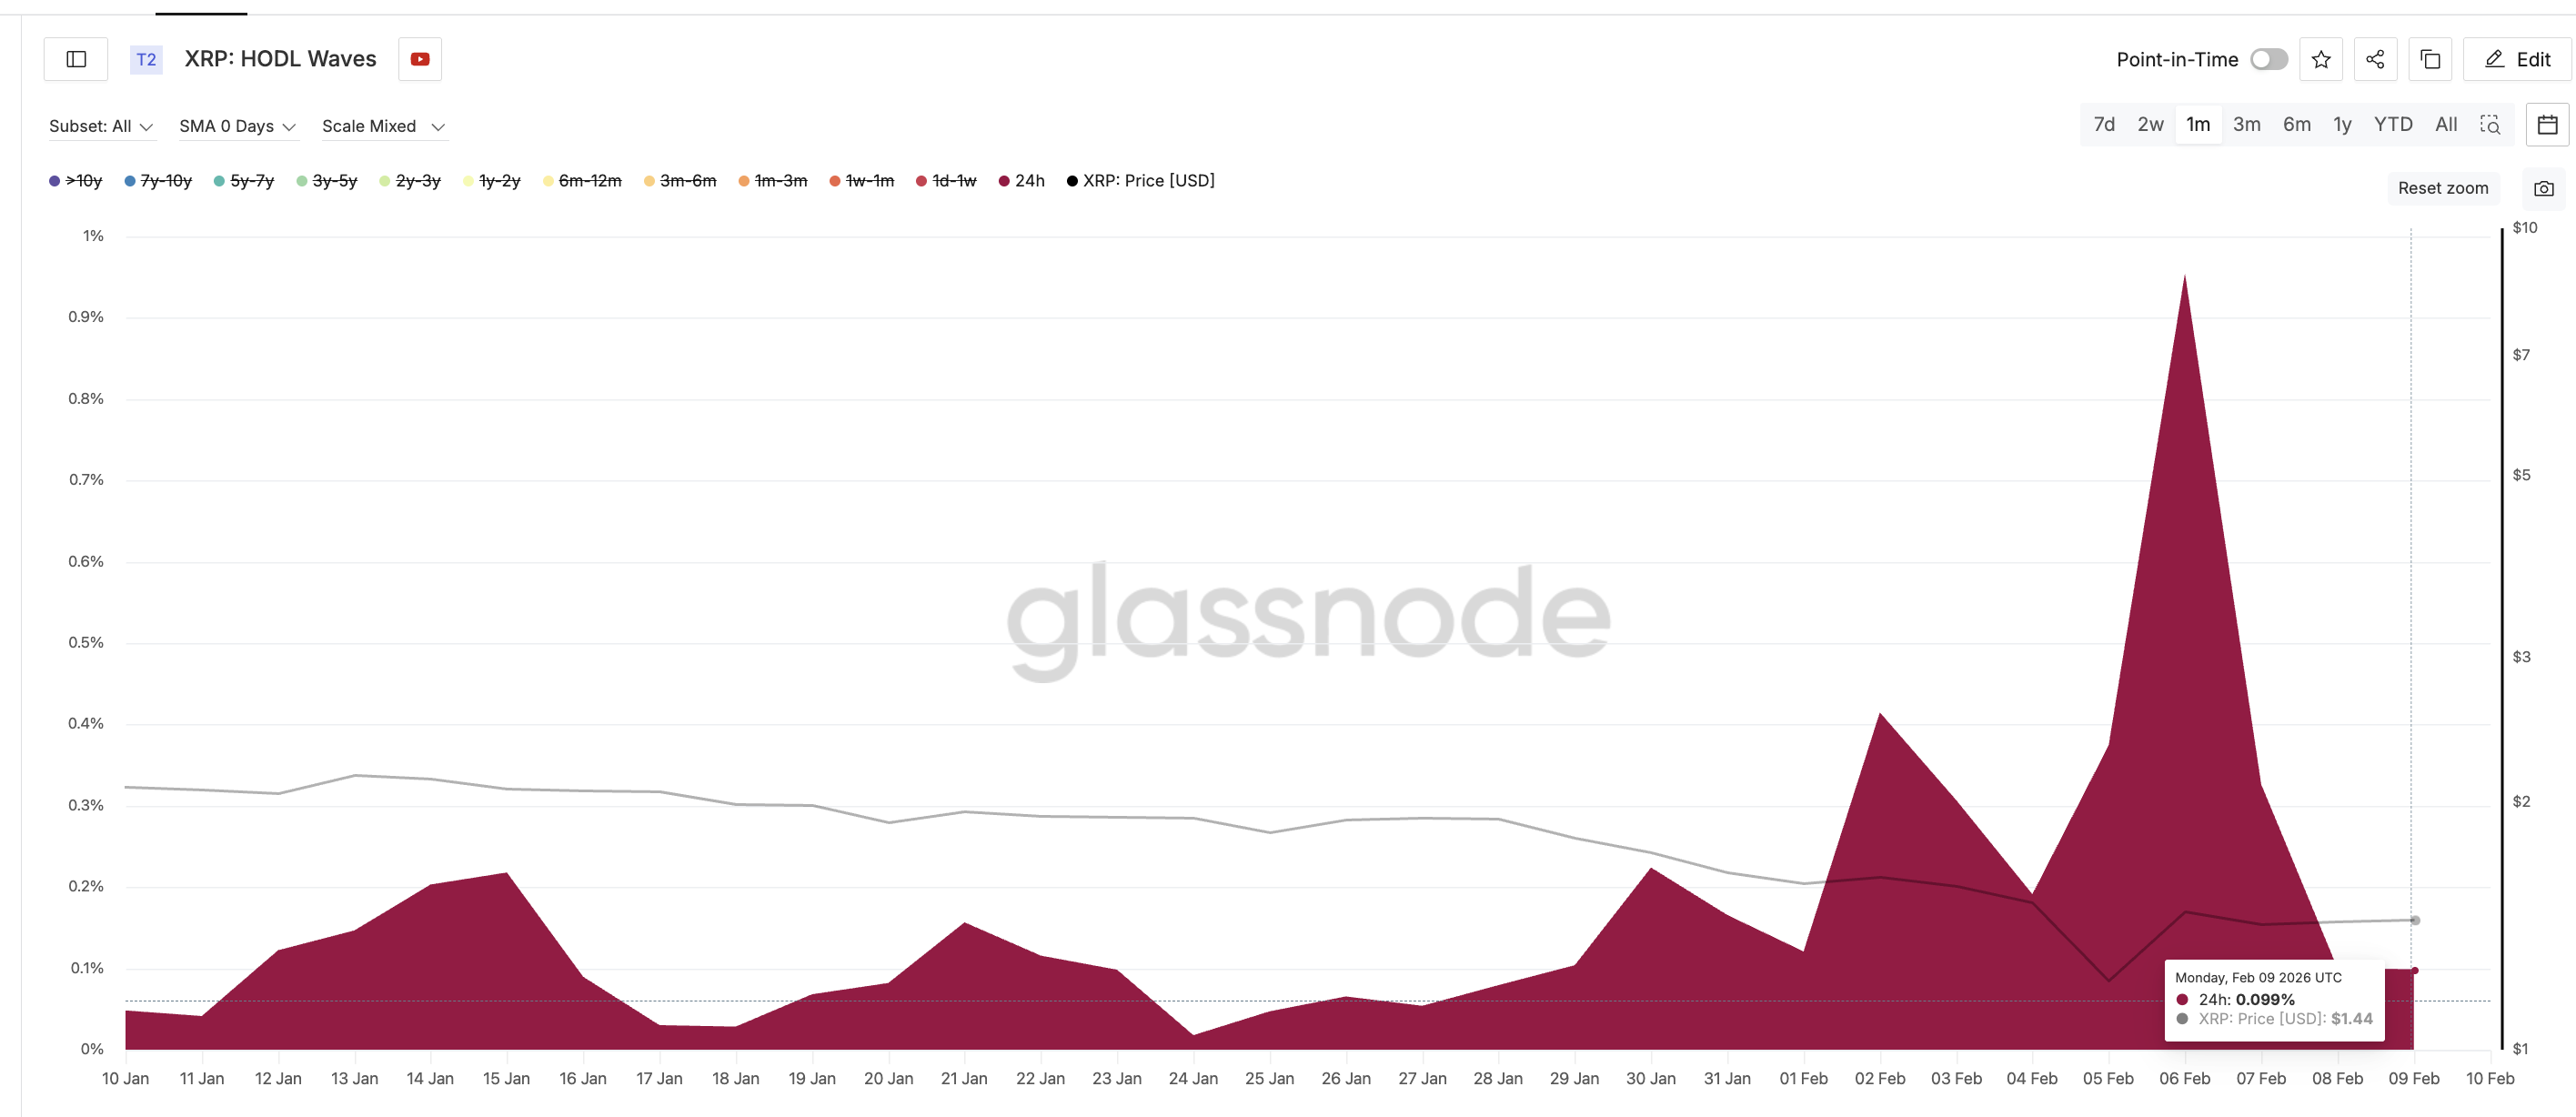
HODL Waves group XRP wallets based on how long they have held their coins. This helps identify which investor groups are buying or selling.
The most striking shift appeared in the 24-hour holder cohort.
On February 6, this group controlled about 1% of XRP’s circulating supply. Within days, that share collapsed to roughly 0.09%. That represents a decline of more than 90%.
 Speculative Holders Bought The Top?: Glassnode
These were highly reactive traders who entered during volatility and rushed to exit during the rebound.
Selling was not limited to this group.
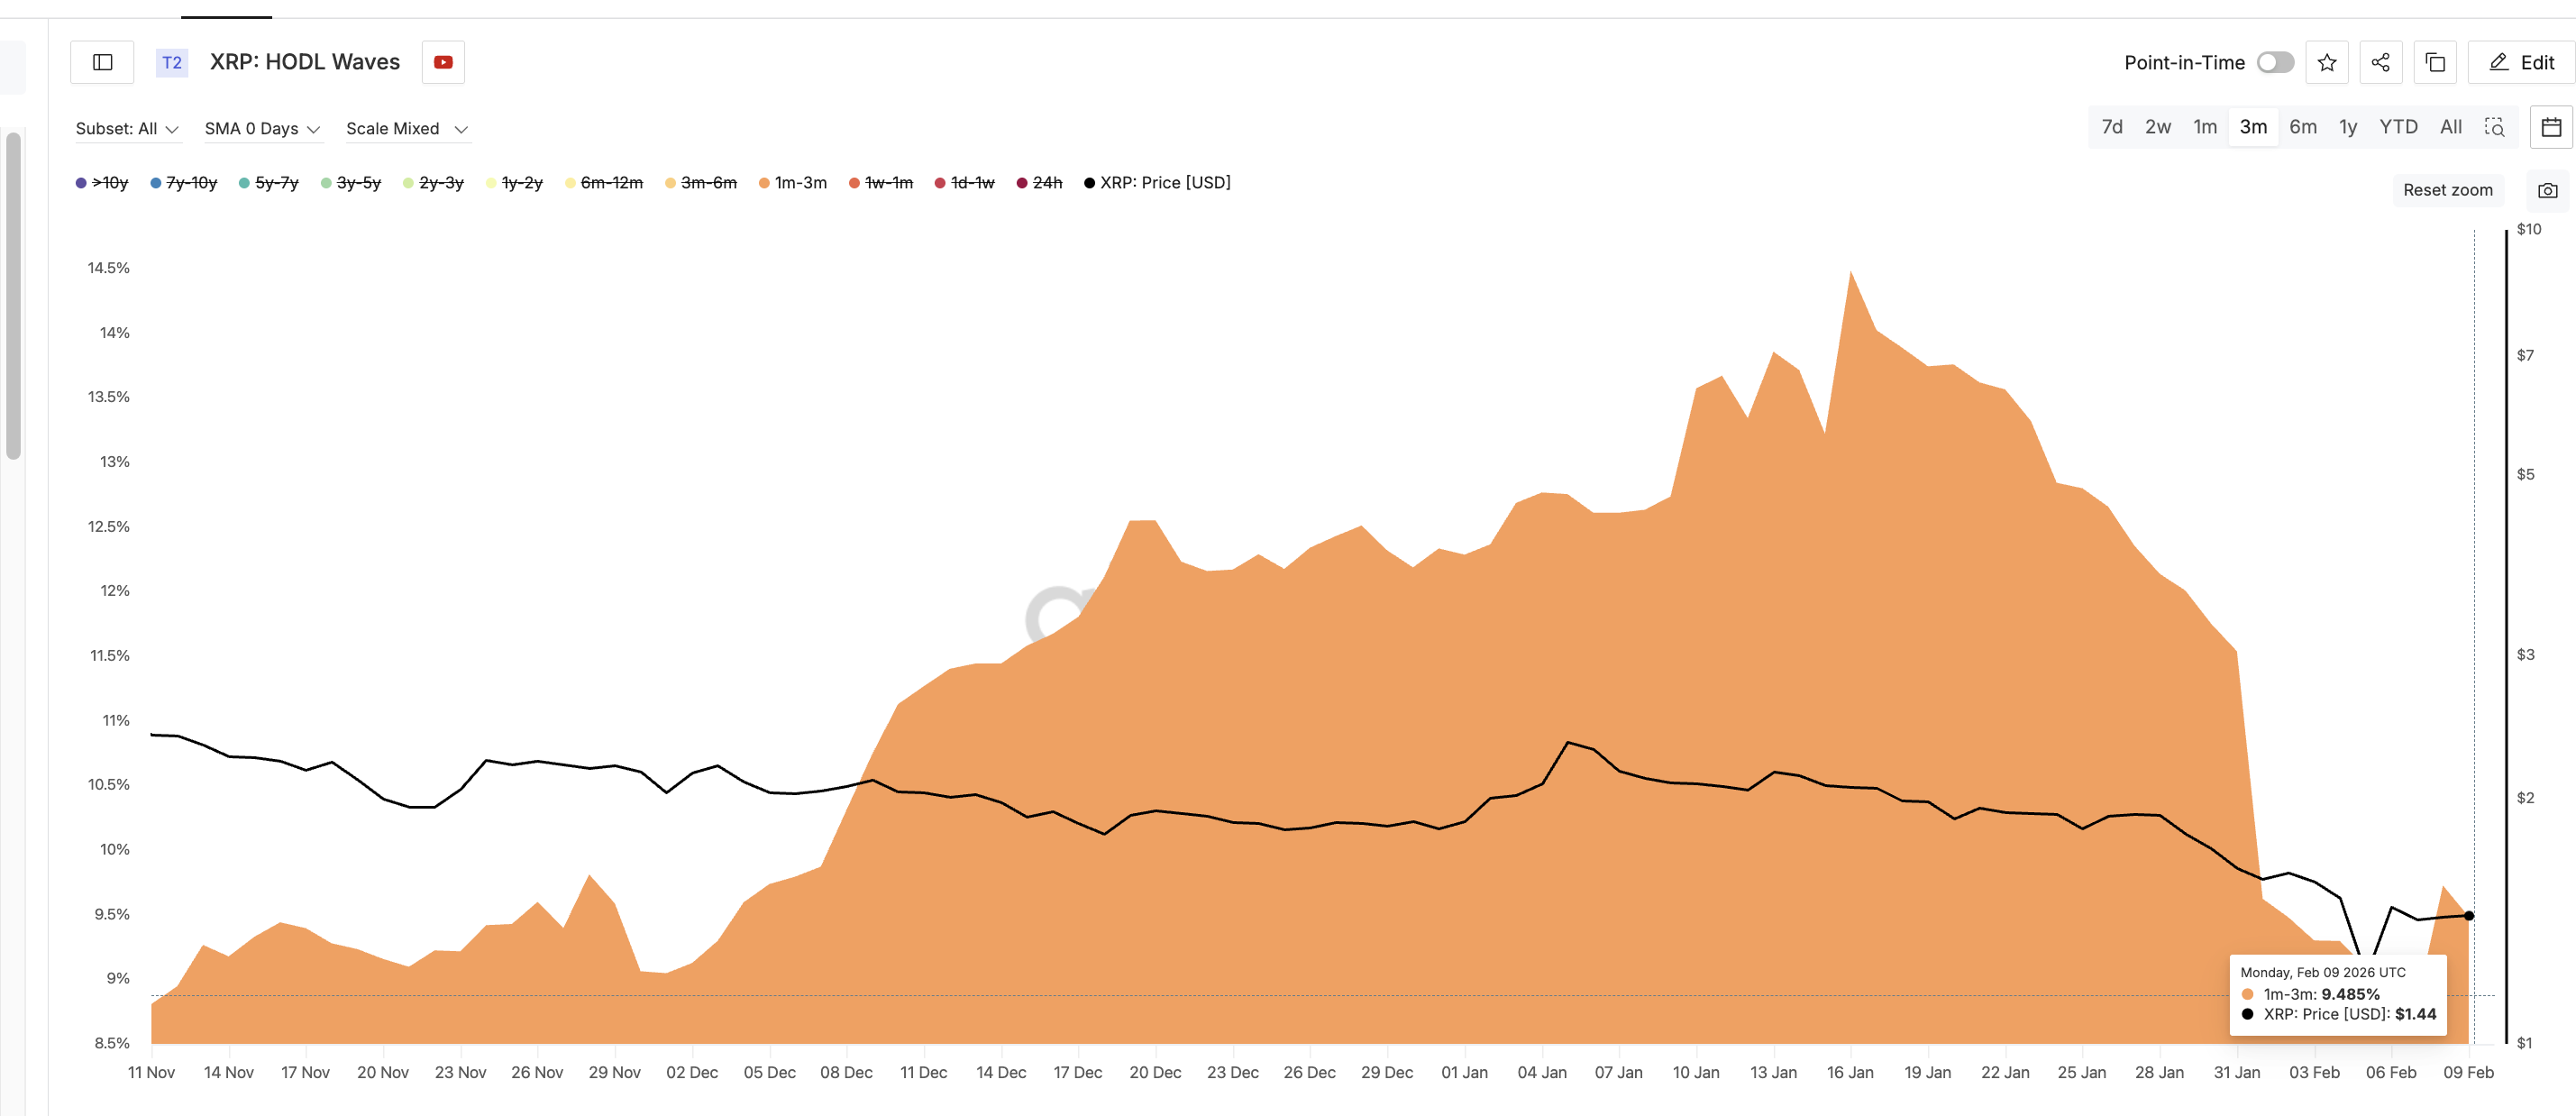
The 1-month to 3-month cohort, which accumulated heavily in January when XRP traded near $2.07, has also been reducing exposure. Their share of supply fell from around 14.48% in mid-January to about 9.48% recently. That is a decline of roughly 35%.
 Mid-Term XRP Holders Selling: Glassnode
These holders remain underwater. Instead of waiting for a full recovery, they are using rallies to minimize losses. Together, these two cohorts explain why SOPR has remained depressed for a long time now.
Short-term traders are exiting failed trades. Medium-term holders are cutting losing positions.
This behavior is typical of distribution phases, not early bull markets. And it directly impacts price structure.
Cost Basis Data Shows Why $1.44–$1.54 Is a Wall for the XRP Price
Cost basis heat maps show where large groups of investors bought their coins. These zones often become resistance when the price returns to them.
For XRP, the strongest near-term cluster sits between $1.42 and $1.44. More than 660 million XRP were accumulated in this range. This creates a powerful sell zone.
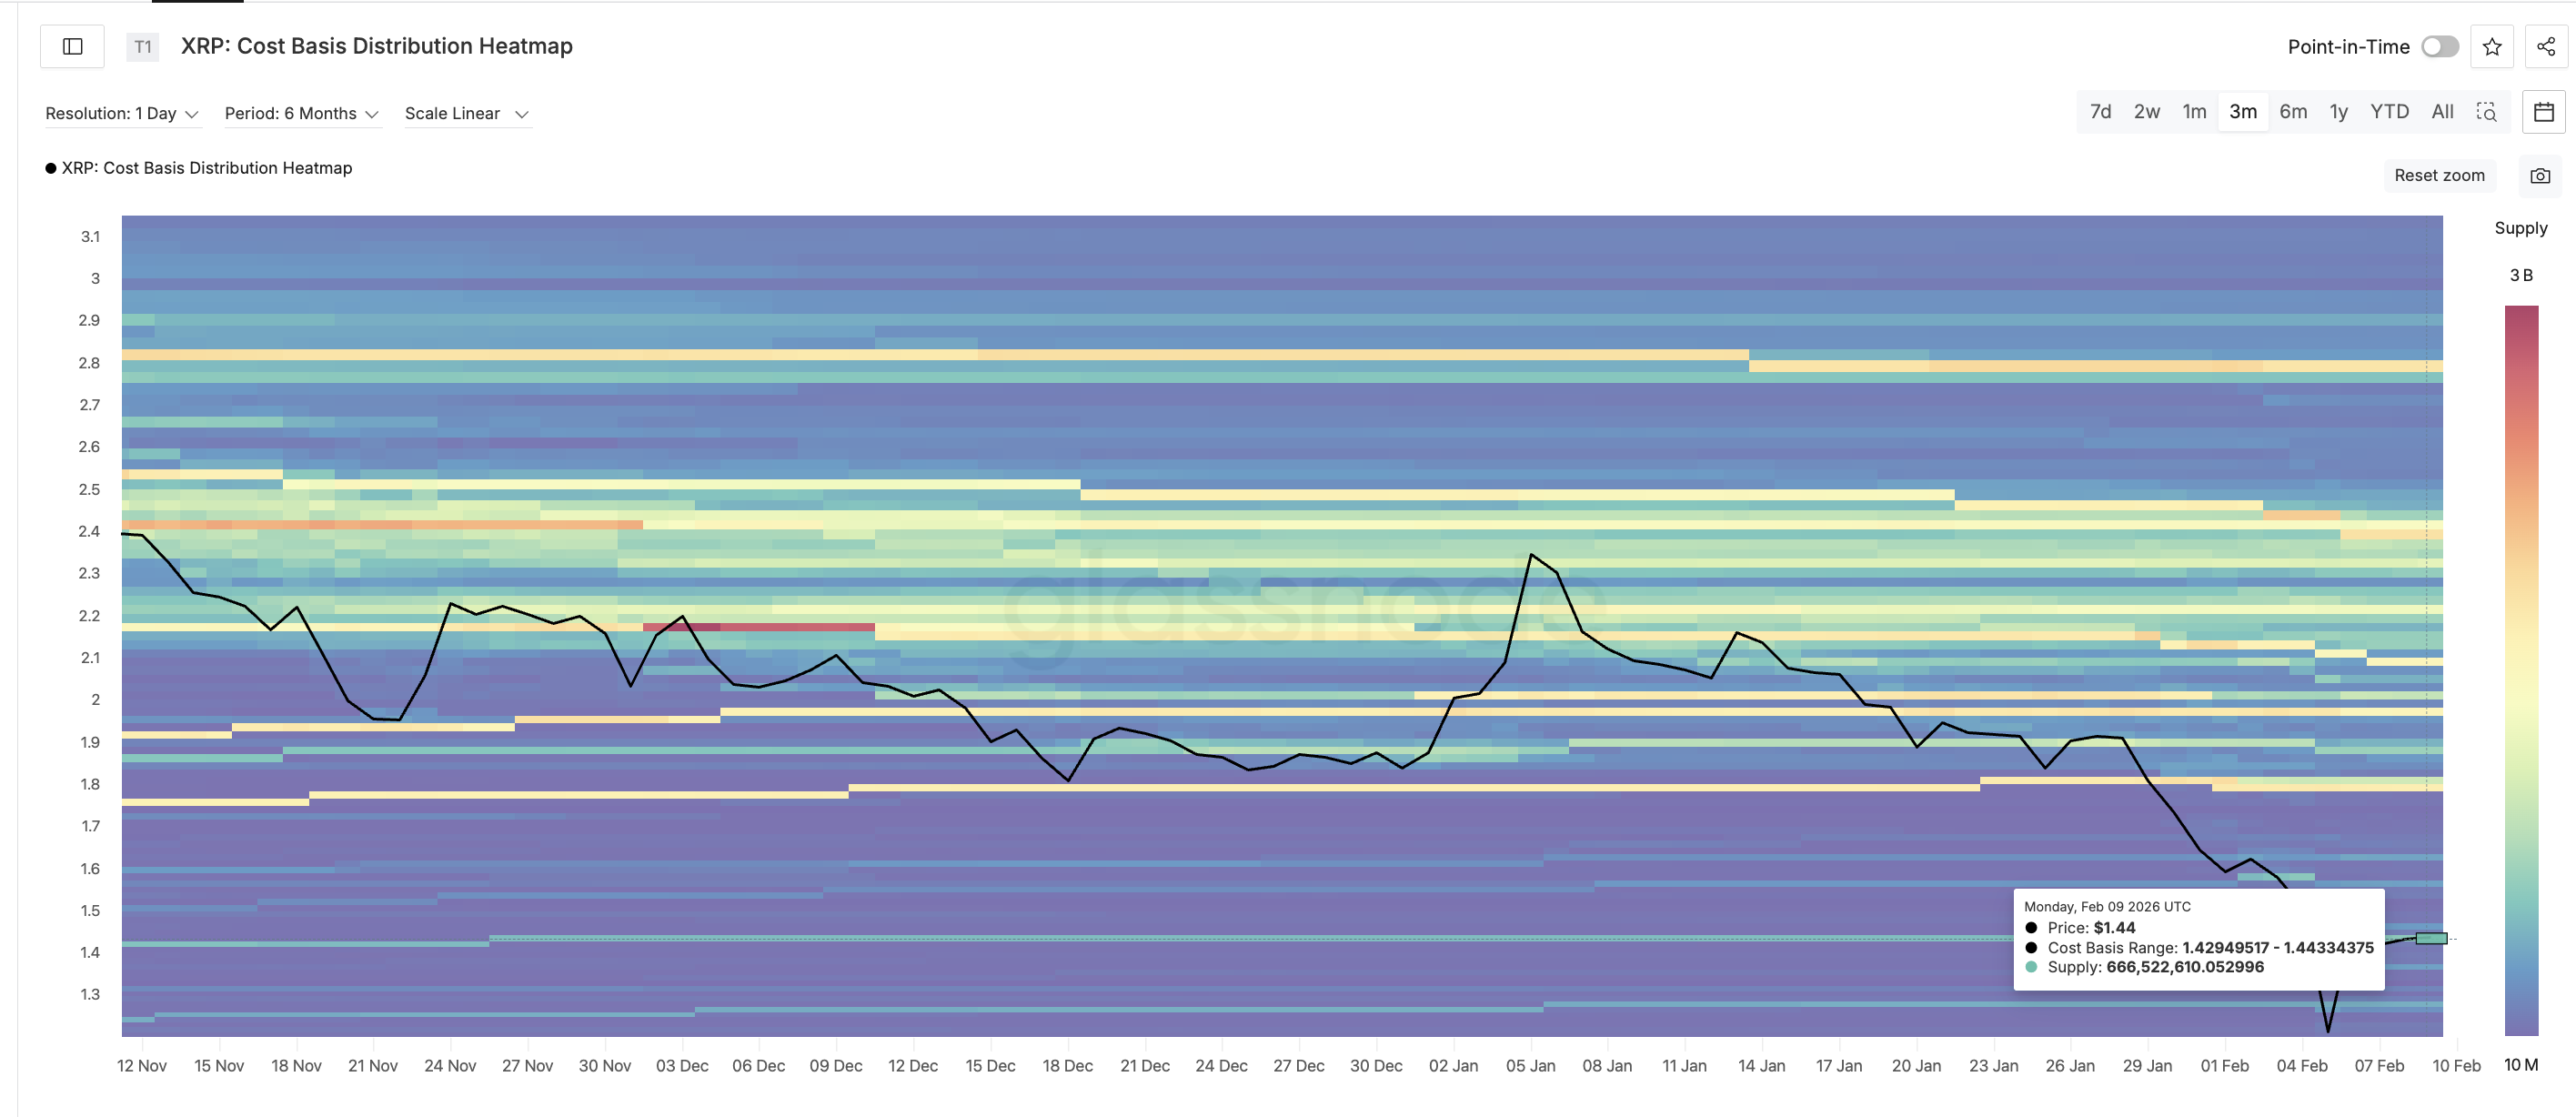 Key Sell Wall: Glassnode
When the price approaches this area, many holders reach break-even. After weeks of losses, they chose to exit.
Above this cluster lies the $1.54 level, which aligns with EMA resistance. Together, these zones form a barrier that XRP has repeatedly failed to clear. Each time the XRP price rallies into this region, selling intensifies. This is consistent with the distribution seen in SOPR and HODL Waves.
 XRP Price Analysis: TradingView
If XRP fails again near $1.44, downside risk increases. A rejection could send the price back toward $1.23 and possibly $1.12, the recent low. That would represent a decline of more than 20% from current levels.
Only a sustained break above $1.54, supported by improving profitability and reduced selling, would change this XRP price structure.
Recommended Articles


