


Bitcoin Must Break Key Supply Clusters To Regain ATH Momentum – Watch These Levels
Bitcoin has rallied more than 12% since last week’s sharp drop to the $80,000 low, offering the market a brief moment of relief after an intense period of capitulation. Despite this rebound, fear and uncertainty continue to dominate sentiment, especially following what analysts describe as the largest short-term holder capitulation in Bitcoin’s history.
This wave of realized losses—fast, aggressive, and record-breaking—has left many investors questioning whether the recent recovery is sustainable or simply a temporary bounce in a broader downtrend.
According to new data from Glassnode, the path ahead remains challenging. Analysts explain that Bitcoin must break above the major supply clusters created by top buyers earlier in the cycle if it is to regain meaningful upward momentum.
These clusters represent areas where a large number of investors previously bought at higher prices and may now look to exit at breakeven, increasing the likelihood of heavy sell-side pressure as BTC climbs.
Bitcoin Faces Critical Supply Barriers
Glassnode reports that Bitcoin is now approaching two major supply clusters that will play a decisive role in determining whether the recent rebound can evolve into a sustained recovery. The first cluster sits between $93,000 and $96,000, while the second—much larger and more structurally important—spans $100,000 to $108,000.
These zones were formed by heavy buying activity earlier in the cycle and represent areas where many investors are currently underwater or sitting near breakeven.
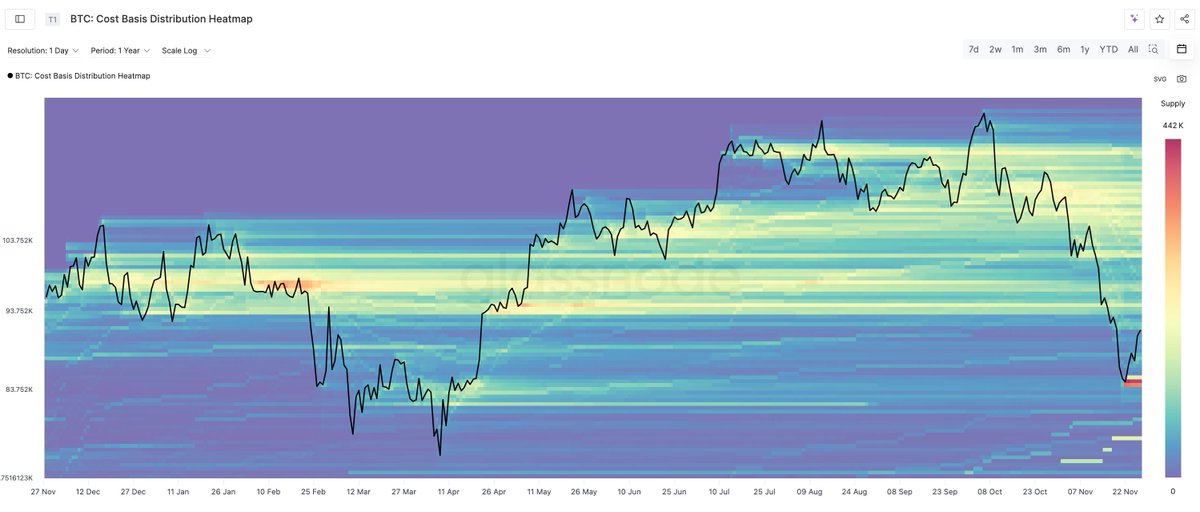
Because of this, Glassnode notes that these ranges typically act as strong resistance, as recent buyers who endured the latest drawdown may choose to sell once the price returns to their entry levels. This dynamic can create temporary supply walls, slowing down momentum even in moments of aggressive recovery.
Bitcoin’s ability to break through these clusters will determine whether it can re-establish a path toward a new all-time high or remain trapped under heavy distribution pressure. The market is now entering a critical phase, with traders closely watching how BTC behaves as it approaches these levels. A clean breakout would signal renewed confidence, while rejection could signal that the broader corrective structure is not yet over.
Testing Support After a Sharp Multi-Week Selloff
Bitcoin’s weekly chart shows a market attempting to stabilize after one of the most aggressive drawdowns of the cycle. BTC has rebounded to the $91,500 area following a deep wick to the $80K region last week, signaling that buyers are finally stepping in at key support. This rebound coincides with a strong weekly candle showing a long lower shadow, a classic sign of demand absorption during heavy selloffs.

However, despite this bounce, the broader structure remains fragile. The price is trading below the 50-week moving average, a level that previously acted as reliable support throughout the bull phase. Losing this dynamic support earlier in the month was a significant technical break, and BTC is now attempting to reclaim it from below—typically a challenging move that often acts as resistance.
The 100-week moving average around the mid-$80K region has proven critical, halting the decline and serving as the primary area where buyers defended the trend. As long as BTC holds above this zone, the broader market avoids confirming a deeper macro reversal.
Volume remains elevated, reflecting capitulation-level activity, and the market is now in a decisive phase. A sustained close above $92K–$94K would strengthen recovery prospects, while rejection would risk another retest of the $80K support.
Featured image from ChatGPT, chart from TradingView.com
Recommended Articles


