


Tron Price Forecast: TRX rebounds as DEX volume peaks, retail interest steadies
- Tron extends the bounce back from the year-long support trendline, approaching the $0.30 mark.
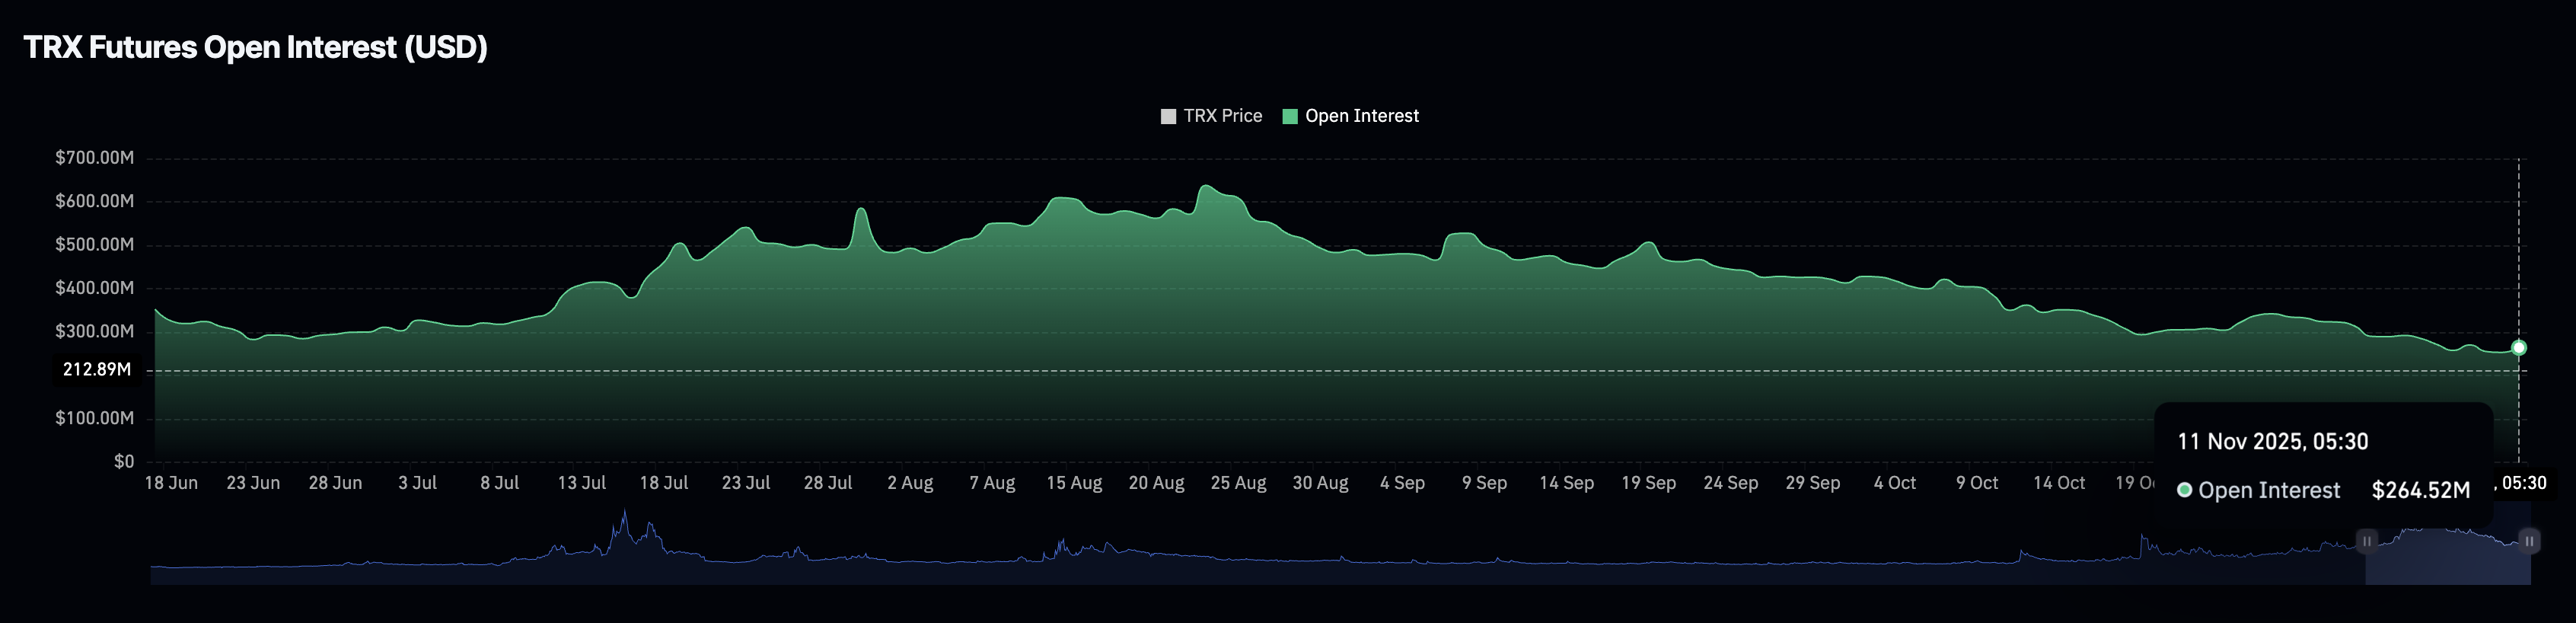
- Derivatives data suggest the decline in Open Interest is stabilizing, reflecting a potential groundwork for renewed demand.
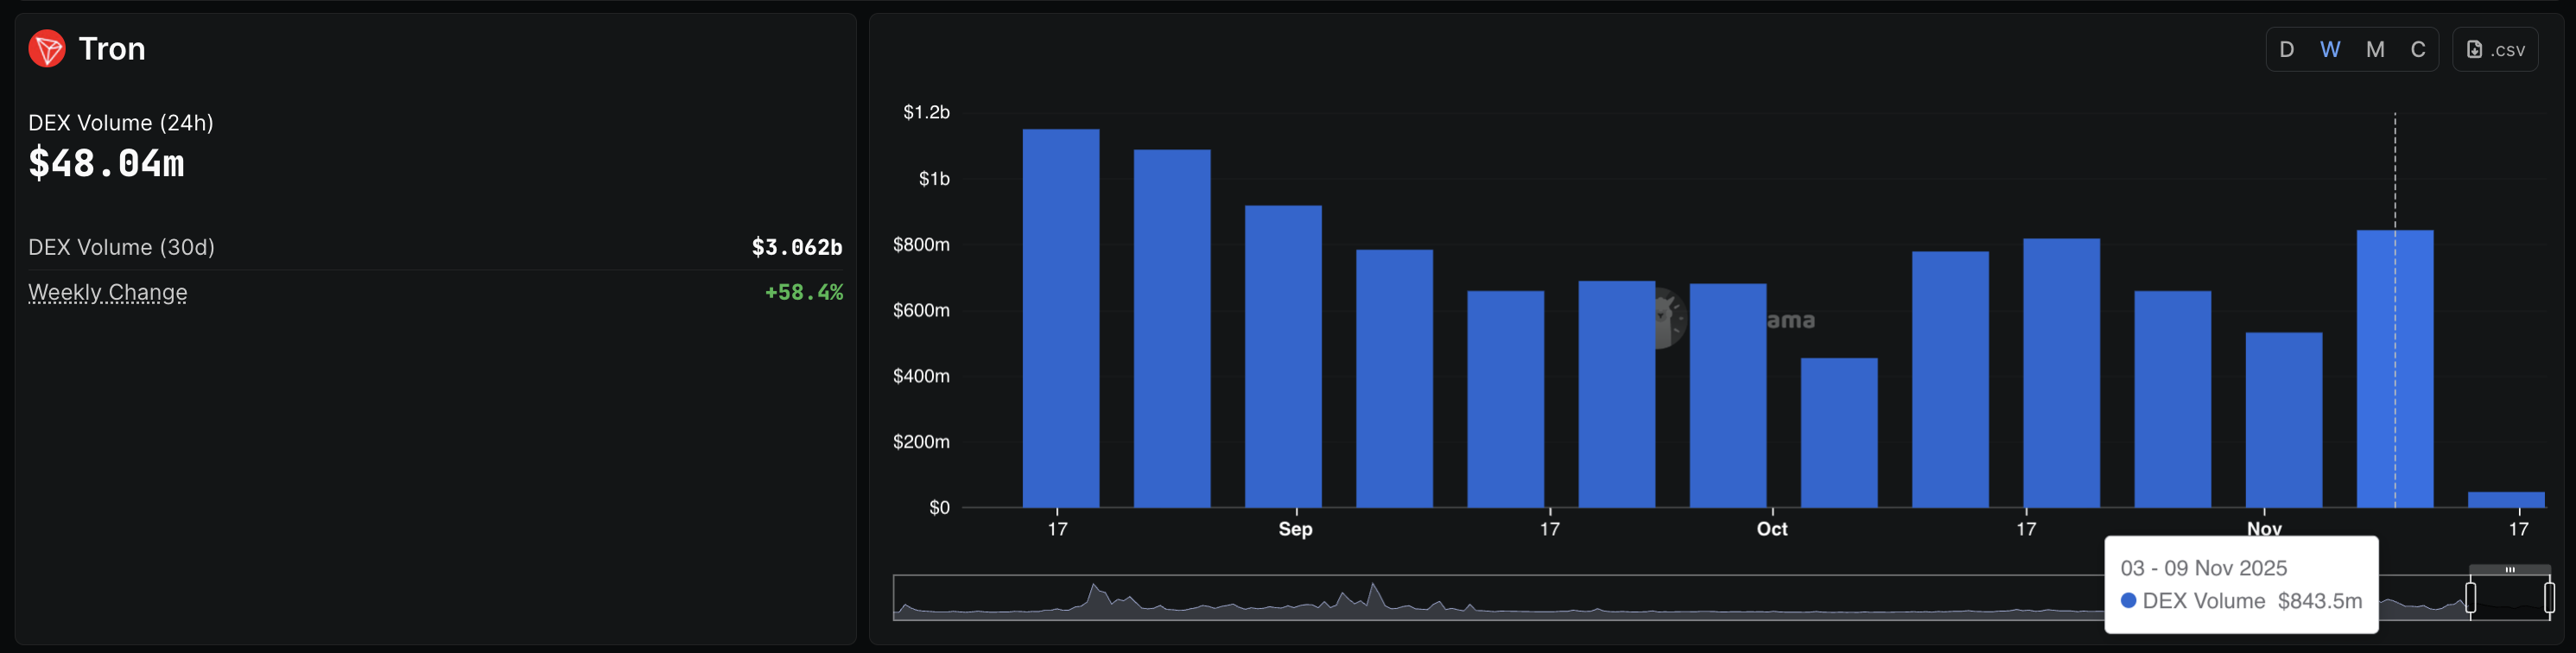
- The weekly DEX volume on the Tron network has hit a record high since September, suggesting steady on-chain demand.
Tron (TRX) takes a breather above $0.2900 at press time on Tuesday, after securing 2% gains on Monday. The Chinese Billionaire Justin Sun’s layer-1 project is generating on-chain demand with increasing volume on its Decentralized Exchanges (DEXs), while fear in the retail segment dissipates, stabilizing TRX futures.
The technical outlook for Tron shows upside potential to challenge the overhead moving averages and resistance trendline.
Renewed on-chain demand as retail sentiment stabilizes
Tron maintained a steady on-chain demand last week, overlooking the volatility in the broader cryptocurrency market. DeFiLlama data show that the DEX volume on the Tron network reached $843.5 million last week, up from $532.53 million in the previous period. This increase in on-chain volume indicates a surge in user adoption, which could fuel the demand for its native token, TRX.
Meanwhile, the decline in retail demand, which began in late August, has stabilized, indicating that bullish sentiment could return. CoinGlass data shows that the TRX futures Open Interest (OI) stands at $264.52 million, remaining steady above $250 million since last week. This indicates a neutral shift in traders' sentiment from fear, suggesting the possibility of a renewed surge in demand if the broader market remains stable.
Tron’s bounce back struggle nears $0.30
Tron trades below the 200-day Exponential Moving Average (EMA) at $0.3022 while the 50-day EMA extends a declining trend after crossing below the 100-day EMA, which marked a Death Cross pattern on the daily chart.
The short-term recovery in TRX reflects an extension of the bounce back from a support trendline formed by connecting the February 3 and March 17 lows. The recovery run should surpass the 200-day EMA at $0.3022 to extend the upward trend.
Key resistances for Tron, apart from the 200-day EMA, are the 50-day EMA at $0.3104 and the overhead resistance trendline near $0.3261 formed by connecting the August 14 and October 6 highs.
The momentum indicators on the daily chart suggest a decline in selling pressure as the Relative Strength Index (RSI) is at 46, rebounding from the oversold zone, and aims to surpass the midpoint line. At the same time, the Moving Average Convergence Divergence (MACD) extends upwards after crossing above the signal line on Saturday, with increasing green histogram bars, indicating renewed bullish momentum.
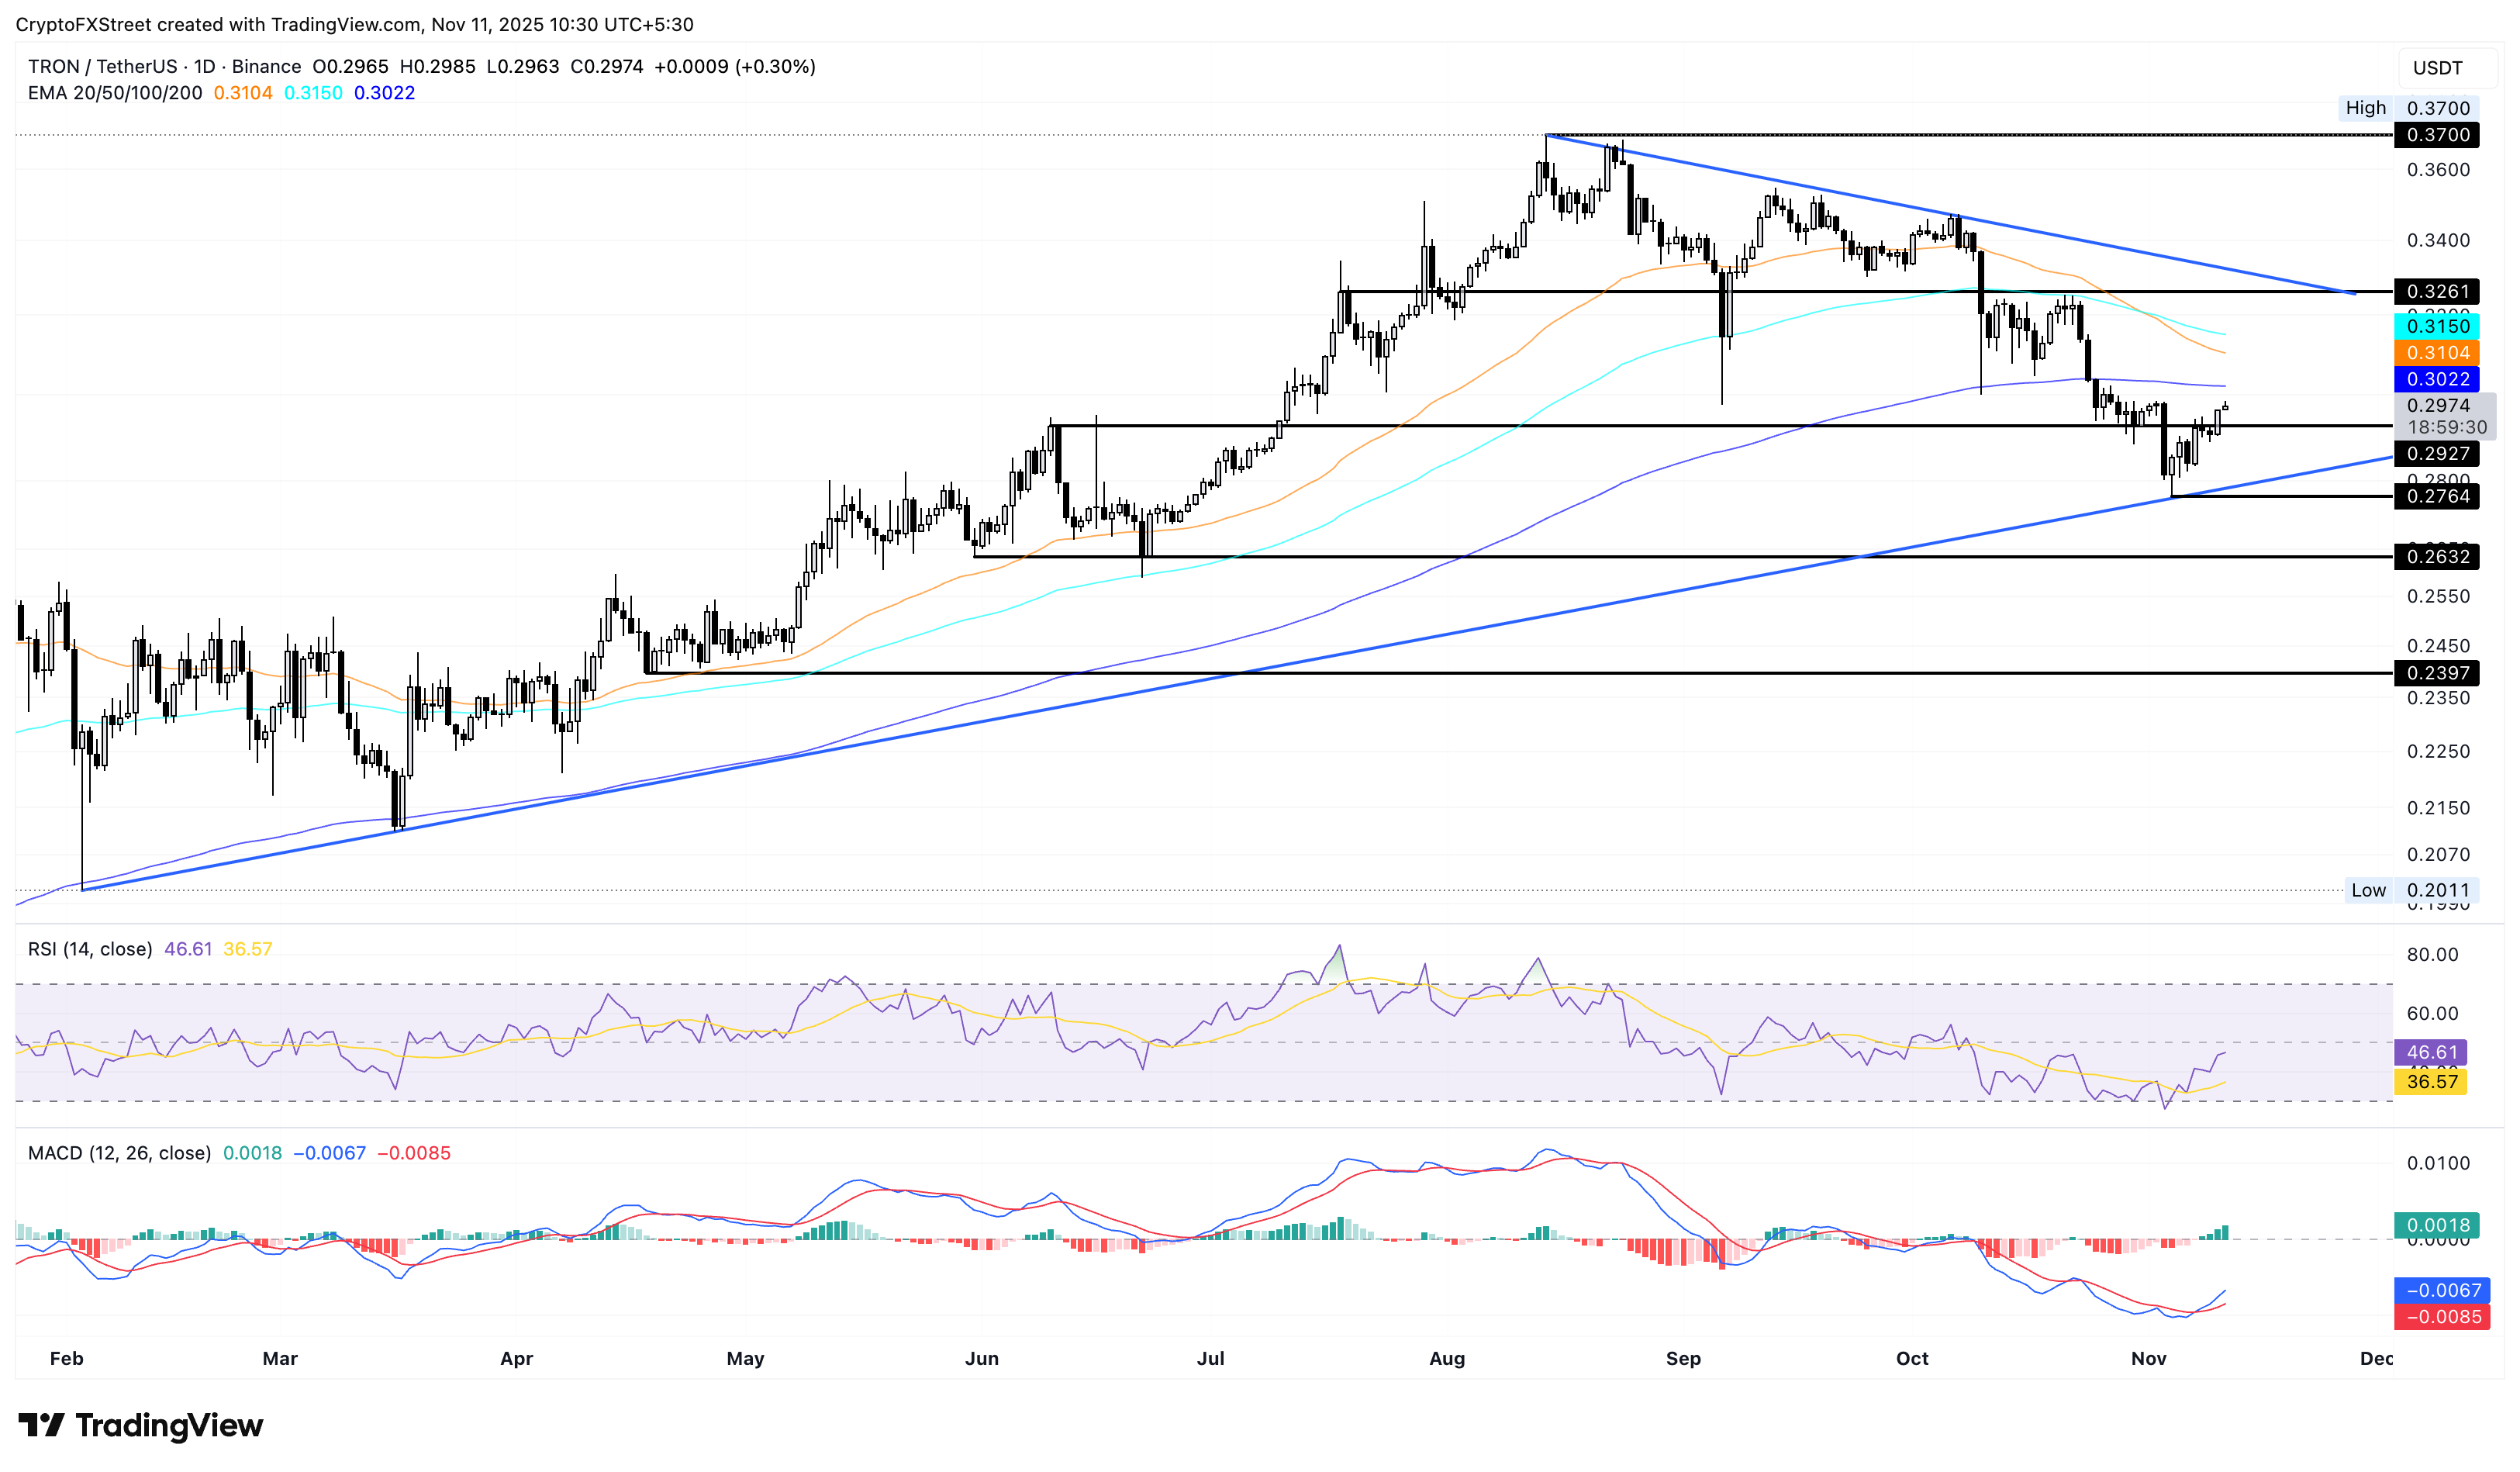
However, if TRX revisits the last week’s low at $0.2764, it would nullify the bounce back, risking an extended correction to the May 31 low $0.2632.
Recommended Articles


