


Cardano Price Forecast: ADA shows signs of recovery as whales accumulate and bullish momentum builds
- Cardano price extends its rebound on Monday after finding strong support around a key technical level last week.
- On-chain data indicates growing whale accumulation, accompanied by a rise in social dominance, signaling renewed investor interest.
- The technical indicators point to a fading bearish momentum, suggesting the early stages of a potential bullish trend.
Cardano (ADA) price extends gains, trading above $0.59 at the time of writing on Monday after rebounding from the key support last week. On-chain metrics indicate growing whale accumulation alongside rising social dominance, reflecting renewed investor confidence. Technical indicators suggest fading bearish momentum, hinting at the early stages of a potential bullish reversal.
Cardano climbs as whales buy the dip
Santiment’s Supply Distribution data supports a bullish outlook for Cardano, as certain whales are buying ADA at recent price dips.
The metric indicates that whales holding between 1 million and 10 million ADA tokens (yellow line) and 10 million and 100 million tokens (blue line) have accumulated a total of 160 million ADA tokens from Thursday to Monday. This shows that this set of whales seized the opportunity and accumulated Cardano at a discount.
 [09-1762753138569-1762753138571.46.35, 10 Nov, 2025].png)
Santiment’s Social Dominance metric for Cardano further supports a bullish outlook. The index measures the share of ADA-related discussions across the cryptocurrency media. It has risen from 0.18% on Saturday to 1.29% on Monday, the highest level since the end of September. This rise indicates growing investor interest and increased community engagement around Cardano.
 [09-1762753160608-1762753160610.46.47, 10 Nov, 2025].png)
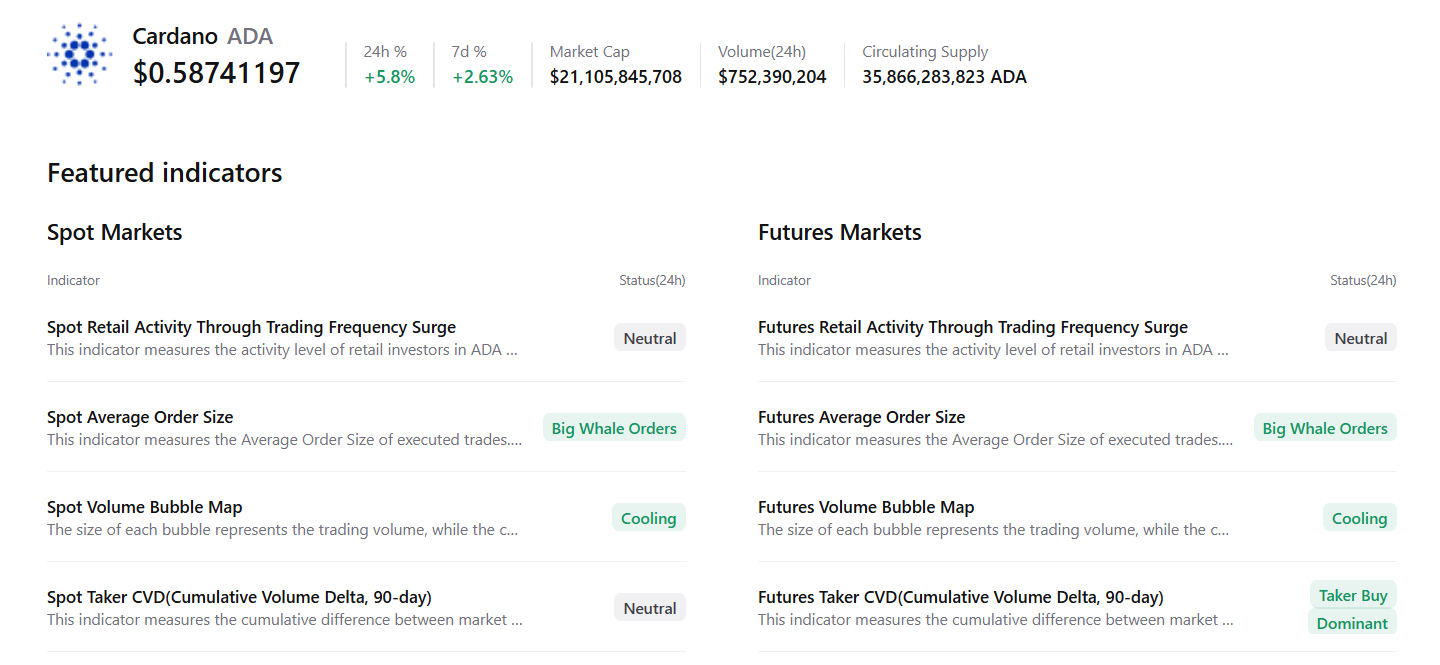
CryptoQuant’s summary data supports the positive outlook, as ADA’s spot and futures markets show large whale orders, cooling conditions, and buy dominance, signaling a potential recovery ahead.
Cardano Price Forecast: ADA rebounds after retesting key support zone
Cardano price found support around the daily level of $0.49 on November 4 and recovered by 11% by Sunday. At the time of writing on Monday, ADA continues its recovery, trading above $0.59.
If ADA continues its recovery, it could extend the rally toward the next daily resistance at $0.70.
The Relative Strength Index (RSI) on the daily chart is 43, pointing upward toward the neutral 50 level, indicating fading bearish momentum. For the recovery rally to be sustained, the RSI must move above the neutral level. Additionally, the Moving Average Convergence Divergence (MACD) showed a bullish crossover on Sunday, signaling a buy and indicating bullish momentum and the start of an upward trend.
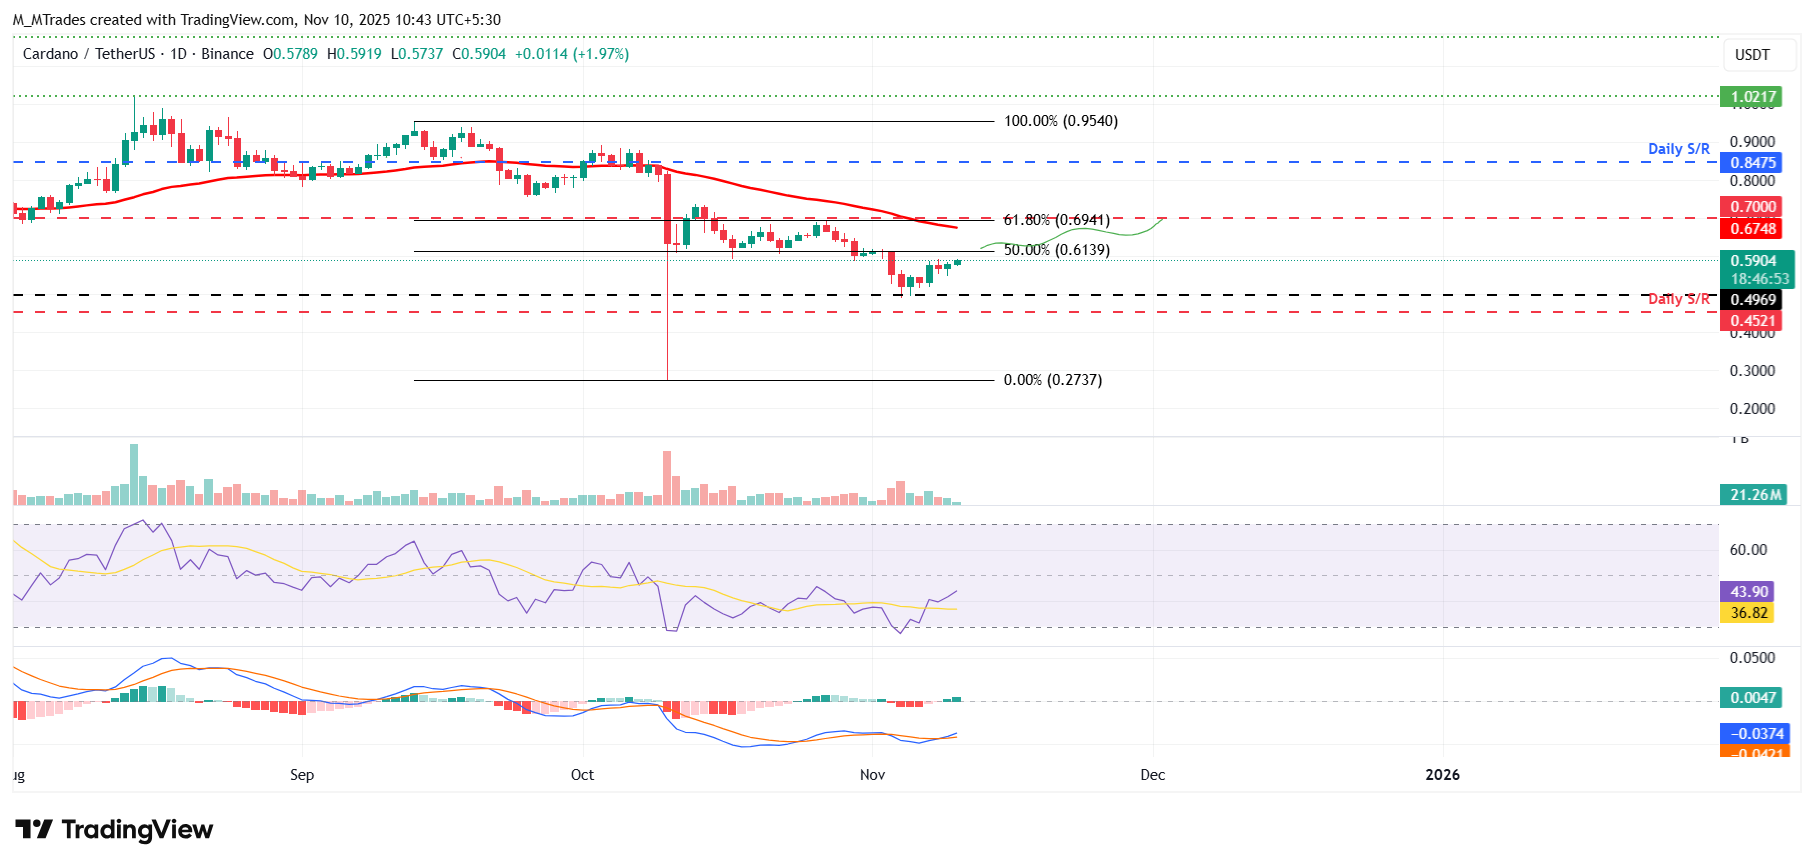
On the other hand, if ADA faces a correction, it could extend the decline toward the daily support at $0.49.
Recommended Articles


