




The Bitcoin Long: Bybit Traders Push BTC Taker Buy/Sell Ratio Above 24
Bitcoin has shown signs of resilience after setting a fresh low near $108,000, staging a recovery that lifted the price back above the $113,000 level. Bulls now try to reclaim the $115,000 level, but momentum weakens as sellers push back. The recovery eased pressure in the short term, yet uncertainty builds while the market tracks major macro risks.
The biggest concern comes from Washington, where the threat of a US government shutdown looms large. Traders expect volatility if policymakers fail to strike a deal, and risk assets like Bitcoin often react sharply to such headlines. As the deadline approaches, investors grow cautious and price action reflects that tension.
Amid this backdrop, top analyst Maartunn flagged a notable Bitcoin Alert on Bybit. The Taker Buy/Sell Ratio surged to unusually high levels, signaling that traders opened aggressive long positions. Such spikes often reveal strong bullish conviction, but they can also create instability if those positions unwind.
Bybit Data Shows Surge in Long Positions
Analyst Maartunn highlighted a striking development in Bitcoin’s market structure: the Taker Buy/Sell Ratio on Bybit has surged to 24.26, marking the highest level since September. This unusual spike signals that traders have opened an aggressive wave of long positions, a move often interpreted as a strong bullish signal.
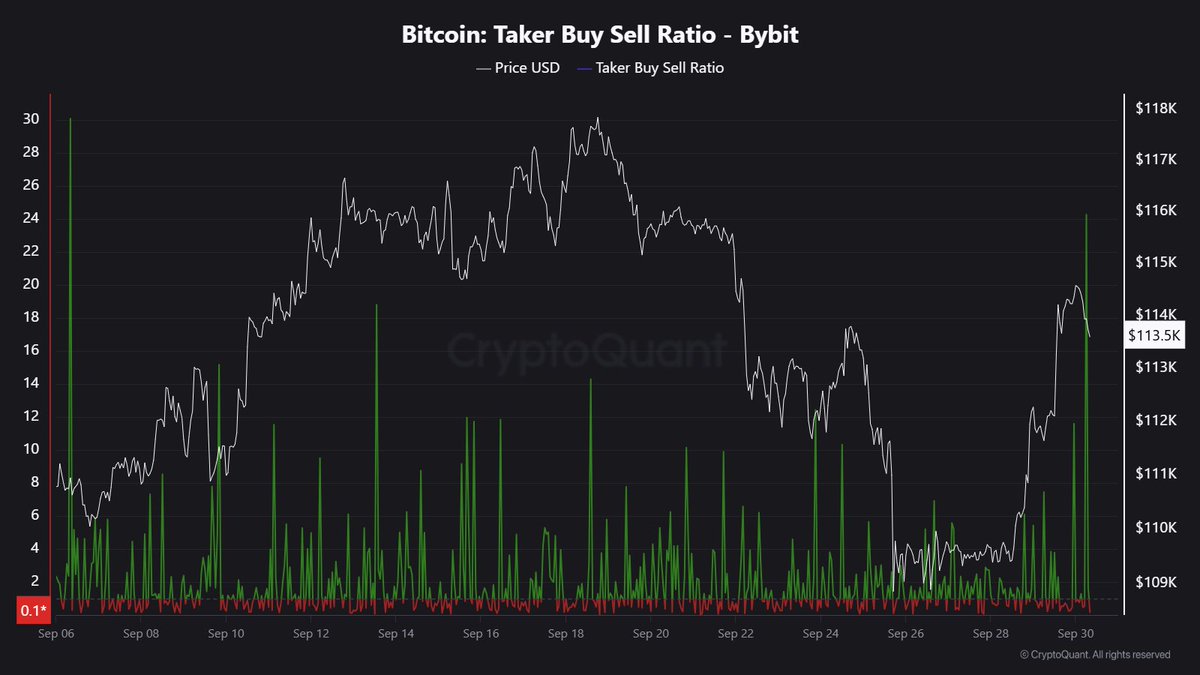
According to Maartunn, this type of imbalance reflects a market where buy orders significantly outweigh sell orders, pointing to a sudden shift in sentiment. When the ratio reaches such extremes, it suggests that a large amount of fresh capital is entering through the long side of the order book. This indicates confidence among traders that Bitcoin’s rebound above $113,000 may have further room to expand if momentum holds.
However, the implications are not one-sided. A surge in long positioning can add fuel to rallies, but it can also increase vulnerability if price action turns against overleveraged traders. In such cases, the market risks a cascade of liquidations, which can accelerate downward moves just as quickly as they amplify upward momentum.
The coming days will be critical as Bitcoin tests the $115,000 resistance zone. A decisive breakout could validate the bullish positioning and pave the way toward $117,500. On the other hand, failure to push higher may trigger profit-taking or liquidations, pulling the price back toward $110,000.
Bitcoin Holds Key Support But Faces Strong Barrier
Bitcoin trades near $113,100 after bouncing from lows around $109,200, showing resilience in the face of recent selling pressure. On the 3-day chart, the price sits between critical levels: support from the 50-period moving average (blue) and resistance at the $117,500 zone, highlighted in yellow. This range has defined Bitcoin’s behavior for several weeks, and the market continues to consolidate within it.

The broader structure reveals a series of lower highs since the July peak near $125,000, suggesting waning momentum in the medium term. However, the long-term trend remains intact, with the 100-period (green) and 200-period (red) moving averages trending upward and providing a strong base around $100,000 and $80,000 respectively.
A decisive break above $117,500 would invalidate the current lower-high structure and open the door for a retest of $120,000 and beyond. Conversely, failure to hold above $110,000 could drag Bitcoin lower, exposing the $105,000 region and testing investor confidence.
Featured image from Dall-E, chart from TradingView
Recommended Articles


