Stellar Price Forecast: XLM poised for breakout amid rising TVL, fading bearish momentum

Source Fxstreet
  • Stellar price trades within a falling wedge pattern, aiming for a breakout with a potential bullish move.
  • On-chain and derivatives data indicate positive momentum, as TVL rises and bullish bets reach the highest in over a month.
  • Technicals suggest a bullish leg ahead, as momentum indicators show signs of fading bearish pressure.

Stellar (XLM) price edges slightly lower, trading within a falling wedge pattern on the daily chart around $0.370 at the time of writing on Tuesday. A breakout of this continuation pattern would favor the bulls. The bullish outlook is further supported by the rising Total Value Locked (TVL) and the increasing number of bullish bets among traders. Furthermore, momentum indicators also suggest that bearish pressure is fading, indicating that XLM may be poised for an upside breakout.

On-chain and derivatives data show a bullish bias

Arthemis Terminal data shows that XLM’s TVL increases to $144.4 million on Tuesday from $139.1 million on Saturday, nearing its record high levels of $153.6 million reached in August. Rising TVL indicates growing activity and interest within Stellar’s ecosystem, suggesting that more users are depositing or utilizing assets within XLM-based protocols.

Stellar TVL chart. Source: Artemis

Stellar TVL chart. Source: Artemis

On the derivatives side, XLM bullish bets among traders reach the highest level in over a month. The CoinGlass chart below shows that the XLM long-to-short ratio stands at 1.07 on Tuesday, indicating that traders are betting on the asset’s price to rise.

XLM long-to-short ratio chart. Source: Coinglass

XLM long-to-short ratio chart. Source: Coinglass

Stellar Price Forecast: XLM shows fading bearish momentum 

XLM price trades within a falling wedge pattern (drawn by connecting multiple highs and lows with two trendlines since mid-July) on the daily chart. At the time of writing on Tuesday, XLM trades around $0.367, near the upper trendline boundary. 

If XLM breaks above the upper trendline and closes above the daily resistance at $0.382, it could extend the rally toward the July 18 high of $0.520.

The Relative Strength Index (RSI) on the daily chart reads 45, nearing its neutral level of 50, which indicates a fading of bearish momentum. However, for the breakout of the wedge pattern to be sustained, the RSI must move above its neutral level. Moreover, the Moving Average Convergence Divergence (MACD) lines are also about to flip to a bullish crossover, while the falling red histogram bars also indicate the fading of bearish momentum. 
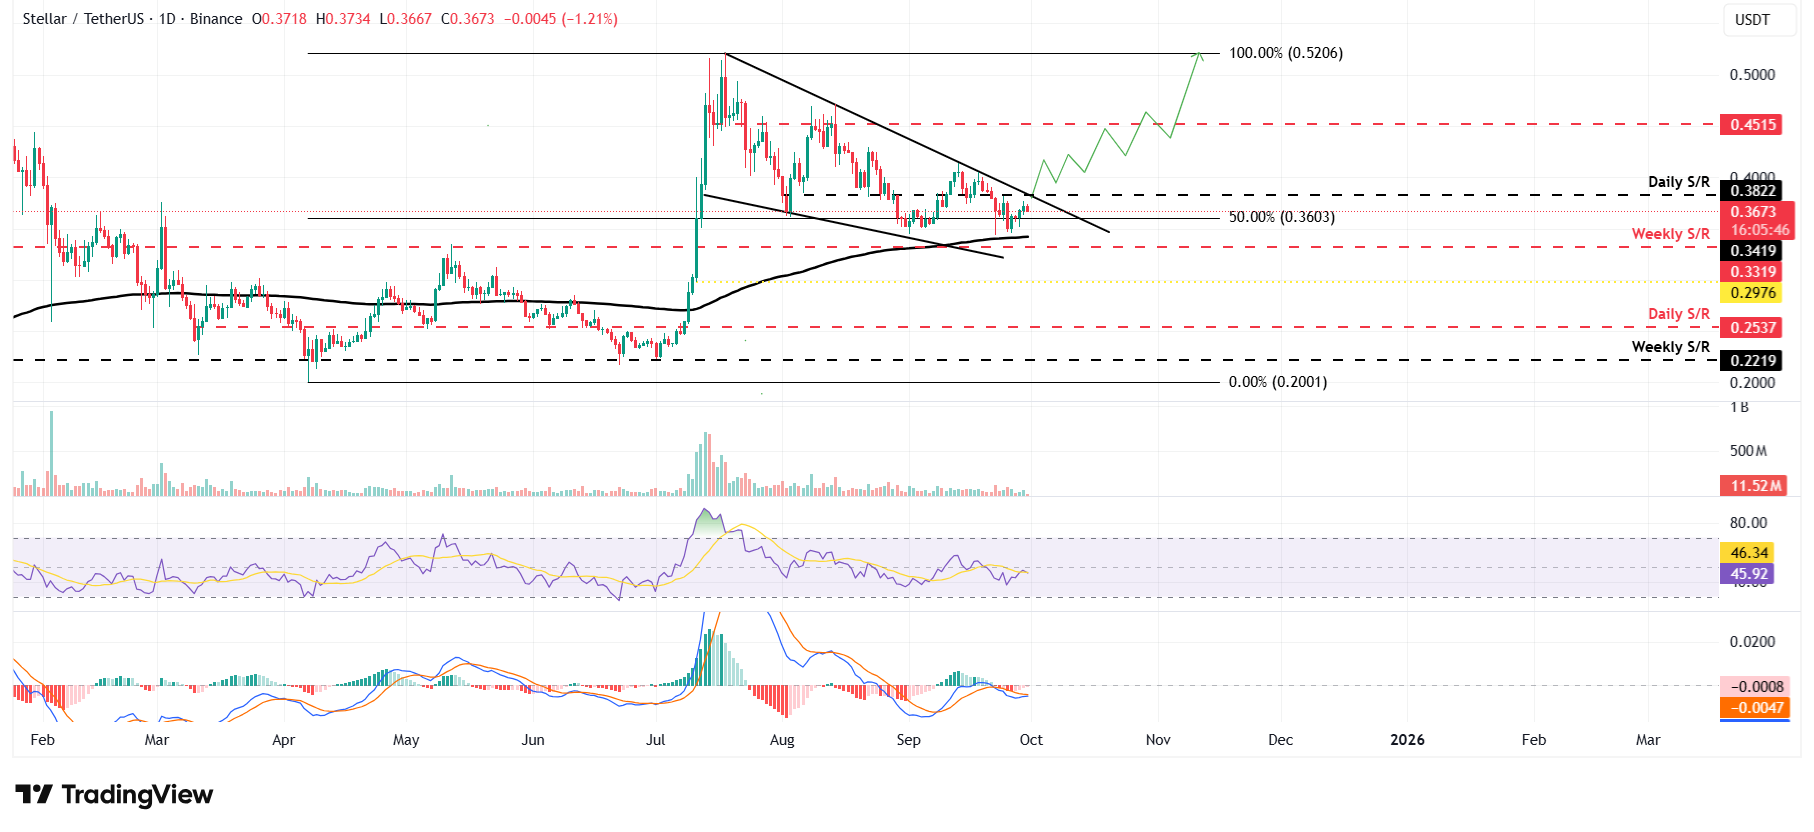
XLM/USDT daily chart 

XLM/USDT daily chart 

However, if XLM faces a correction, it could extend the decline toward the 200-day Exponential Moving Average (EMA) at $0.341.

Disclaimer: For information purposes only. Past performance is not indicative of future results.
placeholder
Bitcoin drops below $110K ahead of $22B options expiry; altcoins tumbleBitcoin fell below the $110,000 mark on Friday, heading for a steep weekly loss as nearly $22 billion in cryptocurrency options were set to expire. The drop also comes as traders await key U.S. inflation data that could influence the Federal Reserve’s policy outlook.
Author  Mitrade
Sept 26, Fri
Bitcoin fell below the $110,000 mark on Friday, heading for a steep weekly loss as nearly $22 billion in cryptocurrency options were set to expire. The drop also comes as traders await key U.S. inflation data that could influence the Federal Reserve’s policy outlook.
placeholder
Tesla set to beat Q3 delivery estimates on robust U.S. and China demand, says RBCTesla (NASDAQ: TSLA) is on track to exceed market expectations for third-quarter deliveries, driven by stronger sales momentum in both the United States and China, according to RBC Capital Markets. The firm projects 456,000 vehicle deliveries for Q3, compared with consensus forecasts of 440,000 (Visible Alpha) and 448,000 (FactSet).
Author  Mitrade
Sept 26, Fri
Tesla (NASDAQ: TSLA) is on track to exceed market expectations for third-quarter deliveries, driven by stronger sales momentum in both the United States and China, according to RBC Capital Markets. The firm projects 456,000 vehicle deliveries for Q3, compared with consensus forecasts of 440,000 (Visible Alpha) and 448,000 (FactSet).
placeholder
Dollar Weakens and Stocks Stall as Gold Rises Ahead of Fed DecisionOn Wednesday, global markets saw the dollar weaken, shares dip slightly, and gold rise to new highs as investors prepared for the Federal Reserve’s anticipated interest rate cut later in the day.
Author  Mitrade
Sept 17, Wed
On Wednesday, global markets saw the dollar weaken, shares dip slightly, and gold rise to new highs as investors prepared for the Federal Reserve’s anticipated interest rate cut later in the day.
placeholder
Key Challenges Ahead for US-China TikTok Ownership DealA newly announced framework agreement between the United States and China aims to shift TikTok’s ownership to U.S. control, raising numerous questions and challenges.
Author  Mitrade
Sept 17, Wed
A newly announced framework agreement between the United States and China aims to shift TikTok’s ownership to U.S. control, raising numerous questions and challenges.
placeholder
Oil Prices Rise Following Attacks on Russian Energy Infrastructure Oil prices climbed further on Monday as markets reacted to Ukrainian drone strikes targeting Russian refinery infrastructure, raising concerns over potential disruptions to Russia’s crude and fuel exports.
Author  Mitrade
Sept 15, Mon
Oil prices climbed further on Monday as markets reacted to Ukrainian drone strikes targeting Russian refinery infrastructure, raising concerns over potential disruptions to Russia’s crude and fuel exports.
goTop
quote