
Hyperliquid poised to breach $50 hurdle as staking balance, open interest rebound
- Hyperliquid's uptrend stalls under the 50-day EMA, but the outlook remains bullish in the short term.
- The hyperliquid staking balance has returned above the $2.2 billion mark, as confidence in the token continues to improve.
- Steady HYPE futures Open Interest underpins growing retail demand ahead of potential breakout.
Hyperliquid (HYPE) is navigating a highly volatile cryptocurrency market, trading above $46 at the time of writing on Monday. The native Decentralized Exchange (DEX) token tested support at $39.78 last Thursday, marking a 33% correction from its record high of $59.43, reached on September 18.
Hyperliquid staking, open interest reflects resilience
Hyperliquid's Decentralized Finance (DeFi) Total Value Locked (TVL) stands at $2.21 billion, up 1.85% over the past 24 hours. After peaking at $2.78 billion on September 19, the highest TVL level on record, uncertainty in the broader cryptocurrency market last week led to a decline to $2.01 billion.
If demand for Hyperliquid increases, it would support price recovery as selling pressure in the open market wanes.
The DefiLlama platform's 24-hour fees average $3.94 million, and protocol revenue stands at $3.18 million, demonstrating dominance in the DeFi sector. Meanwhile, the DEX's $84 billion cumulative trading volume underscores its dominance in on-chain perpetuals, bolstered by the recently launched USDH stablecoin.
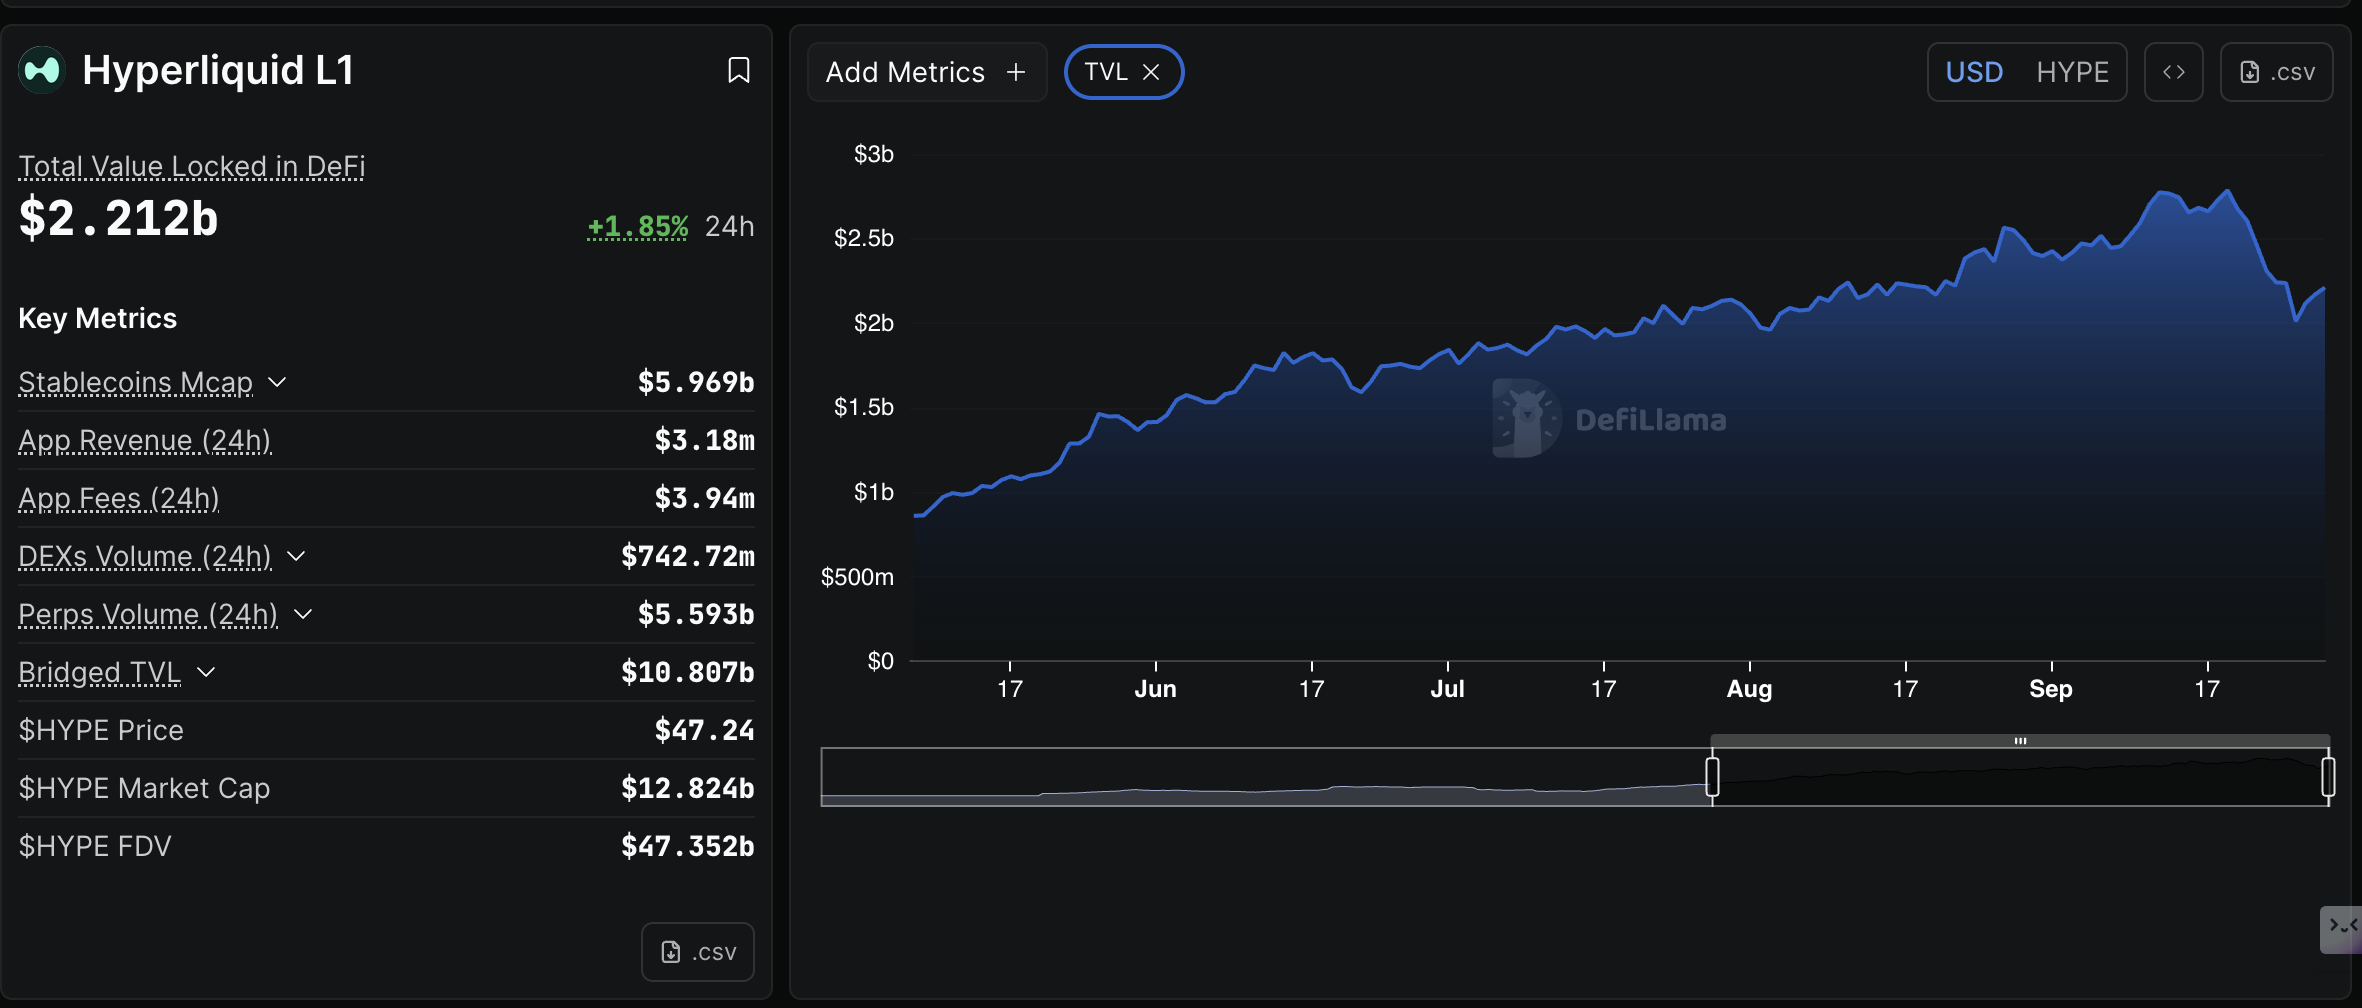
DeFi TVL stats | Source: DefiLlama
On the other hand, traders are cautiously optimistic, with Hyperliquid futures' Open Interest (OI) stabilizing at $2.3 billion as of the time of writing on Monday.
OI refers to the notional value of all futures contracts; hence, stability implies a general tilt toward stability and a gradual price increase. This also means that engagement and speculation at the current levels support stability, creating a suitable environment for a bullish breakout.
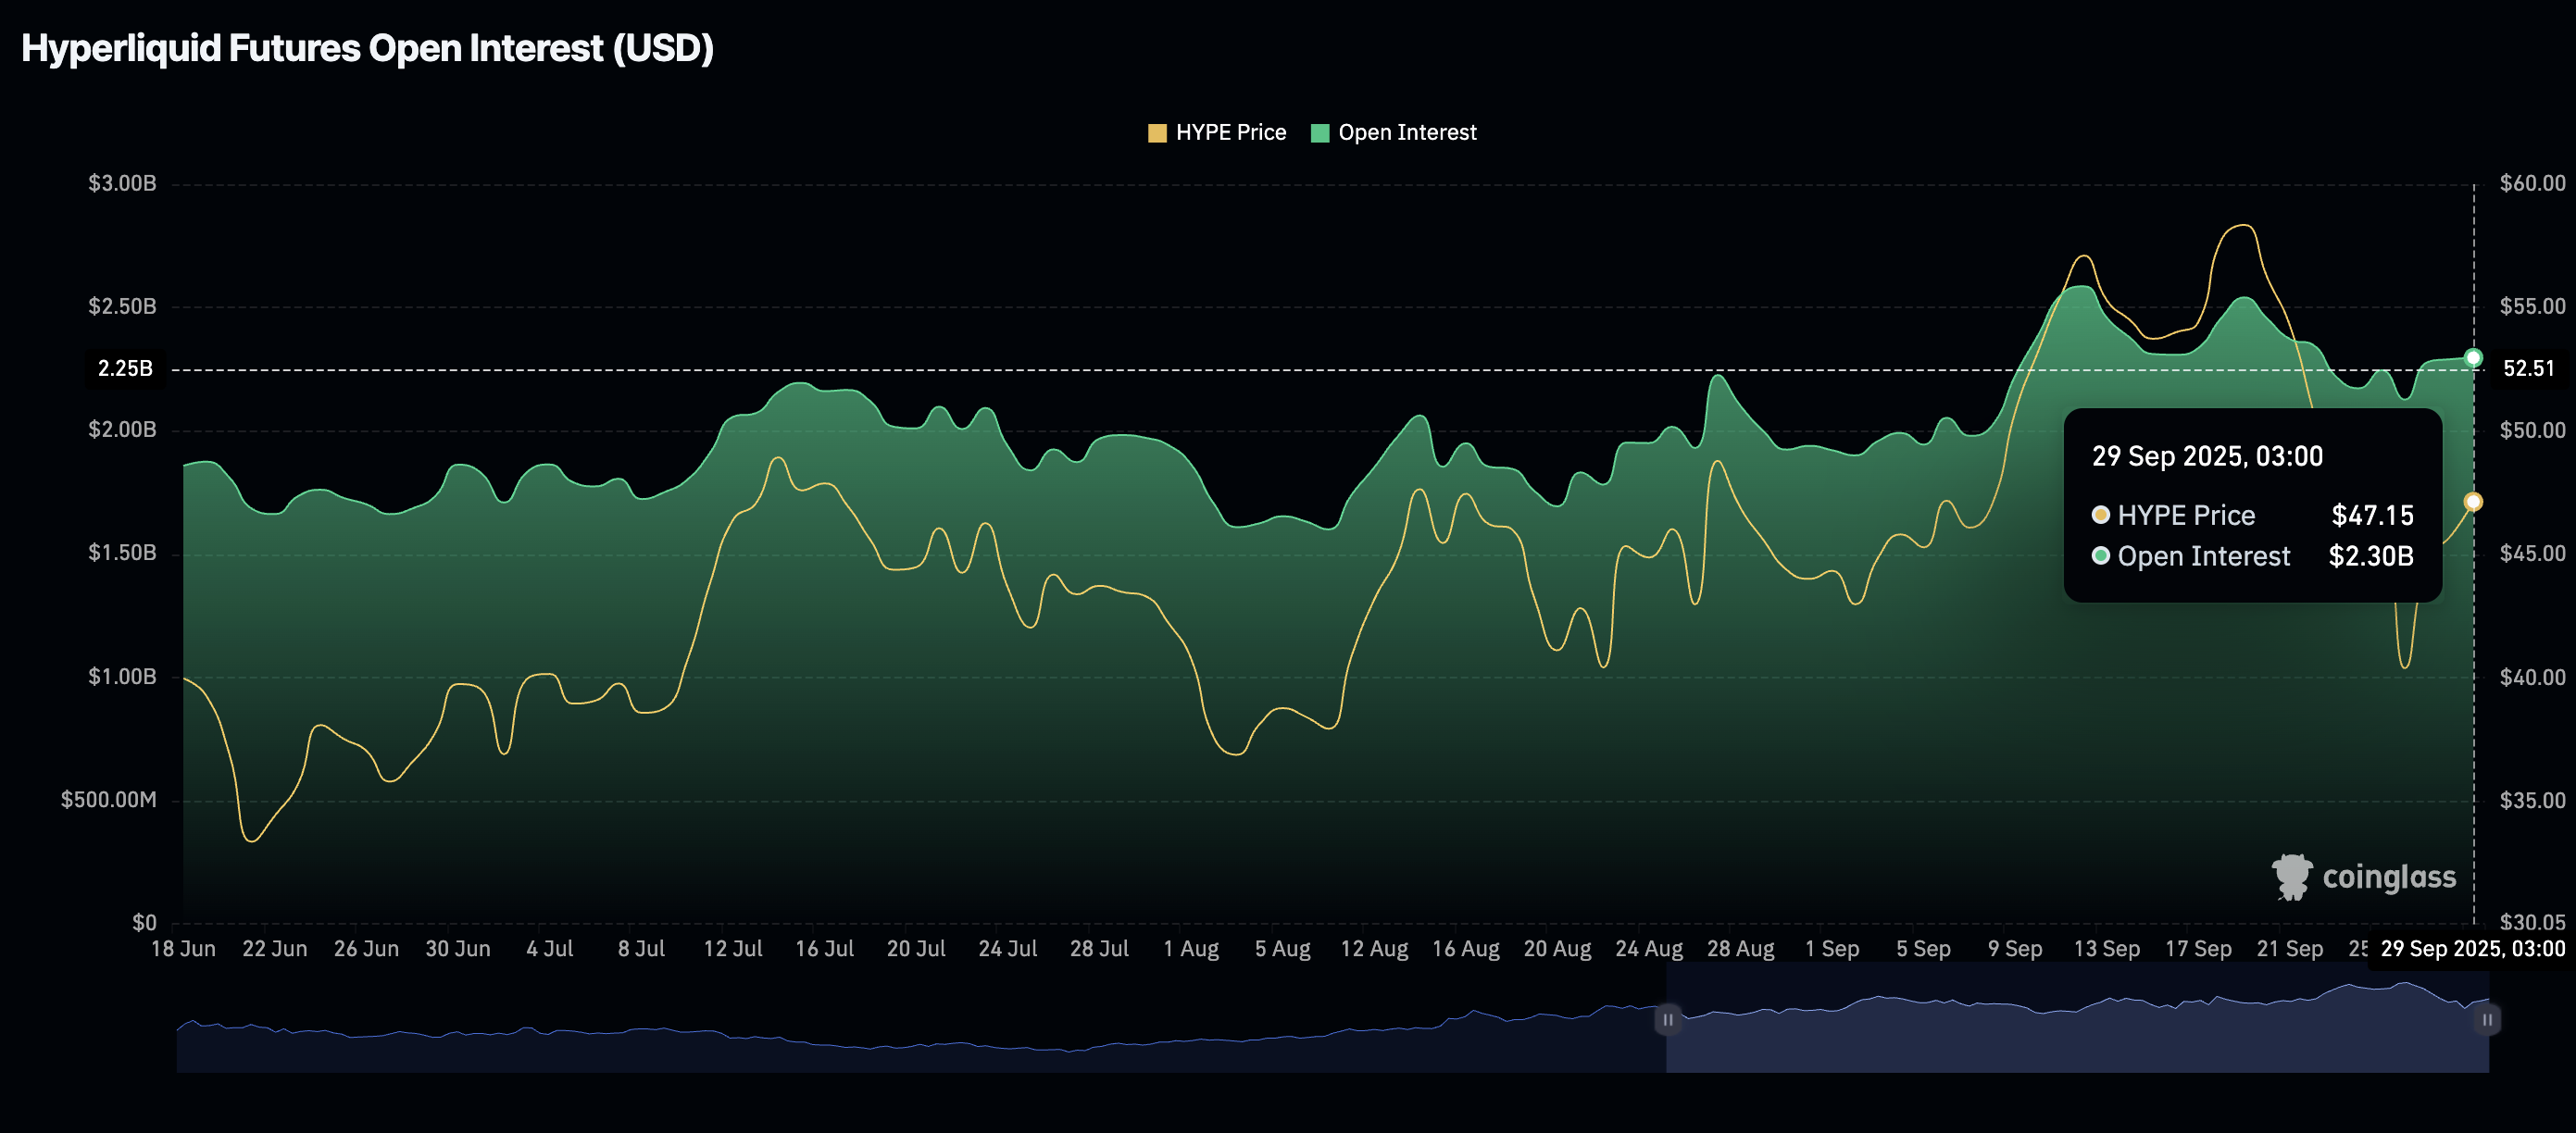
Hyperliquid Open Interest | Source: CoinGlass
Technical outlook: Assessing Hyperliquid's potential breakout
Hyperliquid is currently trading between support provided by the 100-day Exponential Moving Average (EMA) at $44.05 and resistance highlighted by the 50-day EMA at $47.57. With DeFi TVL and Open Interest holding steady, HYPE could extend its recovery above a key ascending trendline and the round-number hurdle at $50.00.
Steady token buybacks and Hyperliquid's dominance in the perpetual DEX sector could continue boosting the token's bullish outlook. Traders will look out for a potential buy signal from the Moving Average Convergence Divergence (MACD) indicator to validate the bullish picture.
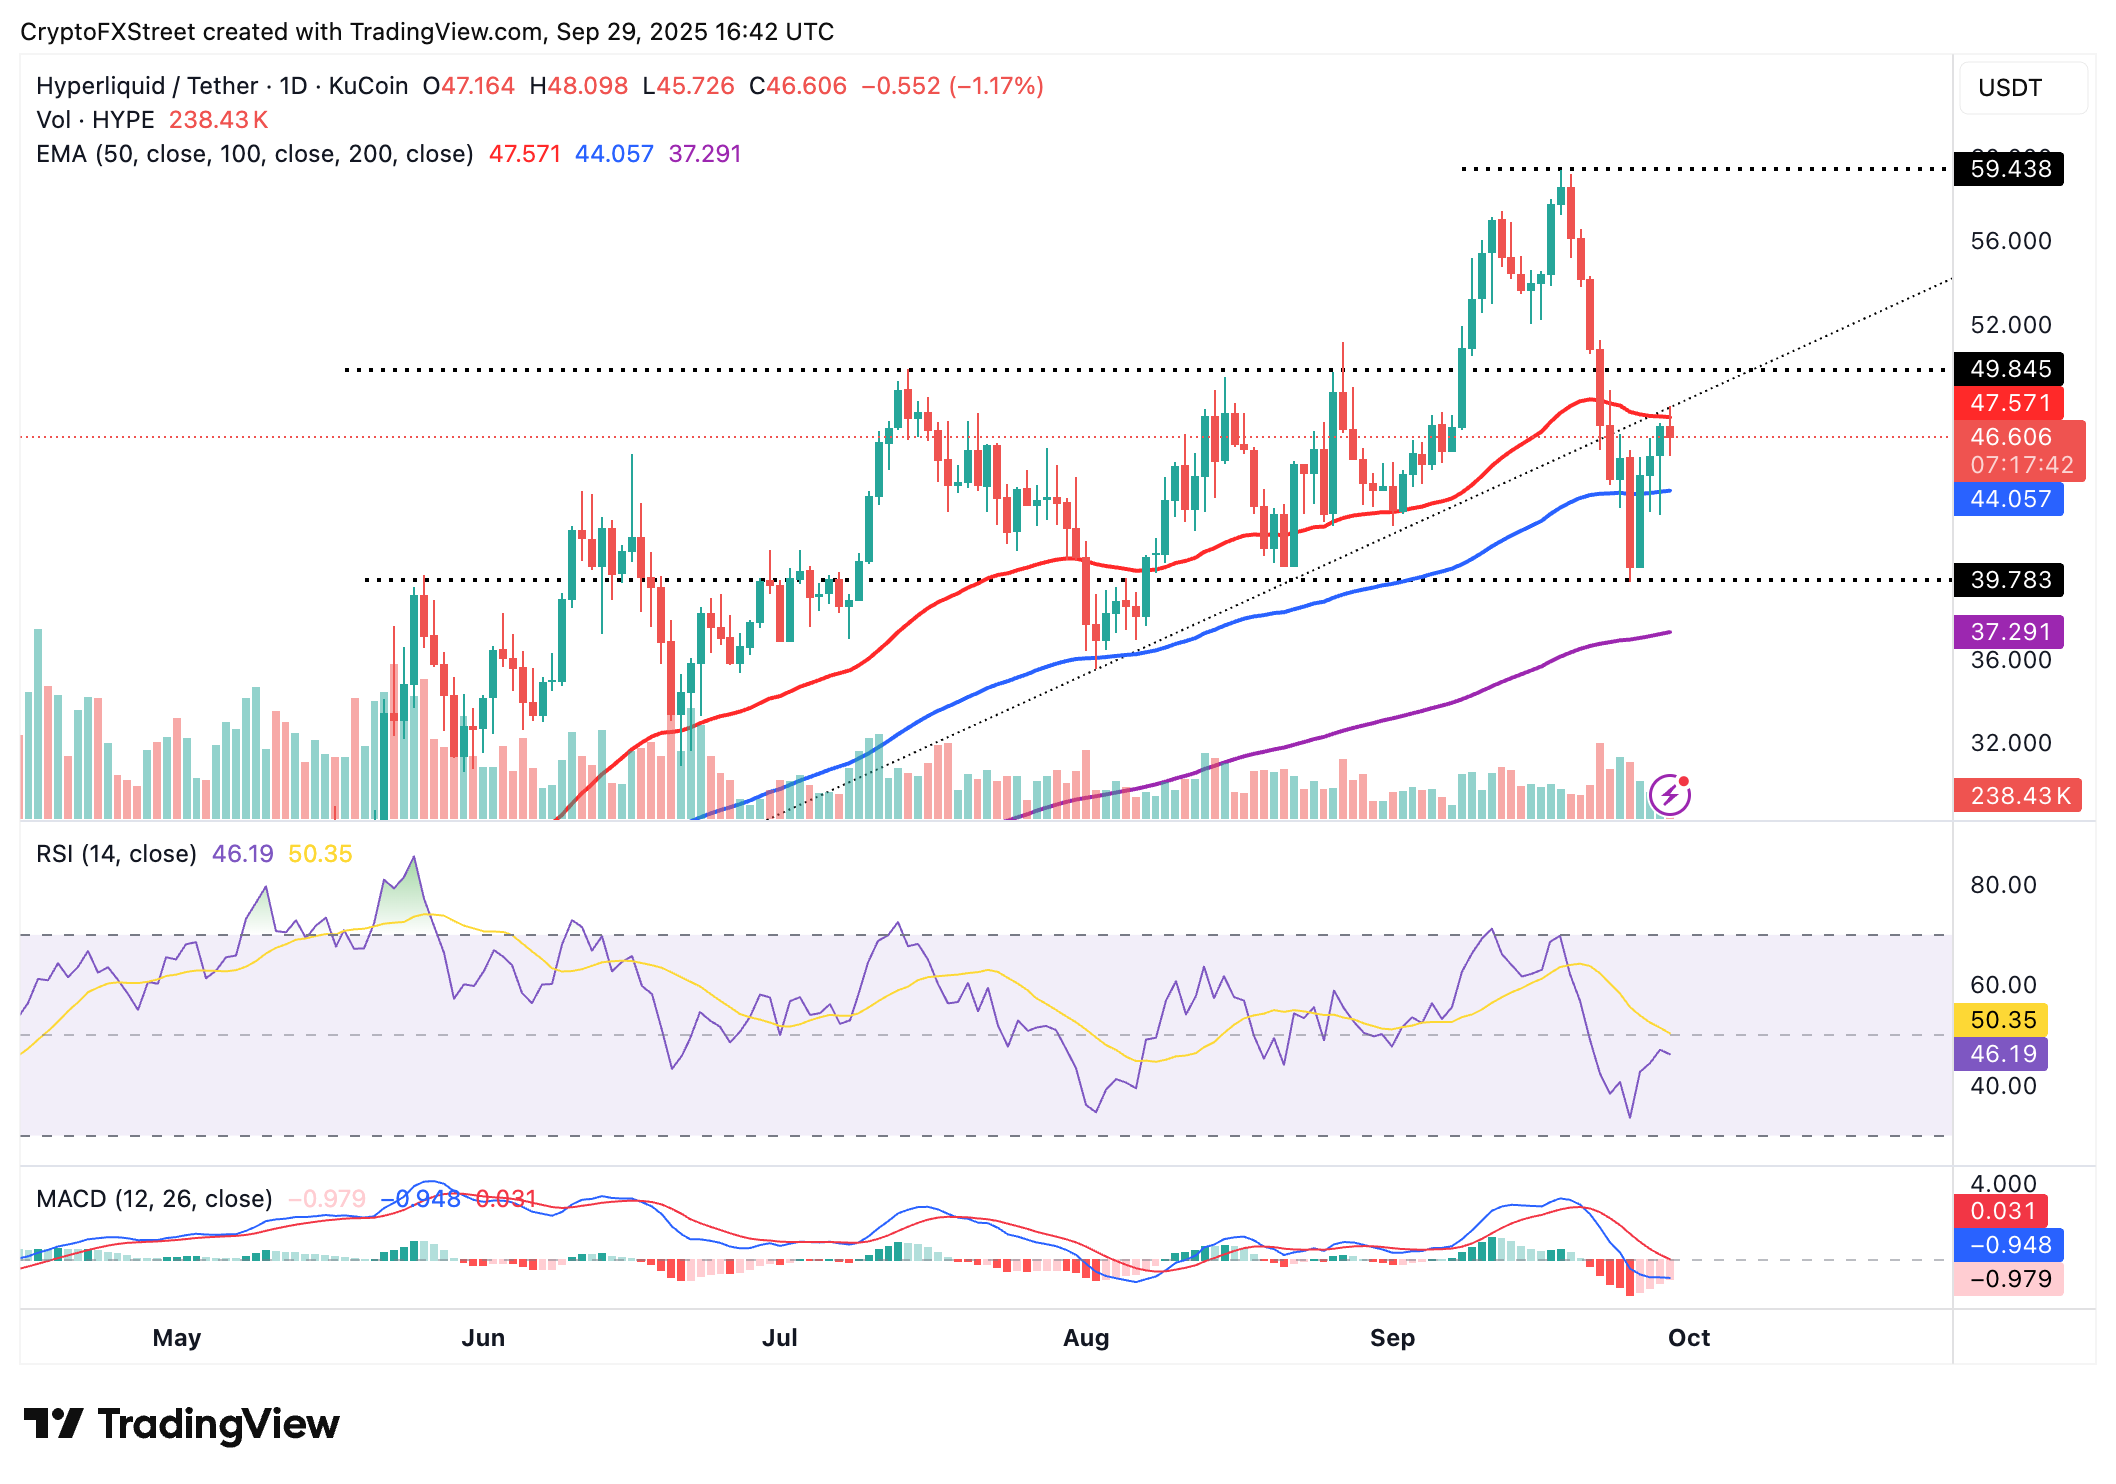
HYPE/USDT daily chart
A daily close below the 50-day EMA could push HYPE lower as traders consider de-risking to reduce exposure. Losing support at the 100-day EMA could pave the way for extended losses, increasing the probability of HYPE retesting the 200-day EMA at $37.29.
Open Interest, funding rate FAQs
Higher Open Interest is associated with higher liquidity and new capital inflow to the market. This is considered the equivalent of increase in efficiency and the ongoing trend continues. When Open Interest decreases, it is considered a sign of liquidation in the market, investors are leaving and the overall demand for an asset is on a decline, fueling a bearish sentiment among investors.
Funding fees bridge the difference between spot prices and prices of futures contracts of an asset by increasing liquidation risks faced by traders. A consistently high and positive funding rate implies there is a bullish sentiment among market participants and there is an expectation of a price hike. A consistently negative funding rate for an asset implies a bearish sentiment, indicating that traders expect the cryptocurrency’s price to fall and a bearish trend reversal is likely to occur.
Recommended Articles


