
Quant leads the UK Finance's tokenized Sterling initiative amid rising bullish interest
- Quant secures the UK's Tokenised Sterling Deposits initiative led by UK Finance.
- Derivatives data indicate a surge of bullish interest among traders.
- On-chain data shows a rise in whale interest as supply on exchanges declines.
Quant (QNT) price ticks higher by over 5% at press time on Friday on the back of securing UK Finance’s Tokenized Sterling Deposits (GBTD). Both the derivatives and on-chain data point to increased bullish interest in the QNT token.
Quant partners with commercial UK banks to power tokenized Sterling deposits
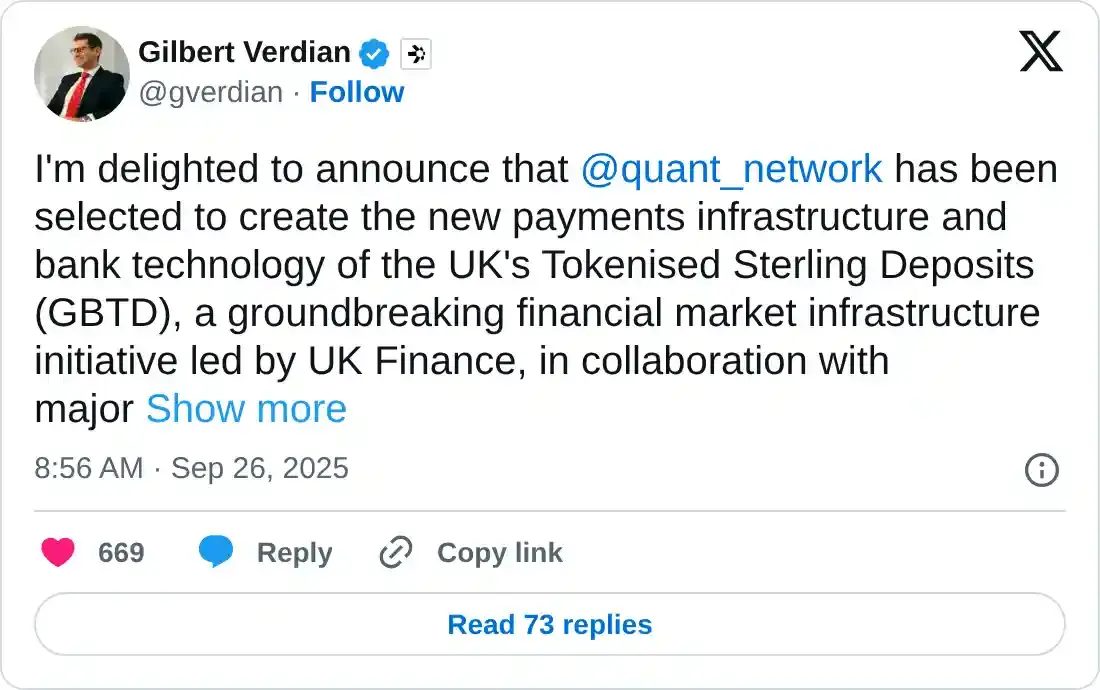
Gilbert Verdian, CEO of Quant Network, announced in an X post on Friday that the Quant Network was selected to create a digital payment infrastructure and upgrade bank technology for the tokenized Sterling deposits (GBTD) project. The Web 3.0 network will partner with commercial UK banks, including HSBC, Barclays, Lloyds, NatWest, Santander, and Nationwide.
Quant secured the tender based on its previously proven capabilities in interconnecting systems during the UK Regulated Liability Network (RLN) experimentation.
Jana Mackintosh, Managing Director of UK Finance, highlighted that the approach to tokenize the Pound Sterling aligns with the Bank of England Governor Andrew Bailey's appeal for the use of digital technology in financial transactions.
According to Mackintosh, the tokenized sterling offers a secure and regulated evolution of the payments landscape.
Rising whale interactions and Open Interest back bullish interest around Quant
Santiment data shows that QNT large transactions, those with volume over $100,000, have increased significantly this week, with 23 transactions recorded on Monday and 26 transactions on Thursday. This indicates an increased interest among large-wallet investors, commonly referred to as whales, but fails to reveal the underlying sentiment.
However, the QNT reserves on crypto exchanges remain broadly steady at 1.44 million QNT on Friday, down from 1.56 million QNT on Sunday. Generally, a buying spree among whales often leads to a decline in exchange reserves, indicating lowered supply pressure and increased demand among large-wallet investors.
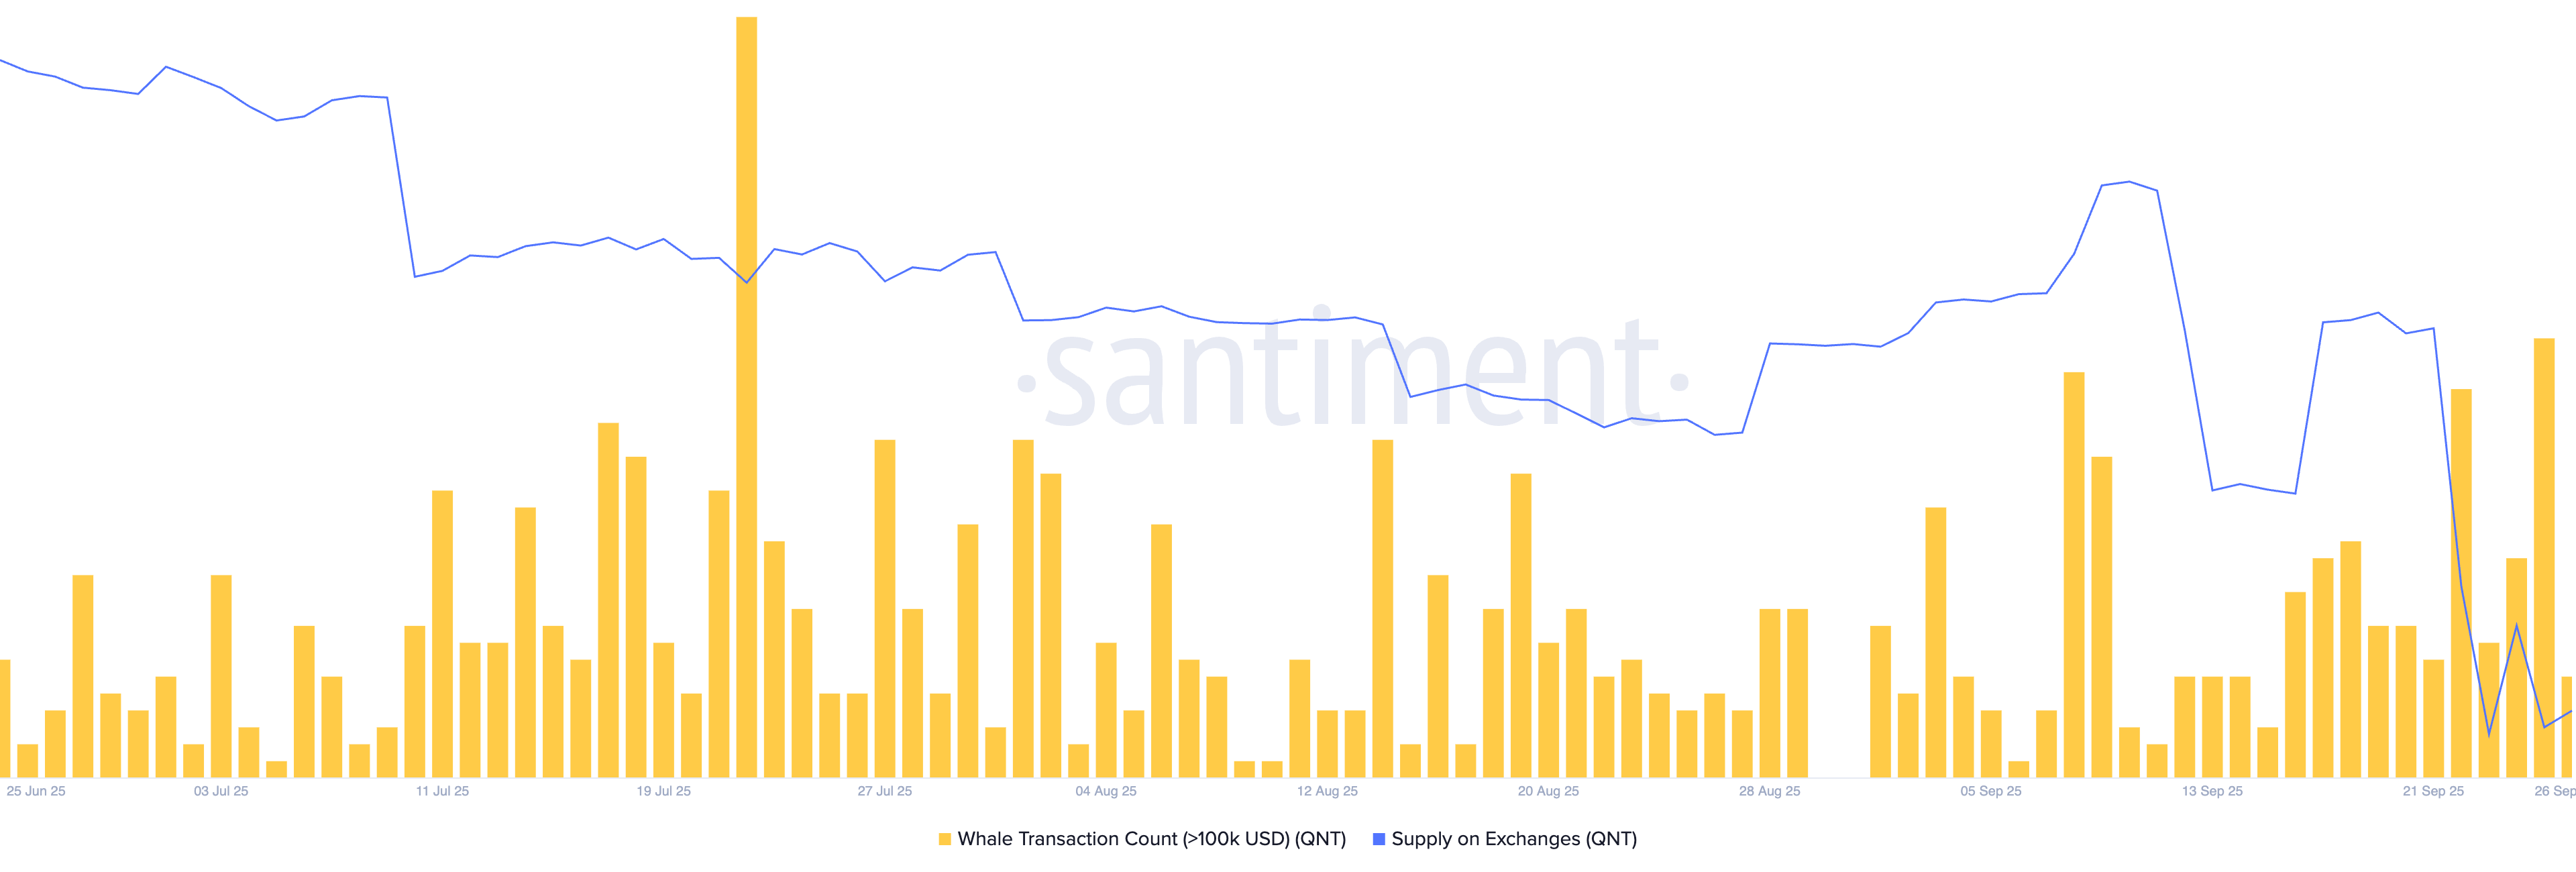
QNT whale transaction count and exchange reserve. Source: Santiment
QNT eyes bullish rebound, holding at key support level
Quant trades above $90 at press time on Friday, as it bounces off the 23.6% Fibonacci retracement level at $85.43, which is retraced from the $171.67 peak on December 7 to the $58.79 low on April 9. The intraday recovery in QNT targets the 200-day Exponential Moving Average (EMA) near the $100 psychological level.
However, the technical indicator on the daily chart indicates that the bullish momentum remains low, as the Moving Average Convergence Divergence's (MACD) signal line continues to maintain a downward trend.
The Relative Strength Index (RSI) is currently at 40, which is below the halfway line. Still, it points upwards and indicates a short-term surge in buying pressure with further room for growth before reaching the overbought zone.
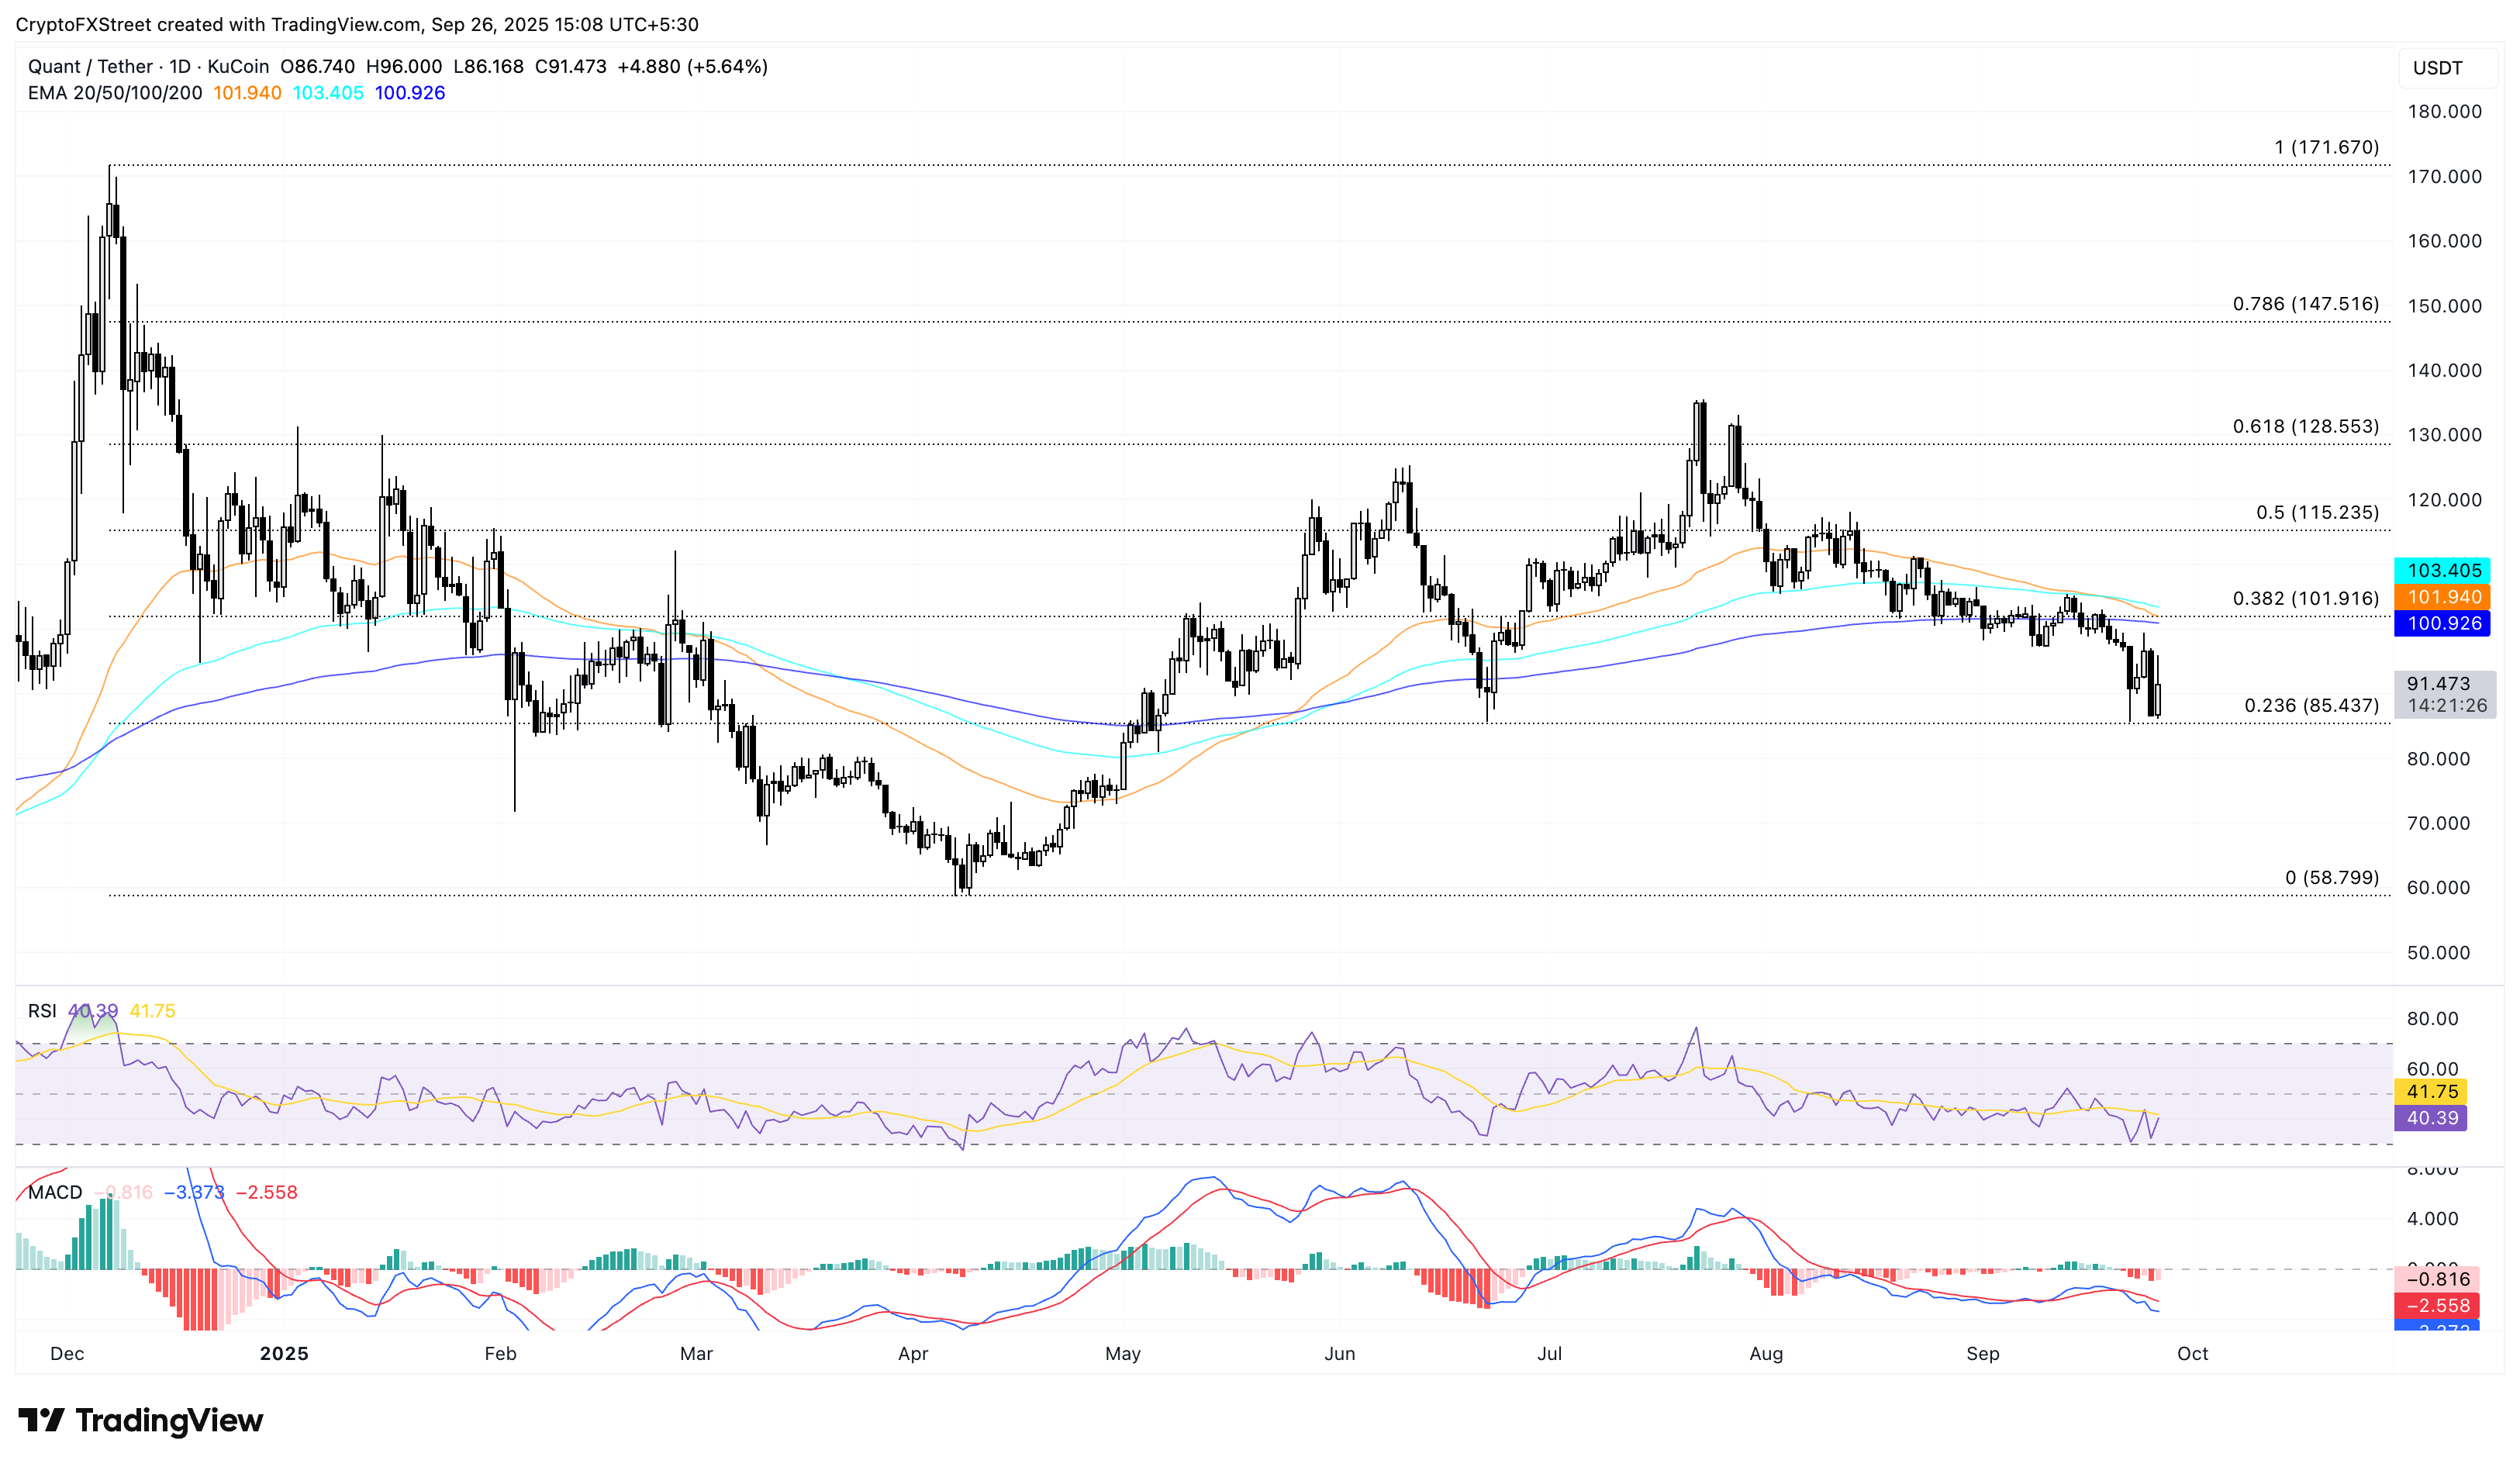
QNT/USDT daily price chart
On the other hand, if QNT drops below $85.43, it could extend the decline to the $58.79 support level.
Recommended Articles


