


Stellar Price Forecast: WisdomTree Prime leverages Stellar network, CEO Denelle Dixon calls it a milestone
- Stellar price trades within a falling wedge on Wednesday, a breakout signals a potential bullish move.
- Denelle Dixon highlights WisdomTree Prime’s use of the Stellar network, to list digital funds that track the stock market, a significant move.
- The technical outlook suggests a rally, with bulls targeting the $0.45 mark.
Stellar (XLM) price is trading around $0.37 within a falling wedge pattern at the time of writing on Wednesday, signaling a potential bullish breakout in the coming days. Denelle Dixon, CEO of Stellar Development Foundation, posts on X on Wednesday that WisdomTree Prime’s decision to leverage the Stellar network for listing digital funds that track the stock market marks a significant step in XLM’s blockchain adoption. The technical outlook suggests a potential rally, with XLM bulls targeting $0.45 mark as the next upside target.
Stellar’s growing network adoption
Denelle Dixon, CEO and Executive Director of the Stellar Development Foundation, posted on the social media platform X on Wednesday that WisdomTree Prime is using the Stellar network to list digital funds that track the stock market marks “a huge step in the right direction.”
Dixon noted that the Stellar network has “been ready for this development.”
These developments follow Nasdaq’s push to introduce tokenized securities, as the exchange filed with the US Securities and Exchange Commission (SEC) on Monday to tokenize stocks, allowing investors to trade equities either through traditional markets or on-chain.
If approved, the initiative would mark a new era for Wall Street, making Nasdaq the first US stock exchange to offer access to tokenized securities.
Moreover, Stellar could benefit from this shift by leveraging its existing tokenized asset infrastructure to deliver faster settlement, regulatory alignment, and broader market access, thereby gaining an edge over its competitors. Denelle Dixon’s optimism about WisdomTree Prime’s readiness suggests Stellar is well-positioned to capitalize on this trend.
Stellar Price Forecast: XLM bulls aiming for the $0.45 mark
Stellar price trades within a falling wedge pattern (drawn by connecting multiple highs and lows with two trendlines since mid-July). At the time of writing on Wednesday, it is nearing its upper trendline boundary, and a breakout favors the bulls.
If XLM breaks above the upper trendline boundary and closes above its 50-day Exponential Moving Average (EMA) at $0.38 on a daily basis, it could extend the rally toward its daily resistance at $0.45.
The Relative Strength Index (RSI) stands at 47, approaching its neutral level of 50, suggesting a fading of bearish momentum. For the bullish momentum to be sustained, the RSI must move above the neutral level. However, the Moving Average Convergence Divergence (MACD) showed a bullish crossover on Monday, giving buy signals and indicating improving momentum, which supports the bullish view.
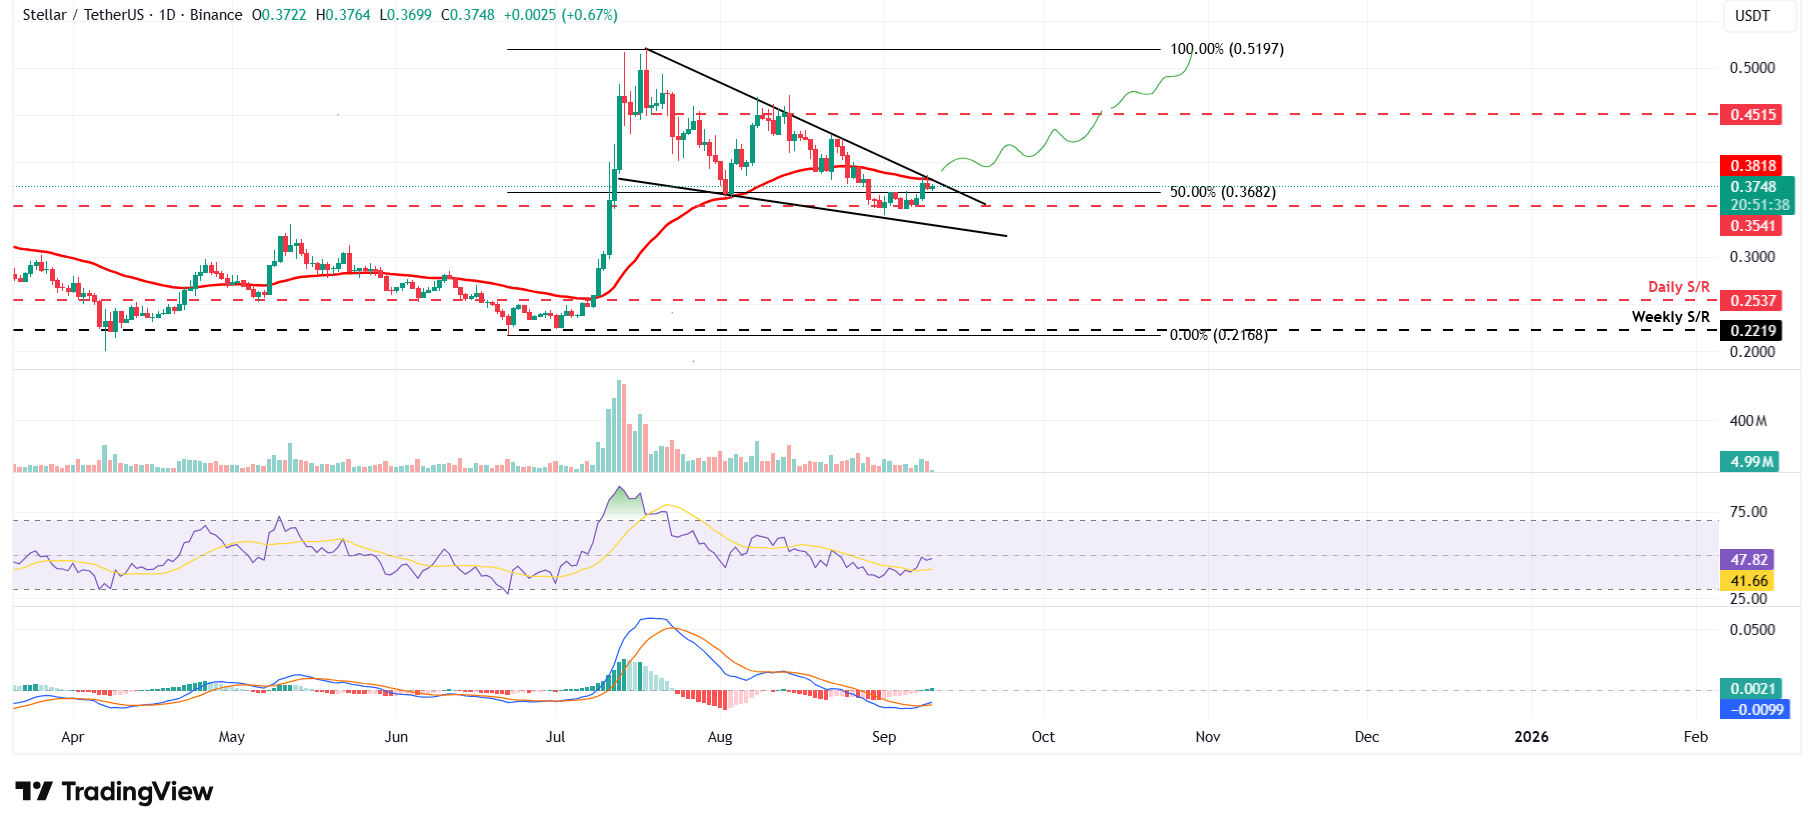
XLM/USDT daily chart
However, if XLM faces rejection from the upper trendline of the pattern, it could extend the decline toward its daily support at $0.35.
Recommended Articles


