


WTI Price Forecast: Oil prices climb on weaker USD, geopolitical tension, WTI stalls near key resistance
- Crude oil rises over 2.5% on Monday, trading near $62.60 after an early session jump to $63.25.
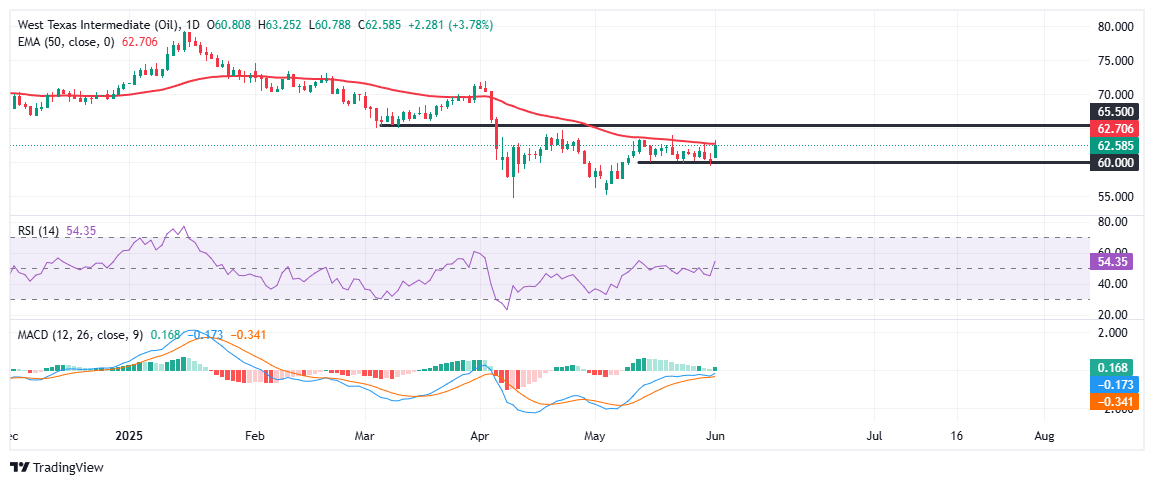
- WTI hovers below the 50-day EMA at $62.70, which has capped upside since mid-May.
- Technical indicators hint at improving momentum, but confirmation is needed for a bullish breakout.
West Texas Intermediate (WTI) crude oil edges higher on Monday, kicking off the week on a firmer footing as a weaker US Dollar (USD) and persistent geopolitical tensions between Russia and Ukraine continue to underpin market sentiment.
At the time of writing, WTI is trading near $62.60, up over 2.5% on the day, after rising as much as 4% during the early part of Monday’s session. Despite the strong intraday rally, prices remain capped just below the 50-day Exponential Moving Average (EMA) at $62.70 — a key resistance zone that has limited upside attempts since mid-May.
The latest boost in prices comes even as the Organisation of the Petroleum Exporting Countries (OPEC) and its allies, collectively known as OPEC+, confirmed on Saturday a 411,000 barrels per day (bpd) production increase for July, marking the third consecutive monthly hike of that size. The move had been widely anticipated by markets, with traders noting the increase was already priced in.
According to a Reuters report, sources close to the group’s discussions said a larger hike had been considered. “Had they gone through with a surprise larger amount, then Monday’s price open would have been pretty ugly indeed,” said Harry Tchilinguirian, analyst at Onyx Capital Group.
From a technical standpoint, WTI is showing early signs of bullish momentum, but a decisive breakout has yet to materialize. It is attempting to break out of a consolidation range that has capped price action since mid-May. After multiple failed attempts to breach the $60 psychological support level, prices have rebounded sharply, with bulls now testing the upper boundary near $62.70. The short-term structure is leaning positive, though a clear break above the 50-day EMA remains crucial for further upside traction.
At the time of writing, WTI is trading around $62.50, hovering just below the 50-day EMA. A daily close above this level would likely open the door for a continuation toward the next key resistance around $65.50 — a level that capped gains since mid-April. On the other hand, rejection from current levels could invite renewed selling pressure, especially if macroeconomic sentiment turns risk-averse. A rejection at the 50-day EMA could trigger profit-taking among short-term traders and reinforce the broader consolidation pattern, dragging prices back toward the $60.00 support zone. A sustained move below that may expose further downside toward $58.00.
Momentum indicators are showing signs of recovery, but conviction remains limited. The Relative Strength Index (RSI) has edged higher toward the midline, currently sitting near 54.20, suggesting neutral-to-bullish momentum. Meanwhile, the Moving Average Convergence Divergence (MACD) is flirting with a bullish crossover, although the histogram remains shallow, suggesting a cautious shift in sentiment rather than a confirmed trend reversal.
Recommended Articles


