



US Treasury Yields Hit Nearly 20-Year High, Dragging Gold Below $4,300: Will Gold Keep Falling?

Source Tradingkey

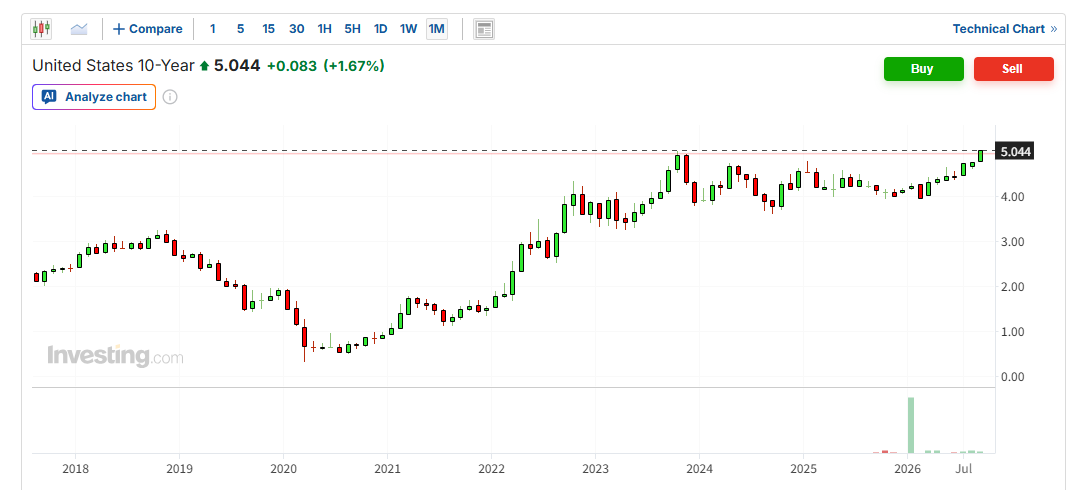
TradingKey - As of the European trading session on September 15, the 30-year U.S. Treasury yield rose to 5.3960% intraday, while the 10-year U.S. Treasury yield once touched 5.047%, both reaching near 20-year highs. As long-term yields continued to climb, spot gold (XAUUSD) fell below the $4,300 mark, retreating at one point to around $4,260.
us-29cf8ac2641746b597d2d8bbafbb1696

10-year U.S. Treasury yield chart, Source: Investing

The main factors driving the rise in U.S. Treasury yields remain inflation and monetary policy expectations. Recently, oil prices have remained elevated, with Middle East supply risks further pushing up energy prices. On Tuesday, WTI crude oil rose by approximately 1.8% to above $103, while Brent crude rose above $108. Higher energy costs have increased the risk of U.S. inflation remaining high, while also reinforcing market expectations that the Federal Reserve will continue to tighten monetary policy.

The market currently widely expects the Federal Reserve to hike interest rates by 25 basis points at the conclusion of its September meeting on Wednesday, raising the target range for the federal funds rate to 3.75%–4.00%, with the probability of a rate hike approaching 90%. Morgan Stanley expects the Fed to raise rates by 25 basis points this time and potentially hike again in December.

A high interest rate environment directly increases the opportunity cost of holding gold. Meanwhile, the continued strengthening of the U.S. dollar index further adds downward pressure on gold prices.
gold-b2494e02245648c78edbd4b136eb22f3

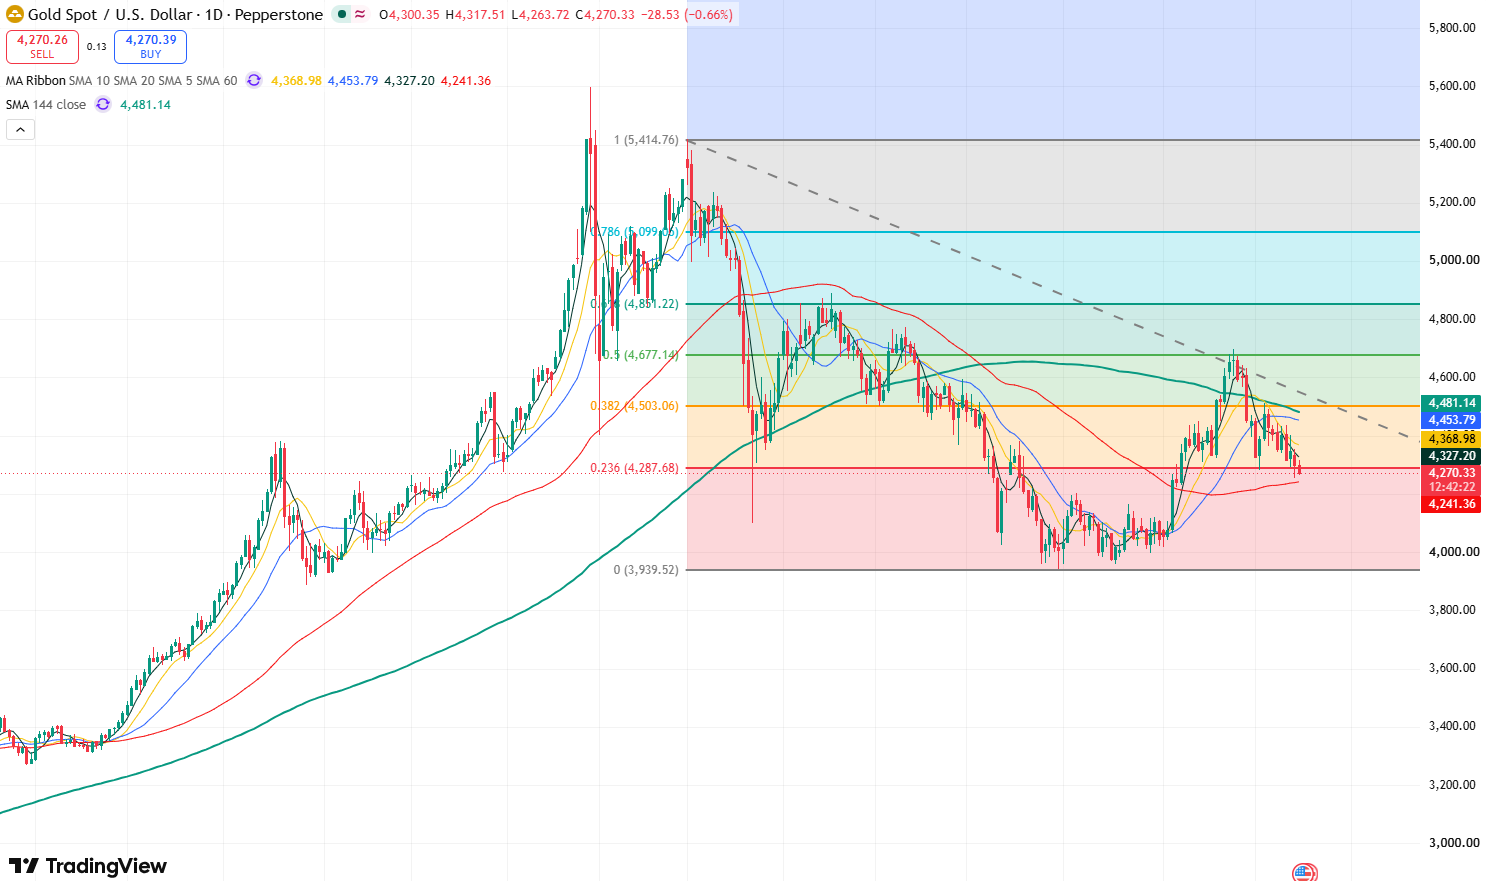
Gold price daily chart, Source: TradingView

Looking at the daily chart of gold, the closing price on Monday confirmed a breakdown below the $4,300 mark, closing at $4,298.86 that day. The decline continued today, dipping to as low as $4,263.72. The primary support level below gold prices is the 60-day moving average, around $4,241. If today's closing price can hold firmly above this level, gold prices may experience a short-term technical recovery rebound, with potential to bounce toward around $4,330.

Conversely, if gold prices fall below the 60-day moving average, they may test the support level at $4,200 on the downside. If the decline persists, gold prices could fall toward the $4,000 mark.

Disclaimer: For information purposes only. Past performance is not indicative of future results.
placeholder
USD/JPY Forecast: Yen Strength Puts 152 Support in Focus as BoJ Tightening LoomsUSD/JPY remains under pressure as the Japanese yen strengthens ahead of another potentially important Bank of Japan policy decision. The pair has fallen toward the mid-155 region after breaking below
Author  Beincrypto
Sept 22, Tue
USD/JPY remains under pressure as the Japanese yen strengthens ahead of another potentially important Bank of Japan policy decision. The pair has fallen toward the mid-155 region after breaking below
placeholder
Oracle Stock Crashes After OpenAI's Revenue Gap. Who's Next?Oracle shares plunged more than 5% on Thursday, October 8, after a report raised fresh questions about how much money OpenAI is actually making.The selloff spread across AI stocks. Broadcom fell nearl
Author  Beincrypto
Yesterday 01: 38
Oracle shares plunged more than 5% on Thursday, October 8, after a report raised fresh questions about how much money OpenAI is actually making.The selloff spread across AI stocks. Broadcom fell nearl
placeholder
Bitcoin Returns to ETF Holders’ Breakeven Price, and $729 Million Heads for the ExitUS spot Bitcoin (BTC) exchange-traded fund (ETF) investors pulled $729 million over two sessions this week. The selling hit just as BTC returned to the funds’ estimated average entry price, suggesting
Author  Beincrypto
9 hours ago
US spot Bitcoin (BTC) exchange-traded fund (ETF) investors pulled $729 million over two sessions this week. The selling hit just as BTC returned to the funds’ estimated average entry price, suggesting
placeholder
Bitcoin Price Flashes a Hidden Uptrend Signal Amid One 96% ProblemBitcoin (BTC) price trades near $82,300, still up about 28% over three months after this week’s drop.A hidden momentum signal on the daily chart suggests the uptrend can survive. The catch is that buy
Author  Beincrypto
9 hours ago
Bitcoin (BTC) price trades near $82,300, still up about 28% over three months after this week’s drop.A hidden momentum signal on the daily chart suggests the uptrend can survive. The catch is that buy
placeholder
Current S&P 500 Bull Market Turns 4 Monday and History Suggests More to ComeThe S&P 500 bull market turns 4 on Monday, up 119% to a record from its October 2022 low. Six past runs kept going after turning 4, though four bear markets later pushed the index below its birthday l
Author  Beincrypto
9 hours ago
The S&P 500 bull market turns 4 on Monday, up 119% to a record from its October 2022 low. Six past runs kept going after turning 4, though four bear markets later pushed the index below its birthday l
goTop
quote