


2026 Silver Run: When the Paper Game Collapses and Silver Returns as a Strategic Asset
Preface: A Physical Run on Wall Street
In mid‑January 2026, the silver price broke above $90 per ounce, setting a new all‑time high. On the surface, this looked like a simple risk‑off move alongside gold’s surge to $4,600 and rising geopolitical tensions, but the real story is far more complex than safe‑haven demand.
What is actually unfolding is a structural credit crisis: global institutional investors are abandoning their trust in promises tied to paper silver and are scrambling instead for physical metal. As futures contracts fail to deliver, inventories in London and New York are drained, and lease rates spike to an unprecedented 8 percent, the entire pricing system begins to fracture.
Silver is in the process of being upgraded from an ordinary commodity to a national strategic asset, and its valuation logic is undergoing a complete regime change.
Part I: The Physical Run – A Credit Crisis in the Paper Silver System
Why a Physical Run Happened
For decades, global silver price discovery was firmly controlled by futures traders on the New York COMEX and the London Bullion Market Association (LBMA). Trading volumes in paper silver dwarfed the total stock of above‑ground silver; at one point, the notional ratio reached as high as 356 to 1. In other words, the amount of silver “promised” on paper far exceeded the metal that could ever be delivered.
This system did not collapse only because of one simple assumption: nobody would ask for delivery all at once.
In early 2026, that assumption failed.
Seven Days When the Inventory Vanished
COMEX data tell the story most clearly. Between early and mid‑January, in just seven days, 33.45 million ounces of silver were physically withdrawn for delivery. That meant roughly 26% of COMEX’s registered inventory disappeared in a single week.
Look closer and the picture is even worse. A significant portion of what is reported as “registered” silver is either non‑eligible or already encumbered in some way and thus not truly available for delivery. The pool of actually deliverable, fully eligible silver is much smaller than the headline figures suggest.
As the March contract approached its delivery month, an unusual pattern emerged in the futures market: many traders were no longer willing to calmly wait for March. Instead, they chose to pay up and pull forward their deliveries by several weeks, insisting on taking those silver bars into their own custody as early as possible. This behavior is extremely rare historically. At its core, it sends a clear signal: the market is no longer confident that the exchange will be able to deliver sufficient physical silver when March arrives.
Inventory Stress in London and New York
LBMA is the heart of global spot silver trading. Historical records show that in 2021 the association overstated its silver holdings by some 3,300 tonnes; although this was later explained away as a calculation error, it left a deep scar on market confidence. By 2025, LBMA’s eligible silver stocks had shrunk to only about 155 million ounces (4,821 tonnes), while floating annual demand was running at 900 million to 1.2 billion ounces.
The more telling indicator is the lease rate. Silver leasing allows central banks and large institutions to lend out metal for a yield. In years of ample supply, one‑month silver lease rates typically sit around 0.3% to 0.5%. By January 2026, this rate had exploded to around 8%.
Why? Because the market is short of silver to a clearly abnormal degree. When someone is willing to pay 8% annualized just to borrow silver so they can be sure to take delivery on time, that in itself is a signal: physical supply and demand are severely out of balance. Under normal conditions, no rational borrower would accept such an expensive cost of borrowing.
These elevated lease rates almost completely crush cross‑market arbitrage opportunities and, at the same time, send a blunt message through prices to everyone without metal in hand: even if you feel it’s expensive, you still have to chase it, because having no silver is more lethal than silver being too expensive.
The futures term structure tells the same story from another angle. In normal markets, longer‑dated futures trade at a slight premium to near‑term contracts, reflecting storage, insurance, and financing costs. Starting in late 2025, the silver curve flipped: nearby contracts became more expensive than deferred ones – a condition known as backwardation.
When the futures market falls into deep backwardation, the message is crystal clear: silver you can take delivery of right now is far more valuable than silver promised months in the future. What the market lacks is not paper claims on future silver, but metal that can be loaded onto a truck today.
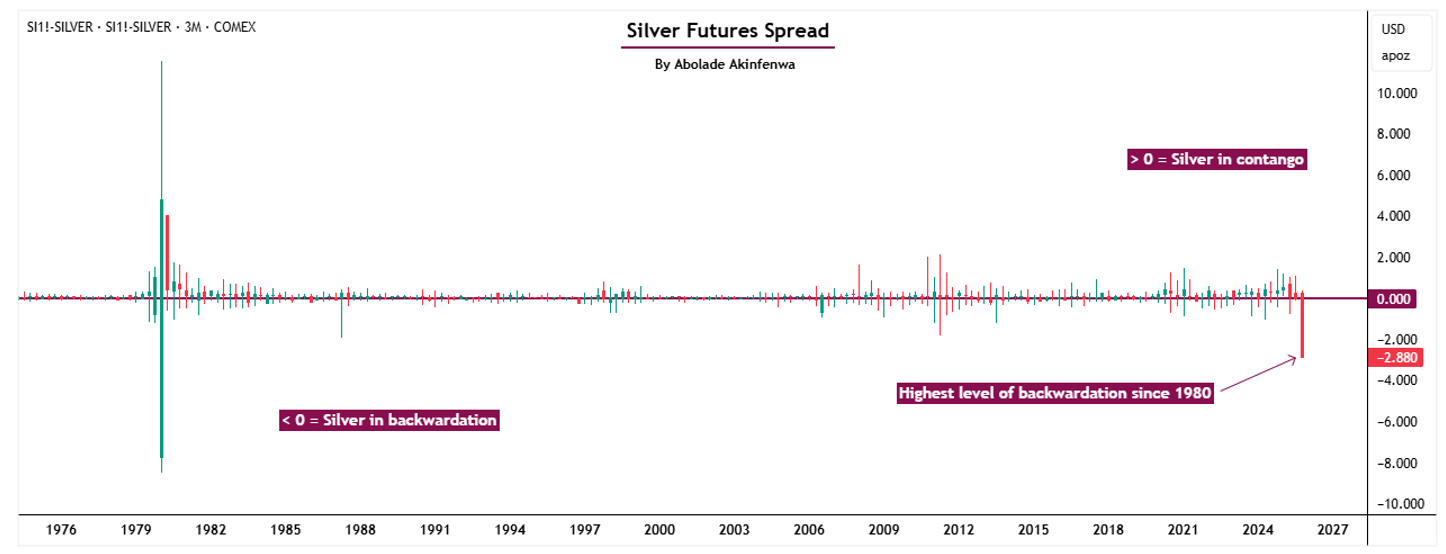
Source: Investing.com
Psychologically, this price pattern is equivalent to the market telling every participant: “I’m not sure there will be enough silver to hand over in three months’ time.”
Geopolitics as the Spark
In early 2026, the U.S. escalated military operations in Venezuela, igniting global risk aversion. Gold broke through $4,600 and silver spiked in tandem. But that is just the surface‑level narrative. Fundamentally, geopolitics was the trigger, not the driver. The real engine was a fact institutions had already internalized: in times of uncertainty, only physical assets can be trusted.
Geopolitical turmoil means SWIFT transfers can be blocked, accounts can be frozen, and central‑bank assets can be confiscated – as Russia’s frozen gold reserves so clearly demonstrated. Against that backdrop, who still wants to rely on an LBMA warehouse receipt? As institutions began to insist on physical delivery, what looked like a reasonable request exposed a systemic problem: the metal simply isn’t there in sufficient quantity.
The Endgame for Paper Silver Credit
Once more and more holders simultaneously demand to convert paper silver into physical, COMEX in New York and LBMA in London effectively face only two choices: either grit their teeth and deliver eligible bars one by one out of whatever inventory remains, or – when real metal runs short or vaults no longer wish to ship – switch to various forms of cash settlement, closing out contracts in dollars rather than handing over silver.
From that moment, their status as core hubs of physical silver price discovery begins to erode. The more frequently they default to cash instead of metal, the more the market treats their quotes as financial prices rather than true prices for physical silver.
That means New York and London futures and benchmark prices will no longer be the only anchors. Markets where physical demand is stronger, local premiums are higher, and prices better reflect real‑world cash trades – such as Shanghai, Hong Kong, and other Asian hubs – will gradually build out an alternative pricing network that competes with the dollar‑centric system.
This is precisely the scenario Wall Street fears most: once price leadership slips away from New York and London’s highly leveraged, dollar‑denominated paper system and is pulled toward markets that care more about physical supply and demand, the price‑control power they once maintained through leverage and derivatives will quietly, but steadily, weaken.
Part II: China’s Export Red Line – A Structural Cut in the Supply Chain
The Policy Shock of 1 January 2026
On 1 January 2026, the Chinese government officially implemented a new export‑control regime on silver. This was not a minor quota tweak; it was a reclassification of silver from an ordinary commodity to a strategic material, placing it in the same category as rare earths.
From that date, silver exports require government licenses. Licenses are granted only to 44 firms, and these firms must meet strict criteria: annual refined output of at least 80 tonnes, credit lines above $30 million, plus scrutiny at the national level.
How big is the impact? China is the world’s dominant refining hub for silver, with its exports accounting for an estimated 60% to 70% of global refined silver exports. Put simply, the fate of the global silver market now rests largely in the hands of Chinese policymakers.
Why China Is Doing This
The official narrative is about strategic reserves and industrial security, but the deeper logic is more interesting. China needs silver for three main reasons.
First is solar. China is the global leader in photovoltaics (PV). Roughly half of all new solar capacity added worldwide in 2024 was installed in China, making it by far the largest market. Each standard PV module uses about 15 to 20 grams of silver paste – roughly 0.5 to 0.7 ounces – for current‑collecting fingers and busbars. As the world accelerates its clean‑energy transition, Beijing wants to ensure that its solar industry is never throttled by a shortage of silver.
Second is electric vehicles. China has the largest EV market in the world, and EVs consume about 67% to 79% more silver per vehicle than internal‑combustion cars, due to more complex control systems and power electronics. The government clearly does not want its future EV industry to depend on imported silver.
Third is electronics and nuclear power. AI data centers, 5G infrastructure, semiconductor packaging, advanced chip design – these are all strategic high grounds China is determined to occupy. Silver is a critical material across all of these sectors and cannot be fully replaced by other substances.
In short, China is making sure that this strategic material is prioritized for domestic use rather than left to the whims of global markets.
From Globalized Supply to Regional Islands
China’s export controls have effectively transformed the global silver market from a largely integrated system into a set of regional silos.
London and Zurich used to be the traditional hubs for global spot silver trading and clearing. But as China tightens exports and prioritizes its own industrial demand, flows of physical metal into these Western centers have visibly diminished. At the same time, visible silver inventories in Shanghai have fallen to their lowest levels since 2016, indicating that even within Asia, stocks are becoming tight.
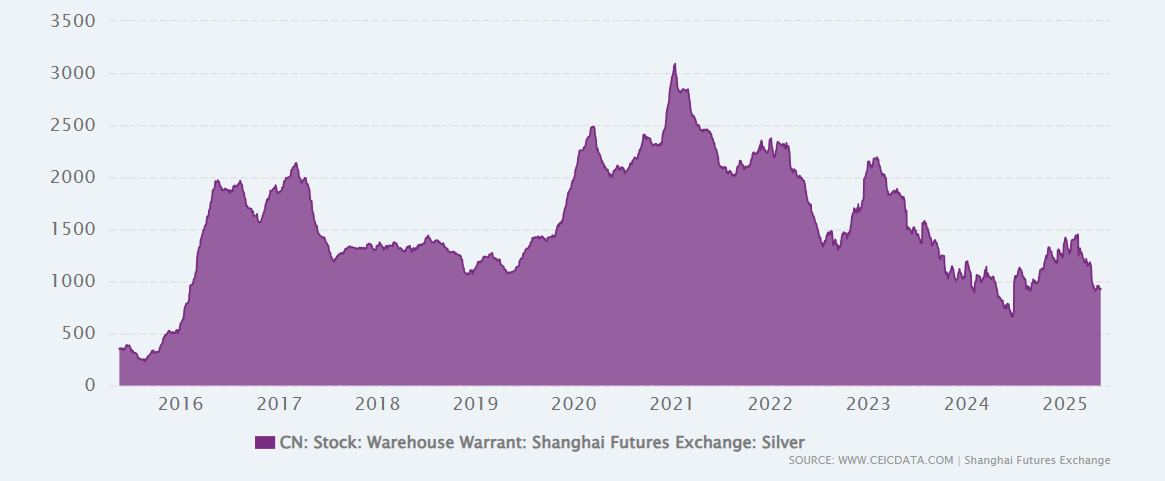
Source: CEIC Data
In parallel, Shanghai spot silver has at times traded at a premium of nearly 10% over COMEX futures. A price gap this large and persistent is extremely rare in recent years and clearly signals acute tension in Asia’s physical market. Under normal circumstances, arbitrageurs would buy cheaper silver in New York or London and ship it to high‑priced markets like Shanghai, compressing the spread. But under the current conditions – tight inventories and export constraints – the quantity of silver that can actually be moved is very limited, and arbitrage cannot fully do its job.
Meanwhile, London and New York’s own spot markets are also under pressure. To attract sufficient bars from other regions, they have had to sharply raise lease rates. Implied lease costs have recently surged to around 7% to 8% or more. Once such rents, plus freight and insurance, are taken into account, trans‑ocean shipments to refill London’s inventories cease to be profitable.
In practice, the global silver market has split into three islands: Asia (primarily China and India), North America (centered on COMEX), and Europe (centered on LBMA). Each region is fighting over whatever metal it can control.
An Arms Race in Industrial Demand
China’s decision is, in effect, a public acknowledgment that the world has entered an era of silver scarcity. Since 2021, the global silver market has run in deficit for five consecutive years. Industry estimates suggest cumulative shortfalls of roughly 820 million ounces between 2021 and 2025 – nearly equivalent to a full year of mine production.
Those missing ounces have been drained by a combination of industrial and investment demand: on one side, PV, EVs, and electronics steadily consume silver; on the other, global investors, ETFs, and some central banks are buying physical metal as a reserve asset. The result is that above‑ground stocks in exchange warehouses, bank vaults, and private hoards are being moved around and gradually drawn down.
Now, by restricting exports, China is effectively saying: the rest of the world can no longer rely on Chinese refined silver to plug its deficits. From 2026 onward, the structural shortages that were previously papered over by drawing down above‑ground inventories are evolving into an overt supply crisis that can no longer be masked.
Part III: De‑Dollarization’s Second Front – Central Banks Discover Silver
The Old Order Breaks
For seventy years, the rule of the game was simple: central banks buy gold, not silver. Between 2022 and 2025, global central banks bought more than 1,000 tonnes of gold per year, while showing almost no interest in silver. The logic was straightforward: gold is the ultimate monetary reserve and symbol of power; silver is poor man’s gold, mainly an industrial metal.
In early 2026, that logic began to crack.
Russia moved first. Under Western sanctions, the Russian central bank started searching for assets that could withstand U.S. financial coercion. Gold was the obvious choice, but Russia already owns large gold reserves and further buying could draw intense scrutiny. Silver, by contrast, is being rediscovered for its strategic value: it has hard industrial demand (energy transition, defense, electronics) and still retains monetary characteristics (scarcity, resistance to debasement). The Russian central bank began allocating capital to silver with the intention of adding it to its strategic reserves.
India followed its own, highly practical logic. Over the last five years, India has acquired more than 900 million ounces of silver through government purchases, corporate stockpiling, and household investment – exceeding reported LBMA holdings over the same period. For a populous, fast‑growing country, gold is too expensive; silver is cheaper and has concrete uses in solar, electronics, and defense. For India, silver straddles both roles: a reserve asset and a strategic industrial input.
Saudi Arabia is another notable player. As the world’s largest oil exporter, Saudi is gradually reducing its dependence on the dollar‑based oil system. It has begun accumulating silver via ETFs, not for quick speculation but to build a store of value that is harder for the West to freeze and is backed by real utility.
The Shadow Buying of Silent Central Banks
There is also a quieter layer to this story that Western media finds harder to track. Some emerging‑market central banks have started shadow buying – acquiring silver via third‑party entities, sovereign funds, or non‑transparent channels rather than through formally announced reserve programs. The advantage is obvious: they avoid headlines while quietly building strategic stockpiles.
Rough estimates suggest that from the second half of 2025 into early 2026, emerging‑market central banks may have acquired several hundred million ounces of silver via such routes.
Silver as a New Medium of Barter
A central question in the de‑dollarization push is: how do you settle international trade without using the dollar? Gold is an obvious candidate, but it is very expensive; not every country can realistically settle large volumes of trade in gold. Silver, however, is much cheaper per unit and simultaneously has real industrial demand, meaning it cannot be fully virtualized or replaced by pure digital tokens.
This is why silver is increasingly discussed as a potential foundational asset in a future BRICS+ monetary system. While the exact design of any new BRICS unit has not been made public, many analysts speculate a basket structure – for example, 40% gold and 60% BRICS currencies. At the more practical level of bilateral barter trade, silver could emerge as a preferred settlement metal.
Imagine the following: Russia exports oil to China and gets paid in silver; India ships manufactured goods to African countries and receives silver in return; that same silver can then be used to pay for other commodity imports or be added to national reserves. In such a framework, silver’s value is no longer determined purely by financial markets but by the concrete needs of global trade.
A Nuclear Shift in Valuation Logic
Once silver is firmly established as a central‑bank reserve asset, its valuation logic changes fundamentally.
Today, silver pricing is still dominated by industrial demand, which accounts for roughly 50–60% of total usage. When forecasting silver, analysts model growth in solar capacity, EV sales, smartphone shipments, and so on. But once central banks begin to accumulate silver on a large scale, the narrative changes: silver is treated as a scarce financial asset rather than just a commodity.
The gold‑silver ratio becomes the key anchor. With a 2026 gold target around $5,000 per ounce, if the gold‑silver ratio only reverts toward its longer‑term band of 55–65:1, silver would be fairly valued around $75–90 per ounce. Yet history has seen brief, extreme bull phases where the ratio compressed to 15–20:1. Should such an extreme re‑rating play out again, silver could in theory trade in the $250–330 range.
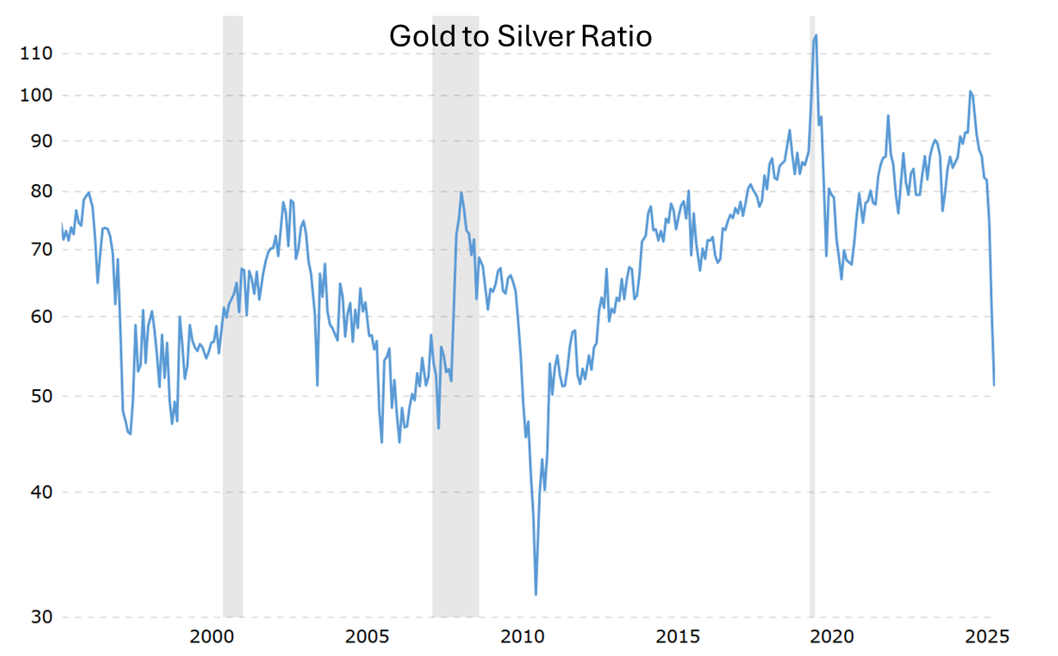
Source: Macrotrends
To push the ratio into that kind of extreme territory, speculative flows alone are rarely enough. It usually takes a deep pool of long‑term, relatively price‑insensitive buying – like that of central banks – steadily accumulating metal over many years to underpin such a shift.
Part IV: The Strategic Nuclear Restart – The Overlooked Silver Vacuum
The Power Crisis of the AI Era
Few people want to confront an awkward question: while the world builds out AI data centers, who is going to supply the power?
Solar and wind are great, but they have a fatal flaw: intermittency. In practice, solar delivers about six full‑load hours per day and wind roughly nine; AI data centers need electricity 24 hours a day, seven days a week. Backup batteries? Far too expensive for multi‑gigawatt‑scale storage, and current technology cannot store enough energy for days on end. Fossil fuels? They break climate pledges and risk being shunned by ESG‑driven capital.
Right now, the only technology that can simultaneously meet all three constraints – round‑the‑clock, large‑scale, low‑carbon – and that has decades of commercial operating history is nuclear power.
The International Energy Agency’s latest projections suggest that by 2030, global data‑center demand will roughly double to more than 200 gigawatts. The U.S. alone may need 100–130 gigawatts of data‑center capacity, far beyond current supply. To fill an 80‑gigawatt gap with low‑carbon baseload, nuclear is one of the few options that can be scaled without igniting an immediate political firestorm.
Big Tech’s Nuclear Arms Race
On 9 January 2026, Meta announced three major nuclear power deals totaling 6.6 gigawatts of contracted capacity through 2035. Counterparties include advanced‑reactor companies such as TerraPower and Oklo. Meanwhile, Microsoft, Amazon, and Google signed over 10 gigawatts of long‑term nuclear power purchase agreements between 2024 and 2025.
These are not PR stunts. Meta and Google need guaranteed power for their AI training clusters, and traditional grids cannot credibly provide it. So they are signing 20‑ to 30‑year contracts directly with nuclear operators and are willing to pay a premium to lock in that certainty.
The U.S. government is moving in parallel. In 2025, the Department of Energy launched a reactor pilot program aiming to bring at least three small modular reactors (SMRs) to criticality at commercial sites by 4 July 2026. Ten companies are participating, including Oklo, Terrestrial Energy, and Radiant – all working on SMRs and advanced concepts. The new Trump administration has gone further, issuing executive orders that target a four‑fold expansion of U.S. nuclear capacity by 2050, from roughly 100 gigawatts today to around 400 gigawatts.
At the same time, analysts at Goldman Sachs have estimated that if nuclear were to cover the entire incremental power demand from data centers between 2023 and 2030, the world would theoretically need to add about 85–90 gigawatts of new nuclear capacity – roughly equivalent to 60–90 large reactors.
The Global Nuclear Revival
This is not just an American story. China has approved around ten new reactor units per year for two years in a row and in early 2024 green‑lit additional projects at Taipingling and Jinji Men, some of which are expected to start construction or come online around 2026. India, Turkey, and Poland are also pushing nuclear plans forward. BloombergNEF estimates that 15 new reactors will start construction worldwide in 2026, adding about 12 gigawatts of capacity.
The European Union is moving as well. The European Commission plans to release an official SMR strategy in the first half of 2026 to lay the groundwork for a decade of large‑scale deployment.
In short, the world is entering a new era of nuclear revival – one that is resonating with AI, the clean‑energy transition, and geopolitical competition.
The Silver Secret Inside Reactors
Here is the overlooked detail: nuclear reactors consume significant amounts of silver.
In today’s light‑water reactors, especially pressurized‑water reactors (PWRs), one of the most common control‑rod materials is an alloy of silver‑indium‑cadmium, typically around 80% silver, 15% indium, and 5% cadmium. These rods act as neutron sponges inserted into the core: during normal operation they finely regulate reaction rates, and in emergencies they drop into the core to rapidly absorb neutrons and quench the chain reaction.
This alloy is widely used because silver, indium, and cadmium have very high capture cross‑sections for thermal neutrons over a broad energy range, while the alloy itself has good mechanical strength and workability. Encapsulated in stainless‑steel cladding, it can operate for long periods in a high‑temperature, high‑radiation, corrosive coolant environment.
A typical large reactor contains on the order of 56,000 ounces of silver (about 1.74 tonnes) in its control rods. This is not optional and not easily substituted; it is a hard requirement for the plant.
The 2026–2035 Silver Demand Black Hole
Now consider a simple calculation. If the world builds 60–90 new large reactors by 2030, and each requires about 1.74 tonnes of silver, that implies 104–156 tonnes of new silver demand – just for initial control‑rod loading. Add to that a growing fleet of SMRs (more numerous, smaller per unit, but potentially quite silver‑dense) plus periodic replacement and refurbishment of control rods in existing reactors over lifetimes that can stretch from 60 years toward 80, and cumulative demand easily reaches into the multi‑million‑ounce range.
This demand has been badly undercounted in earlier silver‑market forecasts. Why? Because for the last two decades, nuclear projects in many countries moved slowly and approvals could take ten years or more. As a result, when analysts broke down industrial silver demand, they would model PV, autos, and electronics in detail but rarely isolate “nuclear‑reactor related silver demand” as a variable capable of explosive growth.
Now that assumption is broken.
The Nuclear–AI–Solar Triangle
More importantly, the three drivers – nuclear, AI, and solar – reinforce each other. AI needs power, and that power increasingly comes from nuclear baseload and massive solar farms. Solar manufacturing consumes silver, and reactor control rods also require silver. Electric vehicles, whose future volumes are heavily shaped by AI‑driven supply chains and smart‑mobility ecosystems, likewise use more silver than conventional cars.
The result is a lock‑in effect: as the world pours hundreds of billions of dollars into AI infrastructure, clean‑energy grids, and nuclear capacity, silver demand is being locked onto a long‑term, persistent, and difficult‑to‑substitute trajectory.
Taken together, we can now see the full picture. The 2026 silver spike is not the result of a single factor, but of four structural forces hitting at the same time.
First, the physical run. The credit of the paper‑silver system has fractured, and institutions are demanding delivery. This undermines the futures market’s long‑held dominance over price discovery and shifts emphasis back to the spot market.
Second, China’s export controls. Policy has cut off 60–70% of global refined exports, pushing the market from integration to regional fragmentation. London and New York cannot refill stocks; lease rates soar and physical premiums widen.
Third, de‑dollarization and central‑bank buying. Emerging‑market central banks such as those of Russia, India, and Saudi Arabia are adding silver to their strategic reserves, treating it not just as an industrial input but as a monetary asset. This rewires the fundamental valuation logic.
Fourth, nuclear revival and silver demand. To satisfy AI and clean‑energy power needs, the world is rapidly restarting and expanding nuclear capacity, creating a long‑term, underestimated source of silver consumption.
Any one of these forces alone might not be enough to break old highs. Acting together, they create a resonance effect: supply is deliberately constrained by policy, demand is strengthened on multiple fronts, and the traditional pricing mechanism is compromised by a credit crisis. Under these conditions, the rally in silver is less a speculative bubble and more a necessary repricing of its role in the system.
Part V: Supply–Demand Data and Outlook
The Global Demand Structure
Total silver demand in 2025 was about 1.1 billion ounces. Industrial uses – PV, EVs, electronics, nuclear, and traditional applications – accounted for roughly 60%. Investment demand (ETFs, physical bullion, jewelry) ran around 300–400 million ounces. Government and central‑bank accumulation, including shadow purchases, is hard to quantify precisely but is estimated in the 100–200‑million‑ounce per‑year range.
Structural growth momentum is converging in 2026, mainly from three directions.
First is solar. In recent years, PV has consumed close to 300 million ounces annually. As long as global installations do not slam on the brakes, that level – even with continued thrift in silver loading per cell – is likely to become the new normal rather than an exception.
Second is vehicle electrification. By 2026, the auto industry’s annual silver use is approaching 90 million ounces, and pure‑EV penetration is far from peaking. Crossing the 100‑million‑ounce mark is more a matter of time than of debate over direction.
Third is nuclear power and data‑center‑related electrical gear. Today this segment still appears as a small line item in statistics – on the order of a few million ounces – but as new‑builds and life‑extension projects increase, and as grid and switchgear upgrades follow AI data‑center expansion, pushing this category into the tens of millions of ounces over the coming decade is not far‑fetched.
The Global Supply Picture
Silver supply comes from three main sources. Primary mine production currently sits around 810 million ounces per year. Recycling contributes approximately 180–190 million ounces, mostly from industrial scrap and end‑of‑life electronics. Finally, there are above‑ground stocks: silver held in exchange and bank vaults or in private hoards, which can be mobilized when prices are high enough to fill gaps.
Since 2021, the market has been in continuous deficit. Cumulative shortfalls from 2021 to 2025 total roughly 820 million ounces, largely covered by drawing down above‑ground inventories.
The 2026 Deficit
In 2026 the situation becomes more severe. China’s export constraints push effective global supply even lower, and the annual deficit is expected to reach about 200 million ounces. Without new supply channels – such as major new mine projects or a step‑change in recycling technology – this deficit will inevitably squeeze prices higher.
One key dynamic is demand destruction at high prices. Once silver trades above 100 dollars, some industrial users will accelerate substitution. PV manufacturers will push harder to develop low‑silver or silver‑free cells; EV makers will redesign systems to trim silver loadings. But such shifts take time and cannot drastically change the demand structure in the very short run.
Price Outlook
According to recent forecasts from ING, Saxo Bank, Bank of America, and HSBC, the consensus range for 2026 average silver prices is about $55 to $70 per ounce. Given the four structural forces described above – and the increasing geopolitical fragmentation of supply chains – actual prices could overshoot that range.
In a more bullish scenario, several things might happen simultaneously: COMEX and LBMA face an even more intense squeeze, raising fresh doubts about the reality of their inventories and forcing more cash‑settled deliveries; more emerging‑market central banks openly add silver to official or quasi‑official reserves; and the gold‑silver ratio, under the combined pressure of sentiment and policy, compresses from roughly 50:1 toward the historically observed extremes of 15–20:1. In such a case, silver could break above $100 and potentially spike toward $150.
Conclusion: The Era of Silver’s Triple Identity
The early‑2026 surge in silver marks a turning point. Silver is shifting from an industrial metal with some monetary flavor to an asset with three co‑equal identities: industrial input, monetary metal, and strategic material.
In an age when paper silver’s credit is in doubt, only physical silver can be trusted. In an age when China enforces export controls, the global market must learn to live with chronic scarcity. In an age of de‑dollarization, silver is emerging as a building block of alternative monetary systems. In an age of nuclear revival, silver’s industrial demand is locked into a long‑term upward path.
Taken together, these four forces point to one conclusion: silver’s valuation framework has undergone a qualitative shift. Future prices will no longer be dictated solely by simple supply–demand balances, but by the interplay of geopolitics, monetary policy, and strategic reserve decisions.
For investors, this is a chance to understand a new regime. For markets, it is a process of re‑rating an asset that has long been mispriced. For silver itself, it is an identity shift – from “poor man’s gold” to one of the strategic assets of the 21st century.
Recommended Articles


