




1.4000 within reach: USD/CAD consolidates gains after Fed’s hawkish hike
- USD/CAD consolidates gains just below 1.4000, supported by the Fed's hawkish stance.
- The US central bank hiked interest rates on Wednesday and hinted at further monetary tightening ahead.
- Fed's hawkishness increases the monetary policy divergence with the BoC.
The US Dollar (USD) held its ground at one-and-a-half-month highs against the Canadian Dollar (CAD) on Thursday, supported by the Federal Reserve’s (Fed) interest rate hike and the unexpectedly hawkish message from Chairman Kevin Warsh. The USD/CAD pair accelerated its uptrend after the event and is trading a few pips below the 1.4000 psychological level at the European session open.
The Fed confirmed its commitment to fight inflationary pressures on Wednesday and tackled speculation about its independence at the same time, which was welcomed by the market. The US Dollar rallied across the board, with short-term Treasury yields jumping while longer-term ones eased, with the benchmark 10-year yield retreating below the critical 5% level.
As expected, the US central bank raised its benchmark interest rate to the 3.75%-4.0 % range on Wednesday, and Chairman Warsh reaffirmed the bank's commitment to “focus on the price stability side” of the bank's mandate after stating that “inflation is too high and has been for too long”.
These comments prompted investors to price in further interest rate hikes before the end of the year. The CME’s Fed Watch Tool is now pricing a nearly 90% chance of at least one more rate hike this year. The Bank of Canada (BoC), in contrast, is widely expected to leave its monetary policy on hold, at least until the end of the year, amid the uncertain economic scenario stemming from the trade war with the US.
Technical Analysis: The rally might extend to the 1.4160 area
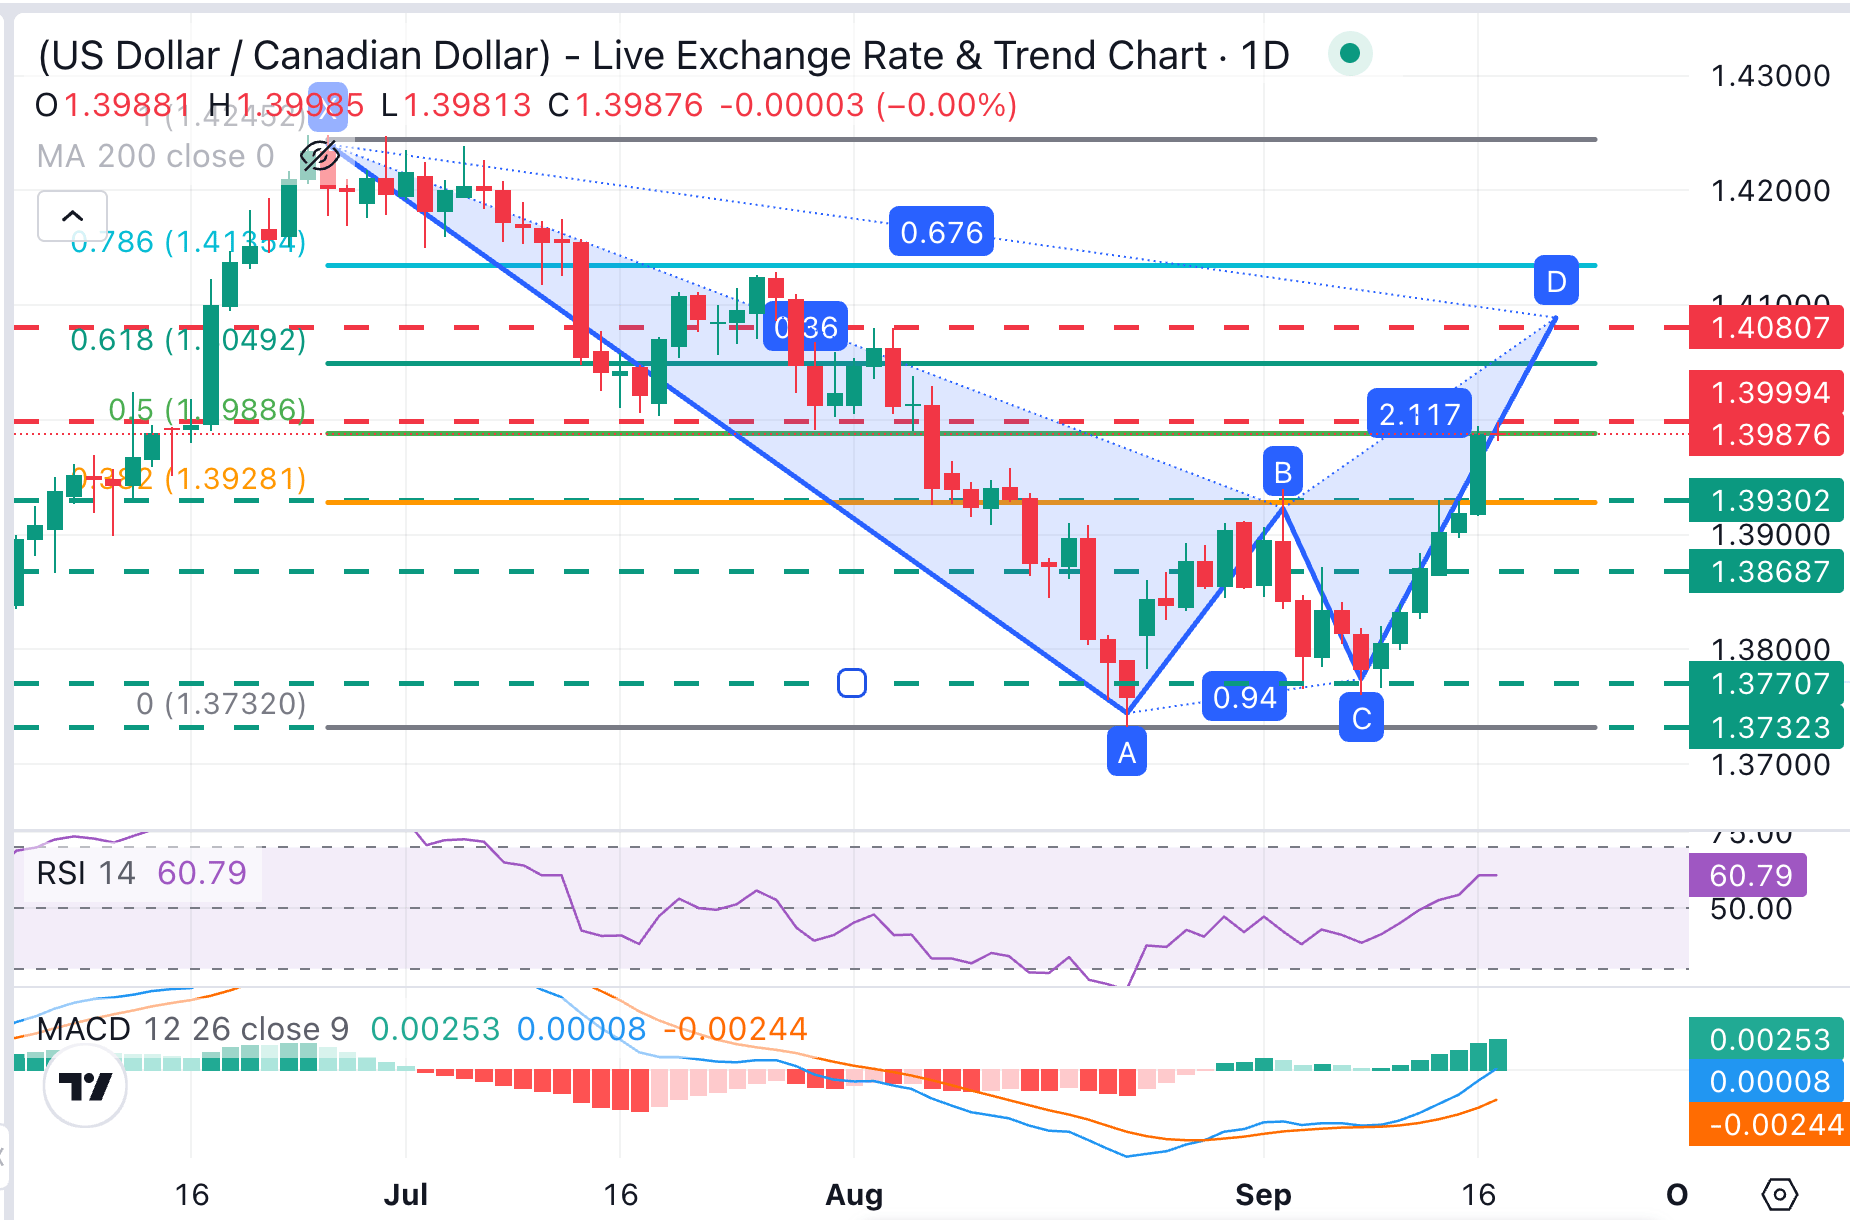
The daily chart shows USD/CAD in a bullish near-term bias after rallying about 1.5% over the last six days, with price action showing a corrective recovery in the shape of a Gartley pattern, with the area between the 61.8% and the 78.6% Fibonacci retracements emerging as a plausible target.
Price is perched just under a tight resistance band formed by the 50% Fibonacci retracement of the July-September decline and a previous support area at 1.4000, but the positive momentum indicators suggest that there is still room for further appreciation. The daily Relative Strength Index (14) is well above the 50 level, while the Moving Average Convergence Divergence (MACD) histogram keeps printing widening green bars, altogether hinting that buyers still have the upper hand.
Above 1.4000, the next targets are the mentioned 61.8% Fibonacci retracement level, in the 1.4050 area, and the early August highs at 1.4080. Downside attempts, on the contrary, are likely to be tested at previous highs around 1.3940 (September 2 highs) and 1.3870 (September 4 high).
(The technical analysis of this story was written with the help of an AI tool. Know more.)
US Dollar Price Today
The table below shows the percentage change of US Dollar (USD) against listed major currencies today. US Dollar was the strongest against the Canadian Dollar.
| USD | EUR | GBP | JPY | CAD | AUD | NZD | CHF | |
|---|---|---|---|---|---|---|---|---|
| USD | -0.12% | -0.07% | -0.44% | 0.00% | -0.36% | -0.41% | -0.22% | |
| EUR | 0.12% | 0.04% | -0.30% | 0.12% | -0.27% | -0.25% | -0.08% | |
| GBP | 0.07% | -0.04% | -0.33% | 0.11% | -0.30% | -0.30% | -0.11% | |
| JPY | 0.44% | 0.30% | 0.33% | 0.38% | 0.07% | 0.00% | 0.19% | |
| CAD | -0.00% | -0.12% | -0.11% | -0.38% | -0.35% | -0.38% | -0.18% | |
| AUD | 0.36% | 0.27% | 0.30% | -0.07% | 0.35% | -0.00% | 0.14% | |
| NZD | 0.41% | 0.25% | 0.30% | -0.00% | 0.38% | 0.00% | 0.22% | |
| CHF | 0.22% | 0.08% | 0.11% | -0.19% | 0.18% | -0.14% | -0.22% |
The heat map shows percentage changes of major currencies against each other. The base currency is picked from the left column, while the quote currency is picked from the top row. For example, if you pick the US Dollar from the left column and move along the horizontal line to the Japanese Yen, the percentage change displayed in the box will represent USD (base)/JPY (quote).
Recommended Articles


