


GBP/USD retreats as Greenback strengthens amid US government shutdown
- GBP/USD tumbles as Greenback gains as US government shutdown drags on, boosting safe-haven demand.
- Fed’s Daly warns of AI-driven market bubble; Miran sees slower growth, neutral rate near 0.5%.
- Rate divergence persists — Fed expected to cut in October, while BoE likely holds policy steady.
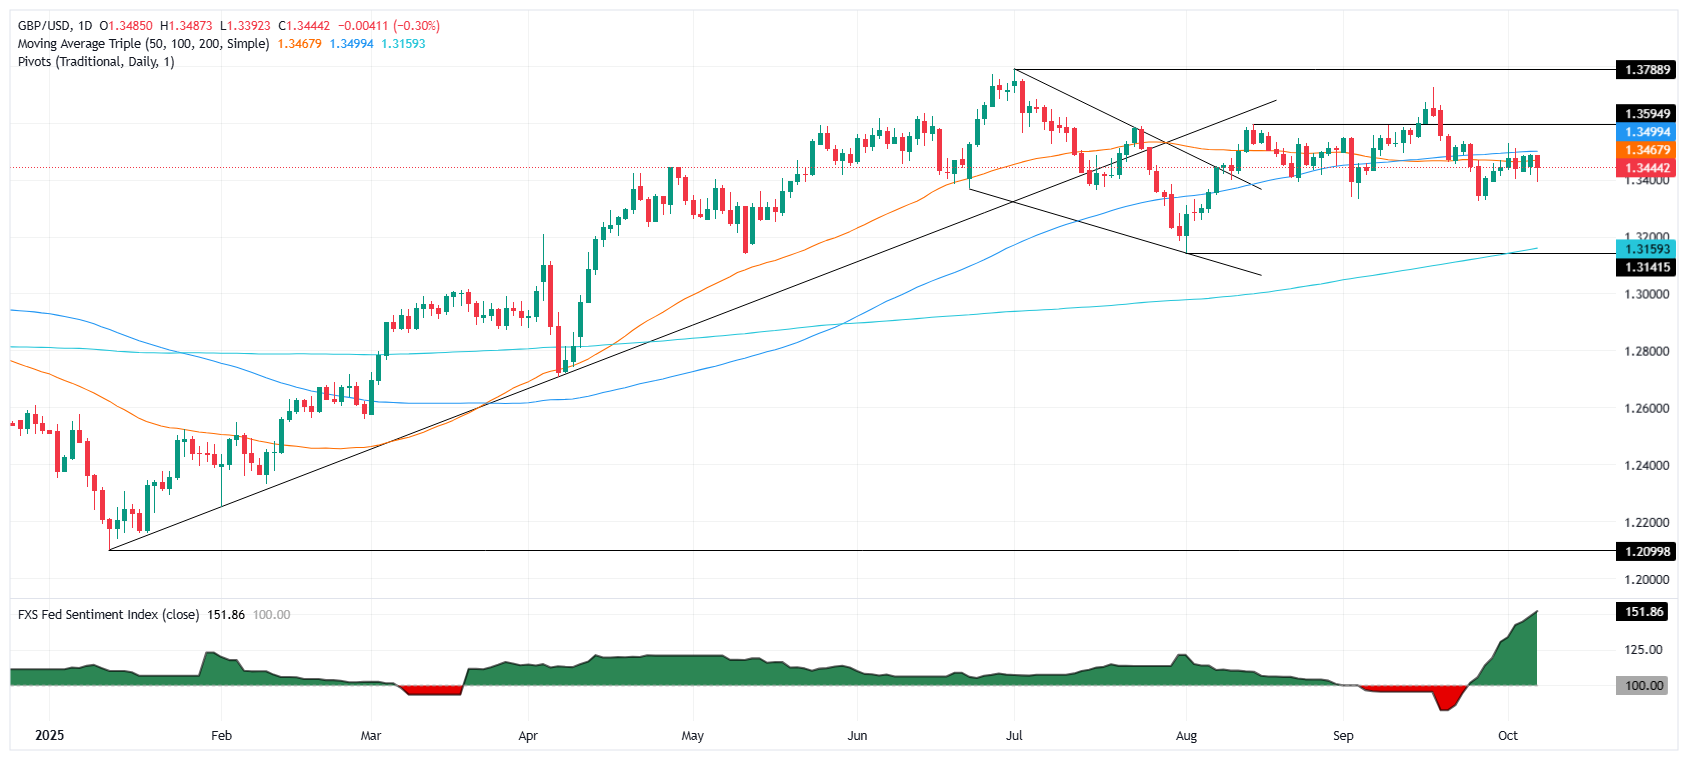
GBP/USD drops during the North American session after failing to clear the 50-day Simple Moving Average (SMA) of 1.3464 as the Greenback registers gains amid the ongoing US government shutdown.
Sterling retreats below 1.3450 after failing to clear key resistance; diverging Fed–BoE outlooks cap downside risks
The economic docket in both sides of the Atlantic remains scarce, yet Federal Reserve officials are grabbing traders’ attention. San Francisco Fed Mary Daly said that a potential AI bubble in the stock market would threaten broader financial stability. In the meantime, Atlanta’s Fed Raphael Bostic revealed that turbulence is leading firms and households to be cautious.
Recently, Fed Governor Stephen Miran said that economic growth has been slower in the first half of 2025, amid uncertainty. He added that neutral rate has come down, likely at 0.5%, and added that policy should be forward looking.
The New York Fed Survey of Consumer Expectations showed that inflation expectations rose from 3.1% to 3.2% for one year, while for three and five years, stood unchanged at 3% and 2.9%, respectively.
Across the pond, Bank of England (BoE) Chief Economist Huw Pill would cross the wires on Wednesday, followed by Catherine Mann on Thursday.
Divergence between the Fed and the Bank of England favors further upside in the GBP/USD. Money market traders expect the Fed to cut rates at the October meeting, with odds standing at 94%. The BoE is expected to keep interest rates unchanged, with odds for a 25-bps cut at 10%.
GBP/USD Price Forecast: Technical outlook
The GBP/USD technical picture shows the pair is neutral to downward biased, even though it remains above the 200-day SMA. Nevertheless, a daily close above 1.3500 could sponsor a leg up towards October 1 at 1.3527. A breach of the latter will expose the 1.3600 figure.
Conversely, if GBP/USD drops below 1.3450, the next support would be 1.3400, ahead of September 25 swing low of 1.3323.
Pound Sterling Price This week
The table below shows the percentage change of British Pound (GBP) against listed major currencies this week. British Pound was the strongest against the Japanese Yen.
| USD | EUR | GBP | JPY | CAD | AUD | NZD | CHF | |
|---|---|---|---|---|---|---|---|---|
| USD | 0.41% | 0.03% | 1.12% | -0.06% | -0.00% | 0.25% | 0.08% | |
| EUR | -0.41% | -0.48% | 0.62% | -0.50% | -0.45% | -0.20% | -0.37% | |
| GBP | -0.03% | 0.48% | 1.22% | -0.02% | 0.04% | 0.29% | 0.12% | |
| JPY | -1.12% | -0.62% | -1.22% | -1.12% | -1.15% | -0.92% | -1.07% | |
| CAD | 0.06% | 0.50% | 0.02% | 1.12% | 0.10% | 0.32% | 0.14% | |
| AUD | 0.00% | 0.45% | -0.04% | 1.15% | -0.10% | 0.25% | 0.09% | |
| NZD | -0.25% | 0.20% | -0.29% | 0.92% | -0.32% | -0.25% | -0.17% | |
| CHF | -0.08% | 0.37% | -0.12% | 1.07% | -0.14% | -0.09% | 0.17% |
The heat map shows percentage changes of major currencies against each other. The base currency is picked from the left column, while the quote currency is picked from the top row. For example, if you pick the British Pound from the left column and move along the horizontal line to the US Dollar, the percentage change displayed in the box will represent GBP (base)/USD (quote).
Recommended Articles


