
GBP/USD extends winning streak as US shutdown fears hit Dollar
- Cable climbs above 1.3460 as US budget gridlock sparks worries of shutdown disrupting key economic data releases.
- US Job Openings rise to 7.23 million, while Conference Board Consumer Confidence dips below expectations.
- UK GDP growth beats forecasts at 1.4% YoY, but Sterling strength mainly fueled by broad-based Dollar weakness.
Cable extended its gains for three straight days on Tuesday, edges up 0.20% spurred by investors selling off the Dollar amid fears of a US government shutdown. The GBP/USD trades at 1.3461 at the time of writing.
Sterling gains for third day as political deadlock in Washington drives Dollar sell-off
The lack of progress between the White House and Democratic leaders to fund the US government keeps traders anxious due to concerns that a shutdown might disrupt the release of economic data, like the Nonfarm Payroll figures, set to be announced on October 3.
Job openings in the US remained steady in August, as vacancies ticked up from 7.21 million in July to 7.23 million, exceeding estimates of 7.2 million. At the same time, the Conference Board (CB) revealed that Consumer Confidence missed estimates of 96.0, dipped from 97.6 in August to 94.2 this month.
The senior economist of the CB Stephanie Guichard commented that consumers’ assessment of business conditions deteriorated, while availability for jobs fell for the ninth consecutive month.
UK Gross Domestic Product (GDP) for the second quarter expanded by 1.4% YoY above the consensus and the previous print of 1.2%. The data failed to prop Sterling, which mainly benefited from overall US Dollar weakness.
Despite this, the GBP/USD is poised to end the month with losses of 0.40%, but central bank divergence suggests that the pair could resume its uptrend in the near term.
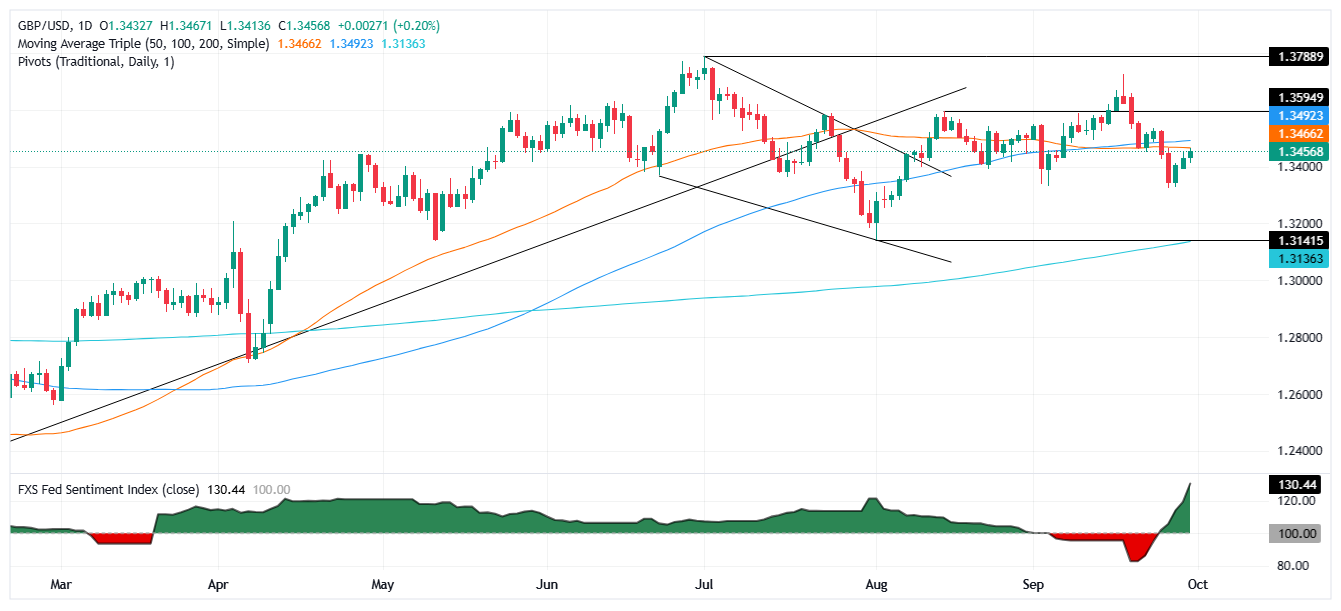
GBP/USD Price Forecast: To consolidate around 1.3300 – 1.3450
The technical picture indicates that GBP/USD trades within the 1.3300-1.3450 range for the last three days, below the confluence of the 50, 100 and 20-day Simple Moving Averages (SMAs) at around 1.3463, 1.3488 and 1.3504.
Although the Relative Strength Index (RSI) is bearish, it continues to trend up towards the RSI’s neutral level. Hence, buyers seem to gather some steam, in the short term.
If GBP/USD rises above 1.3500, the next resistance would be 1.3550 and 1.3600. Conversely, if the pair tumbles below 1.3400, the next area of interest would be 1.3323, the September 25 swing low.
Pound Sterling Price This Month
The table below shows the percentage change of British Pound (GBP) against listed major currencies this month. British Pound was the strongest against the New Zealand Dollar.
| USD | EUR | GBP | JPY | CAD | AUD | NZD | CHF | |
|---|---|---|---|---|---|---|---|---|
| USD | -0.30% | 0.36% | 0.61% | 1.39% | -1.01% | 1.59% | -0.35% | |
| EUR | 0.30% | 0.67% | 0.85% | 1.69% | -0.72% | 1.90% | -0.05% | |
| GBP | -0.36% | -0.67% | 0.08% | 1.02% | -1.37% | 1.23% | -0.66% | |
| JPY | -0.61% | -0.85% | -0.08% | 0.84% | -1.60% | 1.01% | -0.92% | |
| CAD | -1.39% | -1.69% | -1.02% | -0.84% | -2.35% | 0.20% | -1.66% | |
| AUD | 1.01% | 0.72% | 1.37% | 1.60% | 2.35% | 2.64% | 0.71% | |
| NZD | -1.59% | -1.90% | -1.23% | -1.01% | -0.20% | -2.64% | -1.86% | |
| CHF | 0.35% | 0.05% | 0.66% | 0.92% | 1.66% | -0.71% | 1.86% |
The heat map shows percentage changes of major currencies against each other. The base currency is picked from the left column, while the quote currency is picked from the top row. For example, if you pick the British Pound from the left column and move along the horizontal line to the US Dollar, the percentage change displayed in the box will represent GBP (base)/USD (quote).
Recommended Articles


