
XRP Price Slides Under Support Level, Selling Pressure Intensifies


XRP price started a fresh decline below the $2.20 zone. The price is now consolidating losses and might decline further below the $2.150 zone.
XRP price started a fresh decline below the $2.20 zone.
The price is now trading below $2.20 and the 100-hourly Simple Moving Average.
There was a break below a key bullish trend line with support at $2.180 on the hourly chart of the XRP/USD pair (data source from Kraken).
The pair might start another decline if it trades below the $2.120 support zone.
XRP Price Dips Again
XRP price failed to continue higher above the $2.280 level and reacted to the downside, like Bitcoin and Ethereum. The price declined below the $2.250 and $2.220 support levels.
Besides, there was a break below a key bullish trend line with support at $2.180 on the hourly chart of the XRP/USD pair. The pair tested the $2.150 support A low was formed at $2.1425 and the price is now consolidating losses below the 23.6% Fib retracement level of the recent decline from the $2.335 swing high to the $2.145 low.
The price is now trading below $2.220 and the 100-hourly Simple Moving Average. On the upside, the price might face resistance near the $2.1880 level. The first major resistance is near the $2.20 level.
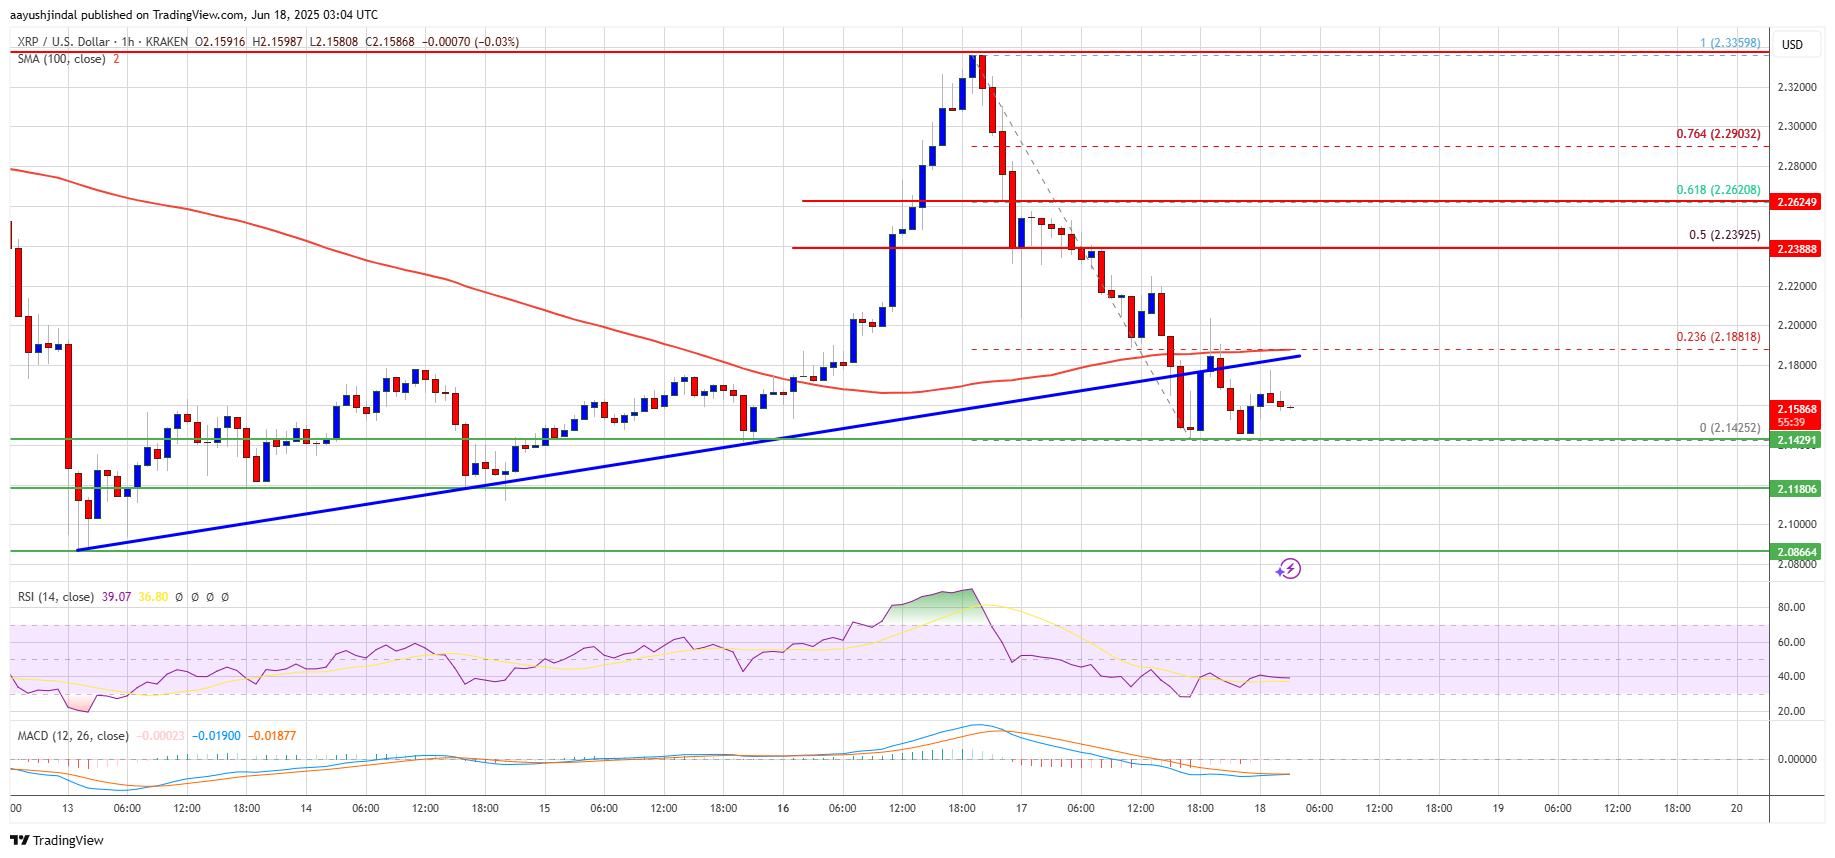
The next resistance is $2.240 or the 50% Fib retracement level of the recent decline from the $2.335 swing high to the $2.145 low. A clear move above the $2.240 resistance might send the price toward the $2.280 resistance. Any more gains might send the price toward the $2.320 resistance or even $2.350 in the near term. The next major hurdle for the bulls might be $2.40.
More Losses?
If XRP fails to clear the $2.220 resistance zone, it could start another decline. Initial support on the downside is near the $2.150 level. The next major support is near the $2.120 level.
If there is a downside break and a close below the $2.120 level, the price might continue to decline toward the $2.050 support. The next major support sits near the $2.020 zone.
Technical Indicators
Hourly MACD – The MACD for XRP/USD is now gaining pace in the bearish zone.
Hourly RSI (Relative Strength Index) – The RSI for XRP/USD is now below the 50 level.
Major Support Levels – $2.150 and $2.120.
Major Resistance Levels – $2.20 and $2.220.
* The content presented above, whether from a third party or not, is considered as general advice only. This article should not be construed as containing investment advice, investment recommendations, an offer of or solicitation for any transactions in financial instruments.


