


Fartcoin, SPX6900 Price Prediction: Meme coins eye further gains amid record-high Open Interests


Fartcoin loses steam as it nears a crucial resistance level at $1.56 that has remained intact since late January.
SPX6900 edges lower after a 12% surge on Wednesday, with bulls aiming to surpass the $1.80 level.
The Open Interest of FARTCOIN and SPX crossed $1 billion and $200 million, respectively, signaling increased interest from traders.
The Solana-based meme coin market capitalization has jumped 6% over the last 24 hours, reaching $14.64 billion, leading the broader cryptocurrency market's recovery. Fartcoin (FARTCOIN) and SPX6900 (SPX), which edged lower after double-digit gains on Wednesday, are among the top performers. Both the derivative data and technical outlook indicate a bullish bias as open interest reaches record high levels and trend momentum increases.
Fartcoin Open Interest hits $1 billion, SPX OI crosses $200 million
Open Interest (OI) refers to the total value of open perpetual derivative contracts, serving as a direct indicator of traders’ interest.
CoinGlass’ data shows that the Fartcoin Open Interest reached a new all-time high of $1.05 billion, up from $802.60 million on Wednesday. The SPX OI also hits a record high of $200 million.
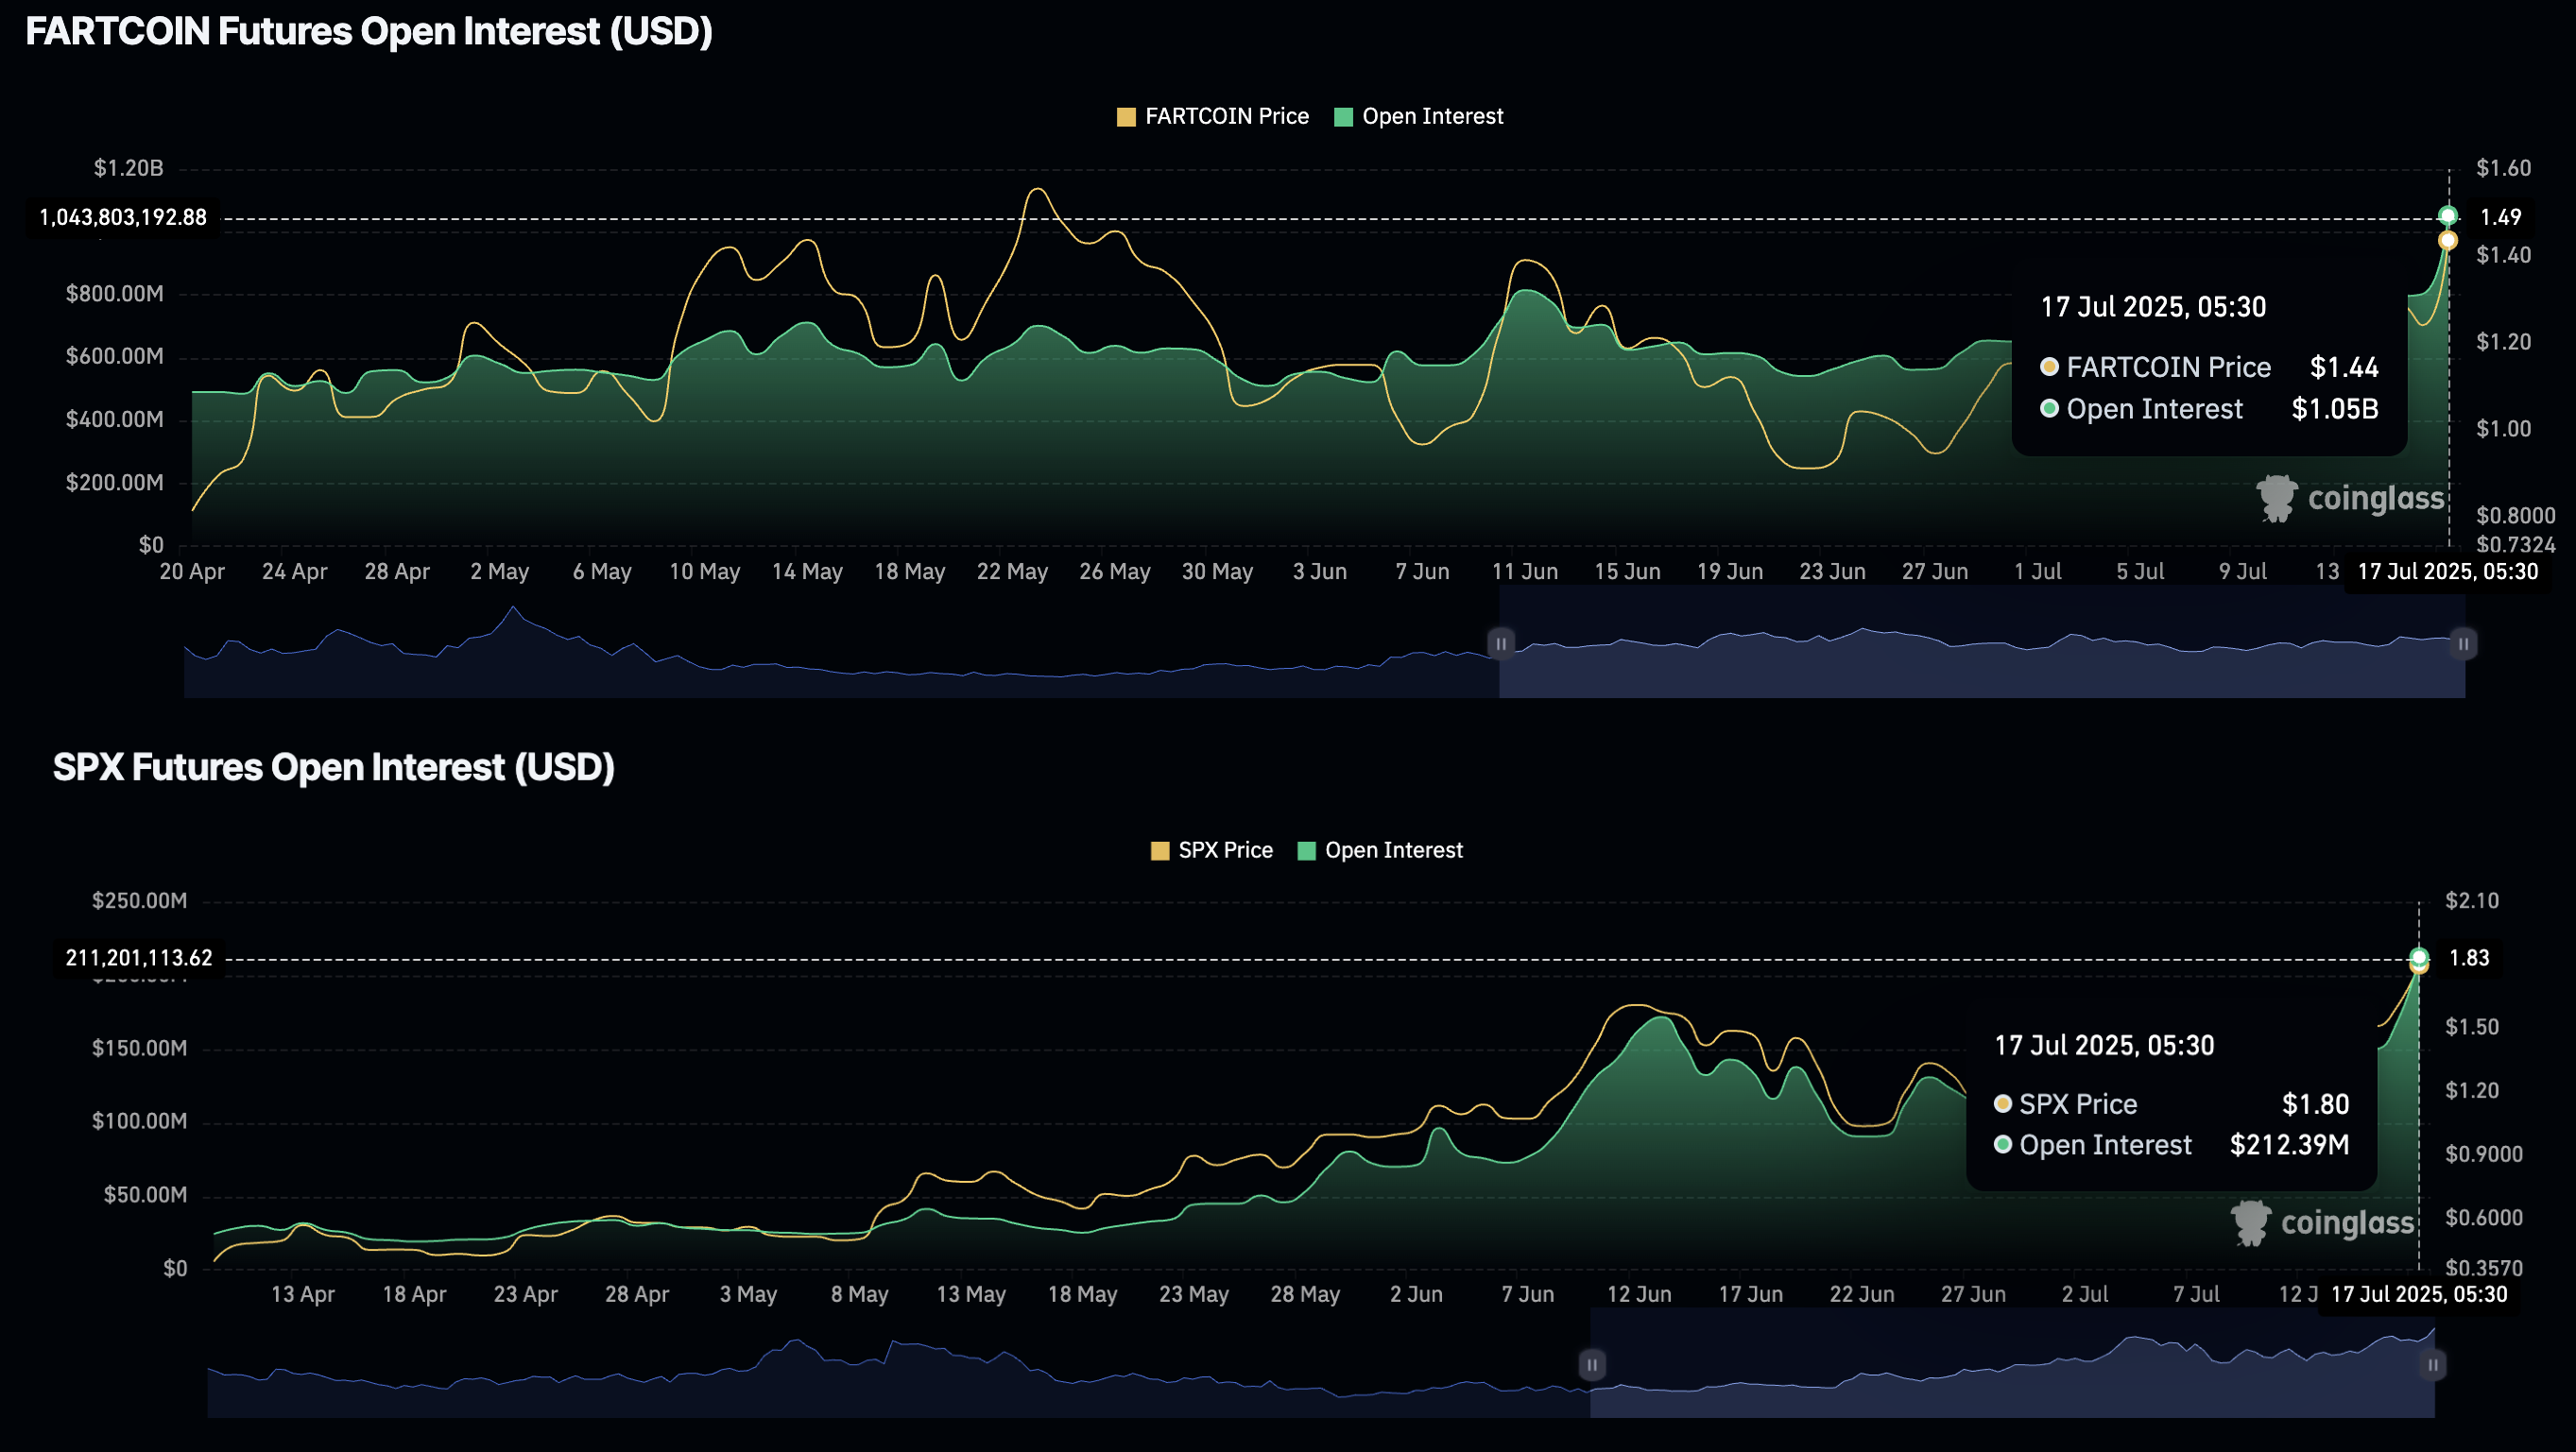
Open Interest. Source: Coinglass
The increasing OI suggests a boost in traders’ interest as the meme coins scale to new swing highs.
FARTCOIN, SPX eye further gains amid increasing bullish momentum
Fartcoin edges lower by 5% at press time on Thursday following a 16% surge on the previous day. The meme coin holds dominion over the 50-day Exponential Moving Average (EMA) and the $1 psychological level.
Fartcoin nears the 78.6% Fibonacci retracement level at $1.56, drawn from the $2.74 peak of January 19 to the low of $0.19 from March 10. A potential daily close above this level could extend the bullish run to the $2.00 round figure.
The Moving Average Convergence/Divergence (MACD) indicator shows a positive trend in MACD and its signal line. Still, the fluctuating green histogram bars suggest increased volatility in trend momentum.
The Relative Strength Index (RSI) stands at 59, indicating a gradual increase in bullish momentum as it surpasses the midpoint. The RSI indicates room for growth before reaching overbought conditions.
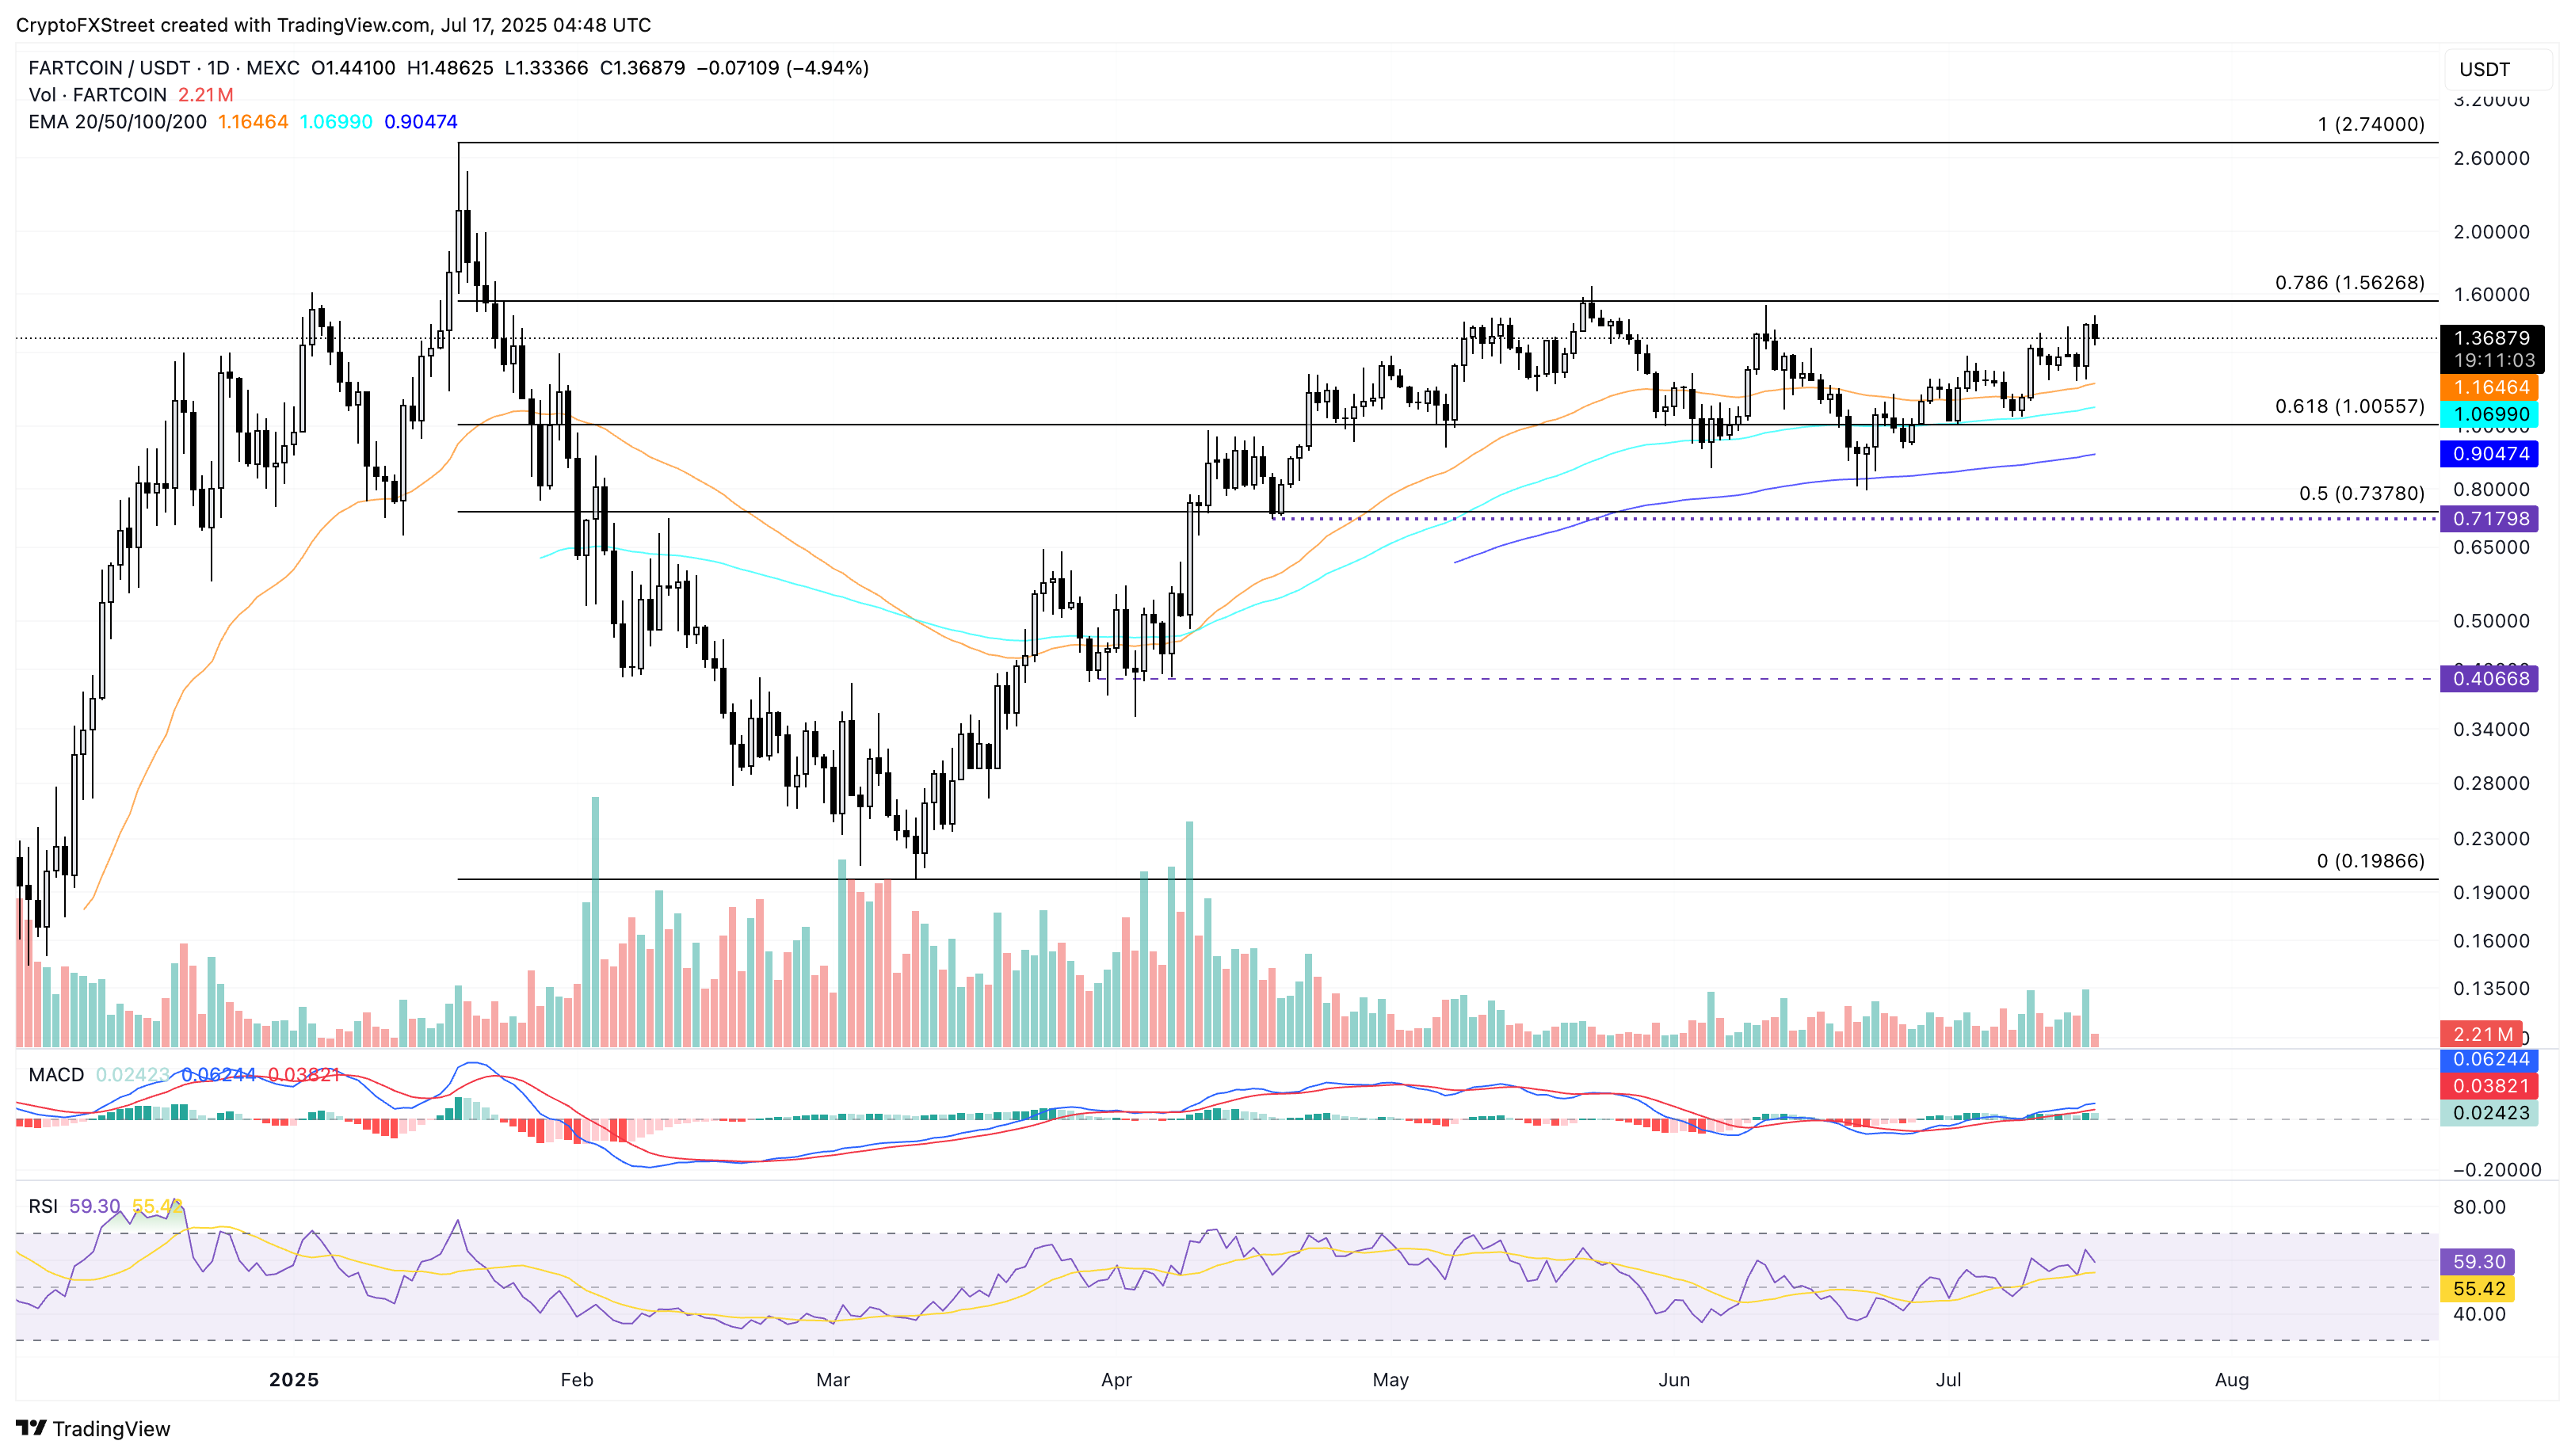
FARTCOIN/USDT daily price chart.
On the other hand, a reversal from the $1.56 resistance, which has remained intact since January 19, could test the 50-day EMA at $1.16.
SPX edges lower by nearly 1% so far on Thursday after reaching a new all-time high of $1.91 with a 12% jump on Wednesday. The meme coin struggles to manage a daily close above the $1.80 level, aligning with the previous all-time high.
A decisive push above $1.80 could stretch the uptrend to the $2.00 round figure, followed by the 1.272 Fibonacci level at $2.22, retraced from the $1.80 high of January 19 to the March 11 low of $0.25.
The momentum indicator maintains a bullish bias, similar to Fartcoin, with the RSI crossing above the halfway line to 67. Meanwhile, the MACD provides a mixed signal, characterized by fluctuating green histogram bars.
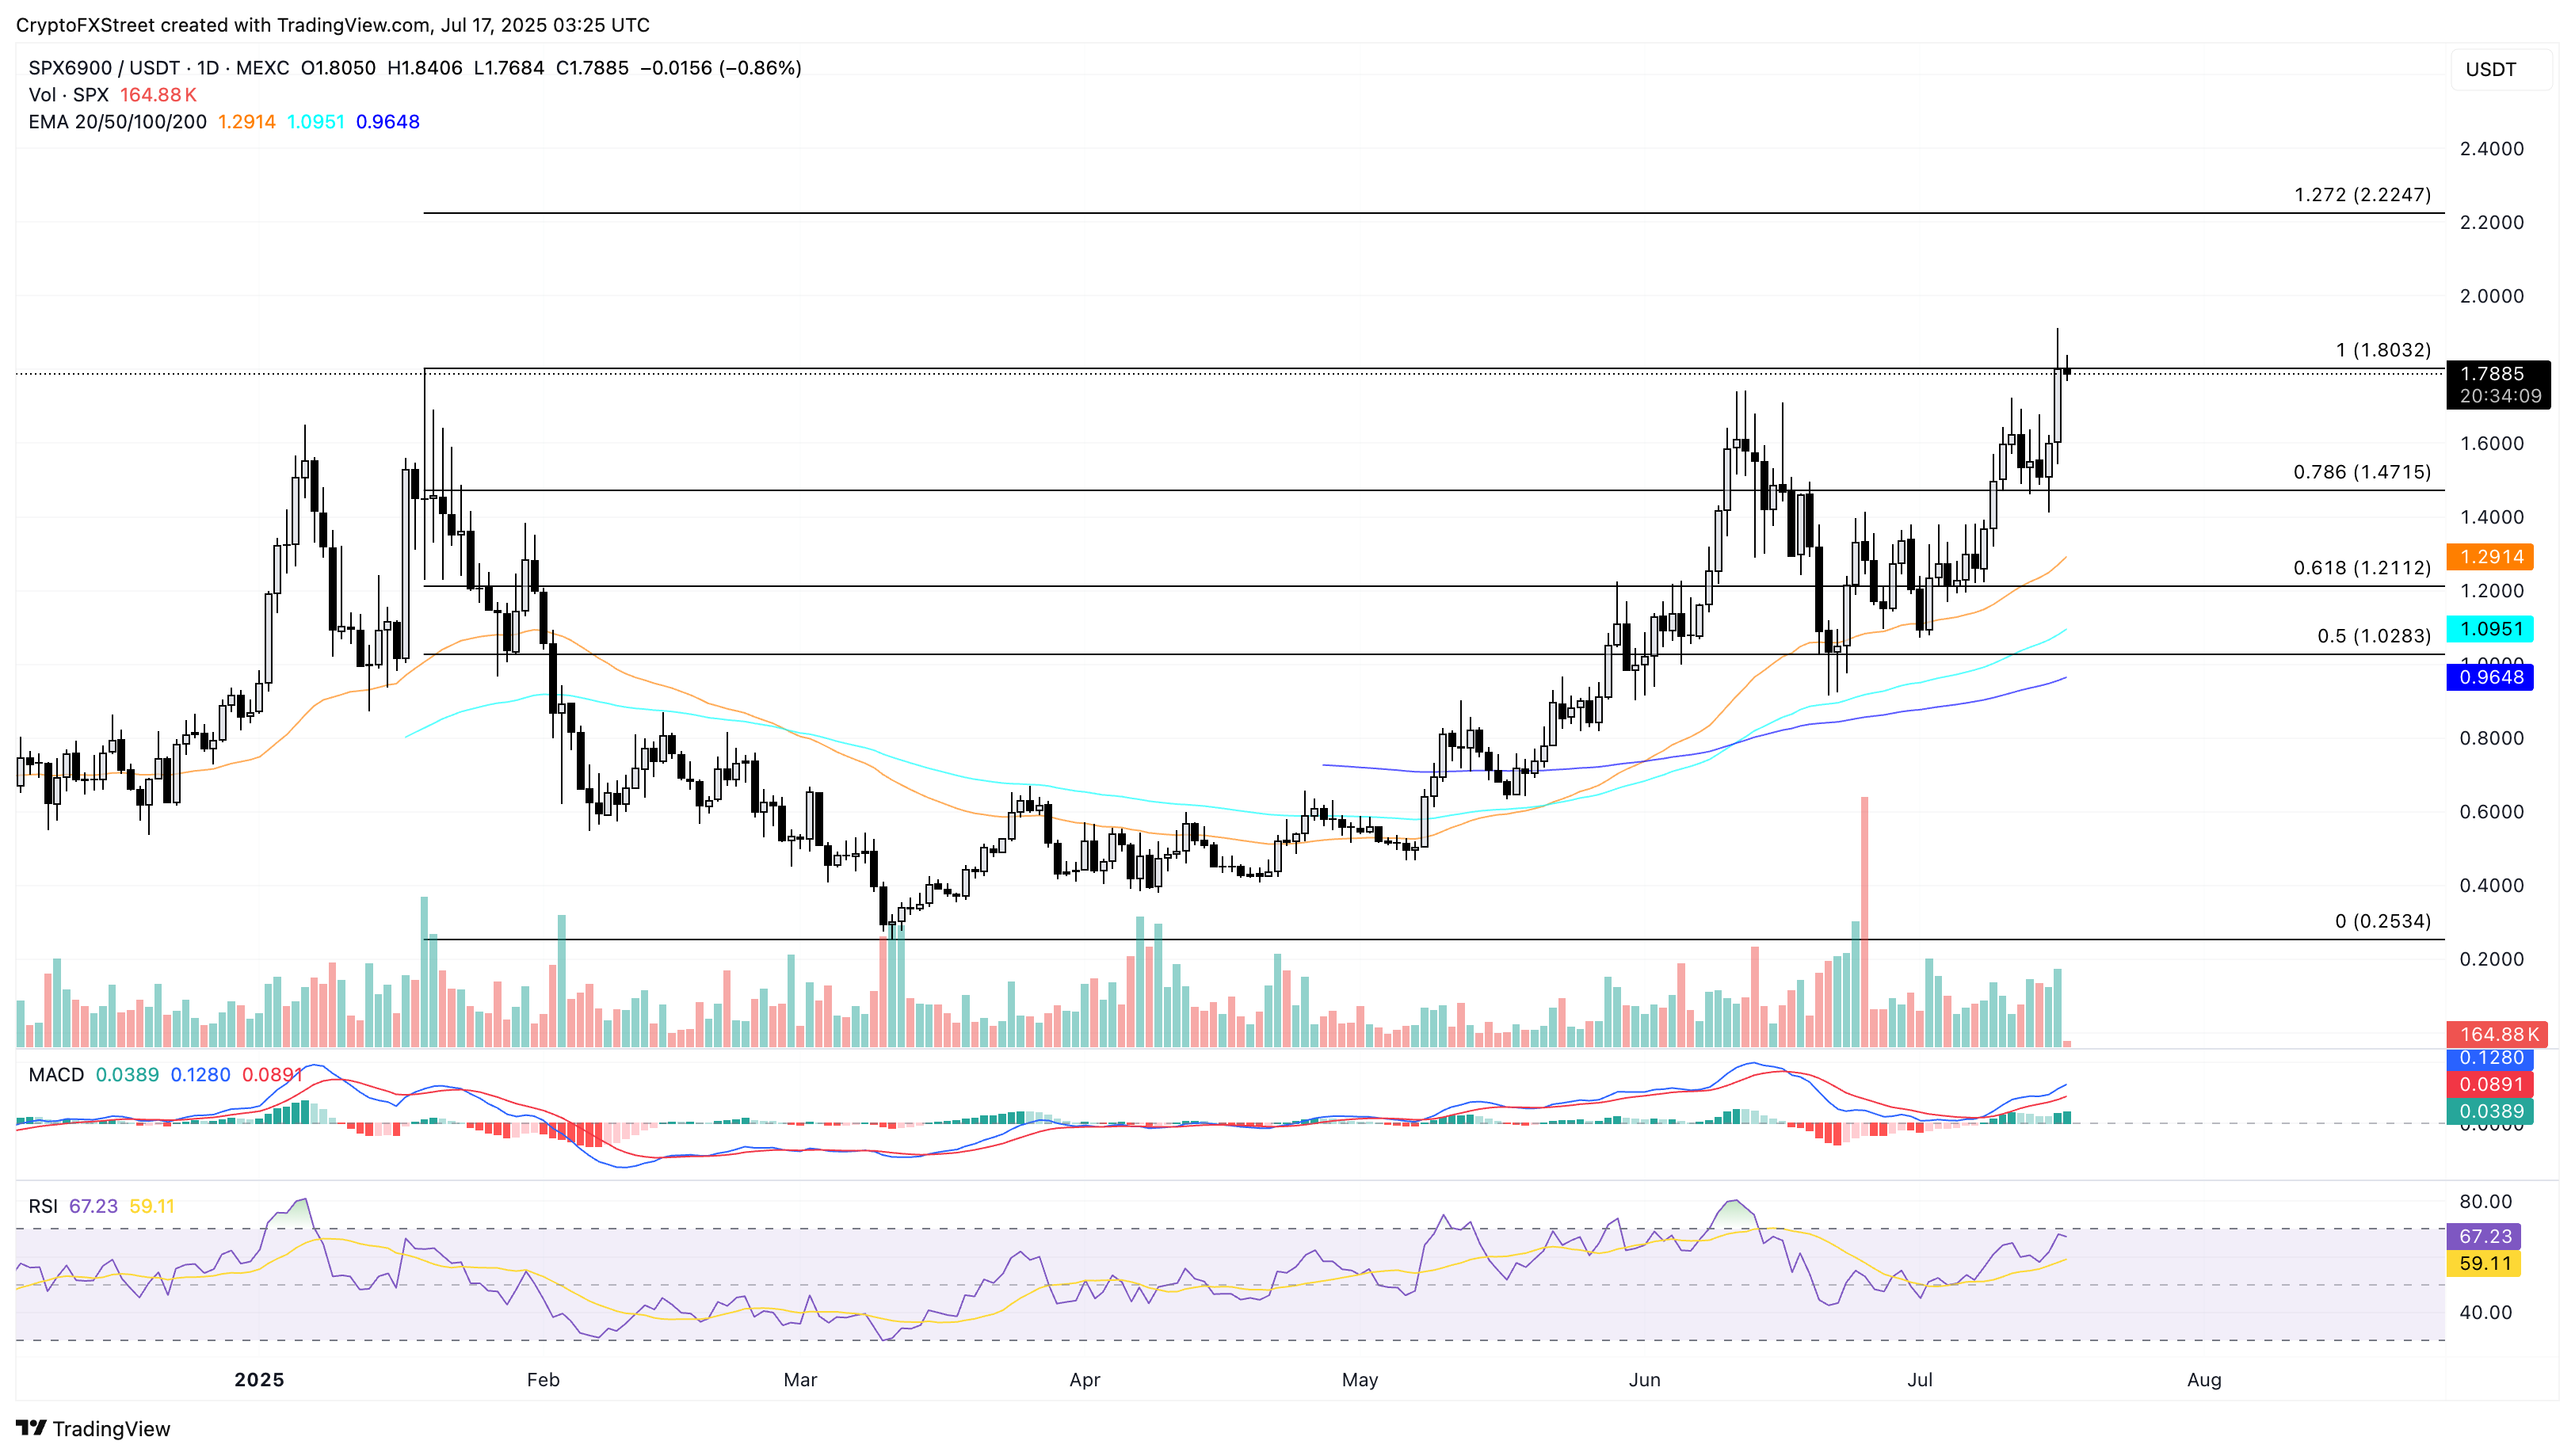
SPX/USDT daily price chart.
On the other hand, a reversal in the SPX from the $1.80 resistance could test the 78.6% Fibonacci retracement level at $1.47.
* The content presented above, whether from a third party or not, is considered as general advice only. This article should not be construed as containing investment advice, investment recommendations, an offer of or solicitation for any transactions in financial instruments.


