

U.S. Stock Market Opinions Diverge: Will the Market Rise or Fall Going Forward?

- Gold Prices Under Pressure After Hitting $4,600, UBS: Safe-Haven Logic Unchanged But Only Delayed.
- US-Iran Rift Persists, Will Gold Rise or Fall Next?
- Gold rallies on hopes for US-Iran talks and falling US Treasury yields
- Gold Price Forecast: XAU/USD opens lower around $4,450 on fears of widening Iran conflicts
- USD/JPY Hits 160.00 Mark, Will Japanese Government Intervene? Will the Currency’s Rally Be Contained?
- Seesaw Effect Continues. US Pre-Market Three Major Index Futures Weaken, Oil Prices Rise, Bitcoin Drops Below 68,000 Mark

1. Introduction
TradingKey - Since the beginning of 2025, the S&P 500 and Nasdaq Composite have risen approximately 15% and 21%, respectively. The primary drivers of this rally include the Federal Reserve’s ongoing rate cuts, optimism surrounding artificial intelligence, and robust corporate earnings growth. However, U.S. stocks have recently pulled back from their peaks, and investor forecasts for the path ahead have sharply diverged. Michael Burry—the real-life protagonist of The Big Short—revealed in the latest 13F filing for his Scion fund that he has allocated roughly 80% of the portfolio to short positions in Nvidia and Palantir. Meanwhile, several Wall Street heavyweights, including Morgan Stanley and Goldman Sachs, have turned overtly bearish; both firms expressed caution about current U.S. equity valuations at a Hong Kong summit and warned of a potential major correction. In contrast, Deutsche Bank has set a 7,000-point target for the S&P 500, Bank of America is bullish on a seasonal November rebound, and Morgan Stanley sees room for modest further gains.
Bears are comparing the current U.S. stock market to the late 1990s, highlighting three major headwinds for future performance: elevated valuations, persistent inflation, and cross-investment among high-tech firms. Passive investors should reduce holdings in broad-market ETFs like SPY and QQQ. Active investors should cut equity exposure while rotating into defensive sectors—specifically, Edison International (ED) and Northwest Natural (NWN) in utilities; Coca-Cola (KO) and Altria (MO) in consumer staples; and Johnson & Johnson (JNJ) and AbbVie (ABBV) in healthcare.
Bulls argue for U.S. stock upside on three fronts—labour markets, preventive Fed rate cuts, and robust earnings growth—and recommend overweighting broad-market ETFs. Active bulls should target rate-sensitive winners: Nvidia (NVDA) and Microsoft (MSFT) in tech; homebuilder Lennar (LEN) and warehouse REIT giant Prologis (PLD) in real estate; and gold miner Newmont (NEM). We see meaningful upside potential in U.S. equities but acknowledge downside risks, so it is rational to take long positions with stop-losses.
2. Bears' Pessimism
2.1 High Valuations
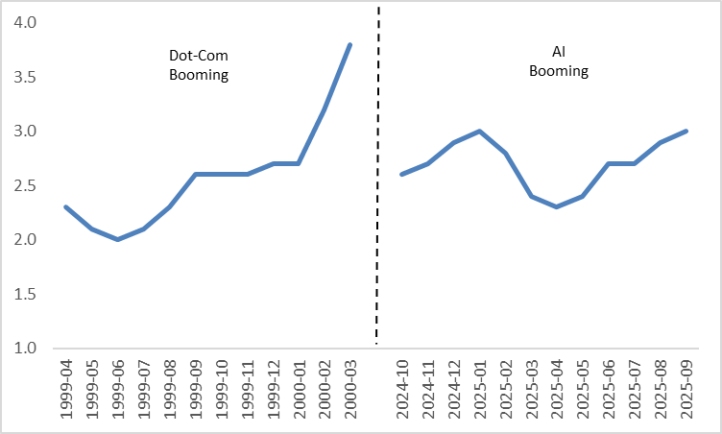
Without exception, bears compare the current U.S. stock market to the late 1990s. The core comparable factor is high valuations. The key driver behind the 2000 dot-com bubble was precisely the market narrative of the "new economy." During that period, whether a company was profitable was not critical — as long as it was associated with internet concepts, its stock price would soar. The price-to-earnings (P/E) ratio of the Nasdaq Composite Index once surged to 100 times.
Similar to the dot-com bubble era, the current AI narrative is significantly driving up U.S. stock prices, with the Nasdaq Composite Index now boasting a P/E ratio exceeding 35x. While this figure has not yet reached the 100x level seen at the peak of the dot-com bubble, it is already far above the 5-year average and on par with the two-standard-deviation threshold (Figure 2.1). From a financial statistical perspective, two standard deviations indicate that this valuation level lies outside 95% of historical normal ranges, confirming that U.S. stocks are clearly overvalued currently.
High valuations trigger downside risks for U.S. stocks, with the core lying in the imbalance between valuations and their supporting logic. Firstly, the valuations of U.S. stocks, especially tech giants, are largely driven by AI narratives and liquidity, meaning enterprises’ future earnings may have been prematurely priced in. Secondly, if the Federal Reserve’s interest rate cut momentum weakens, a rise in risk-free rates (such as the 10-year U.S. Treasury yield) will push up discount rates, significantly squeezing the valuation room for growth stocks—particularly impacting unprofitable tech companies. Thirdly, market vulnerability intensifies at elevated valuation levels; factors like policy disruptions and technological competition can easily trigger a collapse in confidence, and panic-driven capital outflows will further amplify the decline.
Figure 2.1: Nasdaq P/E Ratio
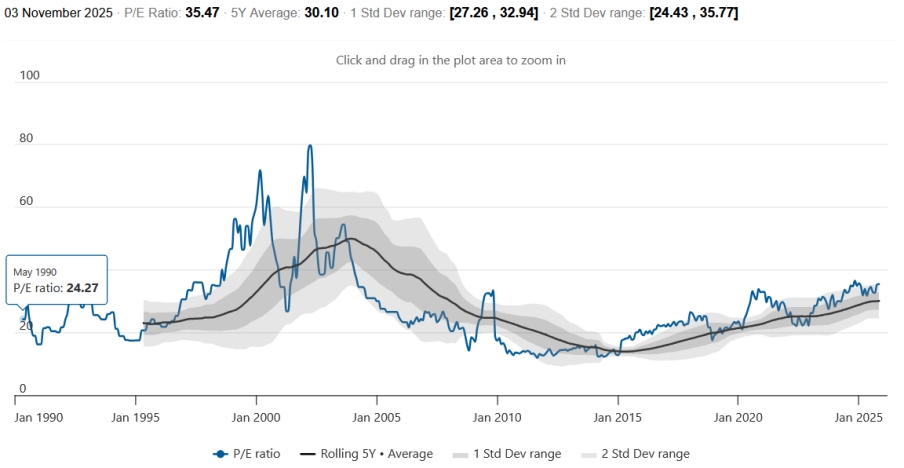
Source: World PE Ratio, TradingKey
2.2 High Inflation Diminishes the Scope for Interest Rate Cuts
The second similarity between the current period and the formation phase of the dot-com bubble in the late 1990s lies in elevated inflation. From 1998 to 1999, prices of commodities such as crude oil surged periodically due to geopolitical factors and supply-demand imbalances, creating a supply-side shock. Meanwhile, the lagged effects of the loose monetary policy implemented earlier to address the "jobless recovery" persisted. Coupled with a rebound in demand during the economic expansion phase, these factors jointly drove up prices. As a result, U.S. inflation elevated in the late 1990s, forcing the Federal Reserve to launch a cycle of consecutive interest rate hikes starting in 1999. This drained market liquidity and ultimately pricked the dot-com bubble.
Under the combined impact of the ongoing effects of Trump's tariff policies, potential excess money supply triggered by accumulated fiscal deficits and debt, supply chain bottlenecks, and geopolitical tensions, U.S. inflation has been on a steady upward trend since April this year. The CPI rose by 3% year-on-year in September, significantly exceeding the Federal Reserve's 2% target (Figure 2.2). If inflation continues to climb, it may force the Federal Reserve to adopt a hawkish stance. Although quantitative tightening will officially end on 1 December this year, the Fed's shift from a dovish to a hawkish stance means that interest rate cuts will be less aggressive and proceed at a slower pace. This could replicate the scenario in the early 2000s, leading to a collapse in U.S. stocks.
Figure 2.2: U.S. CPI (%, y-o-y)
Source: Refinitiv, TradingKey
2.3 Cross-Investment Among High-Tech Enterprises
A final commonality between the late-1990s dot-com bubble and the current landscape is the upsurge in cross-investment among high-tech enterprises. Back then, to seize shares of the internet market, companies rushed to take stakes in peers or startups, forming complex equity networks. Such mutual investments drove up valuations: Company A invested in Company B, which then invested in Company C, and each transaction in the cycle served as "proof of growth," attracting more capital inflows. Risks were concealed, stock prices decoupled from fundamentals, and the bubble expanded rapidly. With lax regulation and speculative sentiment dominating the market, any negative news could trigger a chain reaction of sell-offs.
Today, a similar pattern is repeating. Tech giants and unicorns frequently engage in stock swaps and strategic equity investments to build ecological alliances. In sectors like AI, cloud computing, and electric vehicles, a company’s fundraising is often accompanied by follow-on investments from multiple giants, driving valuations to soar. Examples include NVIDIA and Microsoft’s investments in OpenAI, as well as Amazon and Google’s investments in Anthropic. Cross-investment signals boost market confidence, attracting a flood of capital that lifts indices like the Nasdaq. While the "grouping together" of enterprises may seem stable, it actually hides liquidity risks: if market interest rates rise or earnings fall short of expectations, the devaluation of cross-held equities could trigger a domino effect. In short, although cross-investment accelerates innovation, it tends to create valuation illusions, rendering the US stock market bubble fragile.
2.4 Bearish Strategy: Reduce Holdings in SPY, QQQ and Invest in Defensive Stocks
If you hold a bearish view, passive investors should reduce positions in broad-market ETFs such as SPY and QQQ. Active investors, while lowering their equity exposure, should focus on defensive sectors – including Consolidated Edison (ED) and Northwest Natural Holdings (NWN) in the utilities sector; Coca-Cola (KO) and Altria Group (MO) in the consumer staples sector; and Johnson & Johnson (JNJ) and AbbVie (ABBV) in the healthcare sector.
3. Bulls' Optimism
3.1 Weak Labour Market Reinforces Rate Cut Momentum
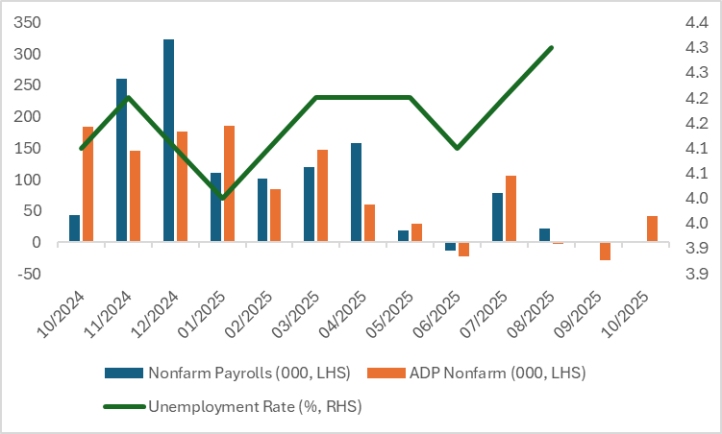
Optimists about the U.S. stock market's outlook primarily cite three factors to support its upside potential: the labour market, preventive interest rate cuts, and strong corporate earnings growth. A weak labour market, while seemingly negative for the economy, actually benefits the stock market. Although the U.S. government shutdown delayed the release of key data sets, Figure 3.1 shows that nonfarm payrolls have been on a downward trend since the first quarter of this year, with downward revisions for consecutive months. Over the same period, the unemployment rate has trended upward—all signs pointing to a softening U.S. labour market.
The weakness in the U.S. job market will be the core driver for the Federal Reserve’s sustained interest rate cuts, rooted in its deep connection with the Fed’s "dual mandate" and economic cycles. This can be analysed from three aspects. First, a weak job market impacts the Fed’s core mandate. Its statutory responsibility is to balance price stability and full employment, and a cooling labour market will tilt policy focus toward easing. Second, soft employment undermines the foundation of domestic demand growth. Consumption accounts for over two-thirds of U.S. GDP, and employment supports purchasing power. While October’s ADP nonfarm payroll data exceeded expectations, it remained well below the 12-month average — a trend that will transmit to the consumption sector through income expectations, forming an economic contraction cycle. Third, interest rate cuts are an effective tool to counteract worsening employment. Rate cuts can reduce corporate financing costs, encourage hiring and investment, while easing household borrowing pressure and boosting consumption. The Fed’s two 25-basis-point rate cuts in September and October 2025 were aimed at curbing the decline in employment. Sustained rate cuts themselves are the primary driver of U.S. stock market gains.
Figure 3.1: U.S. Labour Market
Source: Refinitiv, TradingKey
3.2 The Economy Remains Resilient with Preventive Rate Cuts
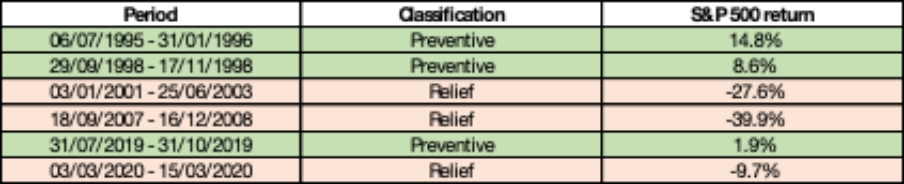
While slowing economic growth has pressured U.S. stocks, interest rate cut policies will provide offsetting support. Rate cut cycles fall into two categories: relief-driven and preventive. Among the six rate cut cycles in history, three were relief-driven, usually triggered by economic recessions. During these periods, the negative impacts of recessions outweighed the positive effects of rate cuts, leading to stock market declines. The other three were preventive, implemented to address economic slowdowns rather than recessions. In such cases, the positive effects of rate cuts exceeded the negative impacts of slowing growth, thereby boosting stock market gains (Figure 3.2.1).
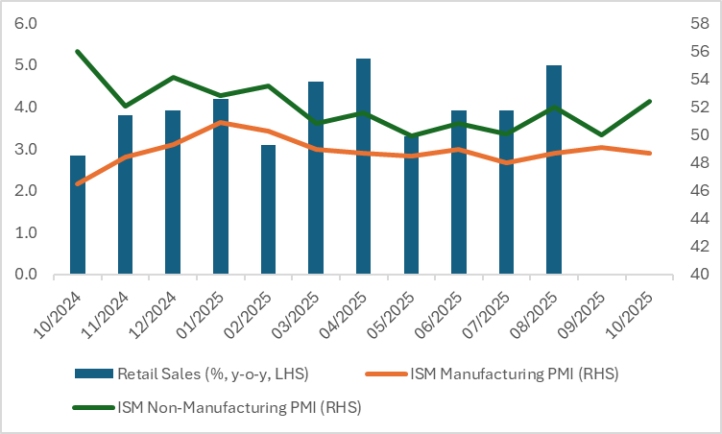
From the current perspective of the U.S. economy, demand-side growth remains notable. After hitting a low in May this year, the year-on-year increase in retail sales has continued to recover. On the production side, although the manufacturing PMI remains below the 50 threshold, the service sector—accounting for over 70% of GDP—has been in the expansion zone for five consecutive months (Figure 3.2.2). The real annualised quarter-on-quarter GDP growth rate has also improved significantly, turning from negative in the first quarter of this year to positive in the second quarter. Furthermore, the final reading of Q2 growth was revised up by 0.8 percentage points from the initial estimate released in July, registering 3.8%. Overall, the U.S. economy still demonstrates resilience, with a high probability of achieving a soft landing in the future. This interest rate cut cycle is a typical preventive move, which will exert a net positive impact on the stock market. Combined with the domestic tax reduction policy, this effect will further drive U.S. stocks higher.
Figure 3.2.1: S&P 500 Performance During Rate-Cutting Cycles
Source: Refinitiv, TradingKey
Figure 3.2.2: U.S. Retail Sales and PMI
Source: Refinitiv, TradingKey
3.3 High Valuations Coupled with Strong Growth
Bulls also note the stark contrast in corporate profitability between the late-1990s dot-com bubble and the current AI boom. The former was characterised by "story-driven valuations," where companies generally lacked profitability and even pursued growth at the cost of losses. Back then, the market abandoned traditional P/E ratios and instead chased vanity metrics like user numbers. For instance, Yahoo posted a net profit of $61.1 million in 1999 but had a forward P/E ratio as high as 60x, while unprofitable firms such as Webvan went public with an $8 billion valuation. Most companies relied on external financing to "burn cash," resulting in fragile balance sheets that made them unsustainable once liquidity tightened.
Current AI enterprises exhibit a "profit-driven growth" trait, with leading companies seeing good performance in financial conditions. To date, among enterprises that have disclosed Q3 2025 financial reports, most tech giants have achieved both revenue and profit exceeding broad market expectations. For instance, Amazon, driven by the accelerated growth of its AWS cloud business, substantial returns from AI investments, and the continuous expansion of its advertising segment, recorded Q3 2025 revenue of $180.2 billion, a year-on-year increase of 13%. Its gross profit margin rose 1.8 percentage points year-on-year to 50.8%, while net profit also grew 39% to $21.2 billion. Apple, benefiting from the strong sales of the iPhone 17 series, the high profitability of its software and services business, and the gradual easing of global trade wars, saw total revenue increase to $102.47 billion by the end of the quarter—up 7.9% year-on-year and 9% quarter-on-quarter, surpassing Wall Street analysts' previous expectation of $102.19 billion. Therefore, despite the Nasdaq's P/E ratio exceeding 35 times, the growth logic of "performance-linked expansion" is fundamentally different from speculative bubbles in the past due to strong profit predictability. This has laid a solid foundation for the subsequent sustained rise of U.S. stocks, especially tech giants.
3.4 Bullish Strategy: Increase Positions in SPY, QQQ and Rate-Sensitive Sectors
If you are a passive bull and acknowledge the three key drivers of the rally mentioned above, it is advisable to increase positions in broad-market ETFs such as SPY and QQQ to profit from the upside of the S&P 500 and Nasdaq. Among the three drivers, interest rate cuts are identified as the primary catalyst, so active bulls should focus on sectors and individual stocks that stand to benefit most from rate cuts: the technology sector is most sensitive to liquidity, with NVIDIA (NVDA) holding significant valuation upside in a loose monetary environment thanks to its monopoly in AI chips, and Microsoft (MSFT) poised for both earnings and valuation growth supported by rising cloud computing investments and lower financing costs; the real estate sector is experiencing a resonance of improved demand and easier financing, as homebuilder Lennar (LEN) is likely to see a rebound in orders driven by declining mortgage rates, while Prologis (PLD), a leading warehouse REIT, can reduce expansion pressure and attract capital through stable dividends; the precious metals sector benefits from weaker USD and falling real interest rates, and Newmont Corporation (NEM), a top gold mining leader, can directly capture the gains from rising gold prices and offers strong defensive value.
4. Conclusion
In summary, both bears and bulls have three key bearish and bullish factors, respectively. Passive bearish investors should reduce holdings of broad-market ETFs such as SPY and QQQ. Active bearish investors need to lower their equity positions while focusing on defensive sectors — Consolidated Edison (ED) and Northwest Natural Holdings (NWN) in the utilities sector, Coca-Cola (KO) and Altria Group (MO) in the consumer staples sector, as well as Johnson & Johnson (JNJ) and AbbVie (ABBV) in the healthcare sector.
Passive bullish investors should increase positions in broad-market ETFs; active bullish investors can focus on sectors and individual stocks that stand to benefit significantly from interest rate cuts. Examples include tech giants NVIDIA (NVDA) and Microsoft (MSFT), residential homebuilder Lennar (LEN) and logistics REIT leader Prologis (PLD) in the real estate sector, as well as gold mining major Newmont Corporation (NEM). We believe U.S. stocks currently have substantial upside potential while acknowledging the inherent downside risks; hence, we adopt a long strategy with strictly set stop-loss levels.
Read more
* The content presented above, whether from a third party or not, is considered as general advice only. This article should not be construed as containing investment advice, investment recommendations, an offer of or solicitation for any transactions in financial instruments.


