

US Dollar Index Price Forecast: Rally pauses above 100.00 despite Fed dovish bets ease further

- Gold Prices Under Pressure After Hitting $4,600, UBS: Safe-Haven Logic Unchanged But Only Delayed.
- US-Iran Rift Persists, Will Gold Rise or Fall Next?
- Gold rallies on hopes for US-Iran talks and falling US Treasury yields
- Gold Price Forecast: XAU/USD opens lower around $4,450 on fears of widening Iran conflicts
- USD/JPY Hits 160.00 Mark, Will Japanese Government Intervene? Will the Currency’s Rally Be Contained?
- Seesaw Effect Continues. US Pre-Market Three Major Index Futures Weaken, Oil Prices Rise, Bitcoin Drops Below 68,000 Mark

The US Dollar faces selling pressure on historically longest US government shutdown.
Fed dovish speculation recedes further after upbeat US data releases.
The USD Index could rise further towards 102.00.
The US Dollar Index (DXY), which tracks the Greenback’s value against six major currencies, trades 0.18% lower to near 100.00 during the European trading session on Thursday. The US Dollar (USD) faces slight selling pressure as the ongoing United States (US) federal shutdown has become the longest in history.
Financial market participants expect that the government shutdown could slow down the pace of public spending and the execution of federal projects, a scenario that is unfavorable for the economic outlook.
Meanwhile, Federal Reserve (Fed) dovish expectations for the December meeting have receded further after the release of the upbeat ADP Employment Change and the ISM Services PMI data for October on Wednesday.
The CME FedWatch tool shows that the probability of the Fed cutting interest rates by 25 basis points (bps) to 3.50%-3.75% in the December meeting has eased to 62.5% from 68.6% seen on Tuesday.
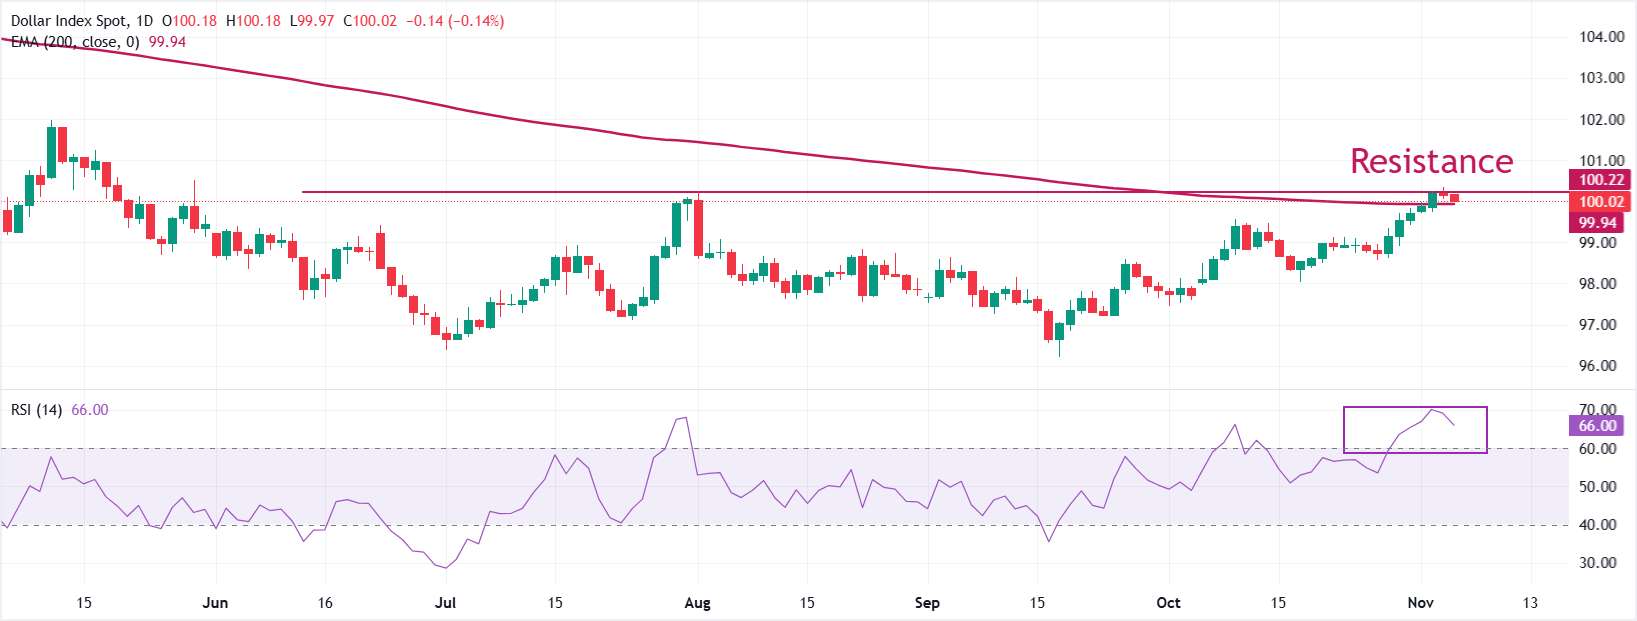
The USD Index struggles to extend its rally after posting a fresh five-month high of 100.36 posted on Thursday. The asset strives to stabilize above the 200-day Exponential Moving Average (EMA), which trades around 99.94.
The 14-day Relative Strength Index (RSI) pulls back after turning slightly overbought after reaching near 70.00. The overall momentum would remain bullish until the RSI (14) holds above 60.00.
Going forward, the USD Index would rise further towards the May 29 high of 100.53 and the May 12 high around 102.00, if it manages to break above Thursday’s high of 100.36.
On the contrary, a downside move by the US currency index below Tuesday’s low of 99.74 would lead to further correction towards the October 21 high of 99.10, followed by the October 28 low of 98.57.
US Dollar Index daily chart
Read more
* The content presented above, whether from a third party or not, is considered as general advice only. This article should not be construed as containing investment advice, investment recommendations, an offer of or solicitation for any transactions in financial instruments.


