


33-Year History Shows How to Profit Even When a Market Crash Hits
Key Points
SPDR S&P 500 ETF was the first exchange-traded fund ever created.
Since SPDR S&P 500 ETF's inception in 1993, there have been multiple bear markets, including the Great Recession and the dot-com crash.
SPDR S&P 500 ETF has recovered from each bear market and gone on to new highs.
- 10 stocks we like better than SPDR S&P 500 ETF Trust ›
The inception date of SPDR S&P 500 ETF (NYSEMKT: SPY) is Jan. 22, 1993. As 2026 draws to a close, this exchange-traded fund, the first one ever created, is roughly 33 years old. A lot has happened over those 33 years, and its history shows how investors can profit over the long term despite fairly regular market crashes. Here's what you need to know.
What does the SPDR S&P 500 ETF do?
The first thing you have to understand is that SPDR S&P 500 ETF tracks the S&P 500 index (SNPINDEX: ^GSPC). This index has become the de facto way to track "the market." It is a committee-created list of roughly 500 stocks intended to be representative of the U.S. economy. The stocks in the index are market-cap weighted, so the largest companies have the biggest impact on the index's performance. That, too, is roughly similar to how the world works.
Missed AI’s "Act 1"? Act 2 Could Be 15x Bigger. Most investors think they missed the AI boat because they didn't buy Nvidia in 2005. But according to our analysts, we’re only at the end of "Act 1"—the R&D phase. "Act 2" is the global rollout. Continue »

Image source: Getty Images.
So, basically, SPDR S&P 500 ETF's history is the market's history. And since the exchange-traded fund's inception, there have been several notable bear markets, including the dot-com bubble burst, the Great Recession, and the bear market during the coronavirus pandemic. The big story here is that these downturns were brutal to live through, but SPDR S&P 500 ETF recovered after each one and eventually moved on to higher highs.
The long-term trend is higher and to the right
The last 33 years aren't actually all that unique. The market has long moved from bull market to bear market, and back again, cycling between periods of strong and weak performance. However, the long-term trend has always been upward, despite the short-term fluctuations.
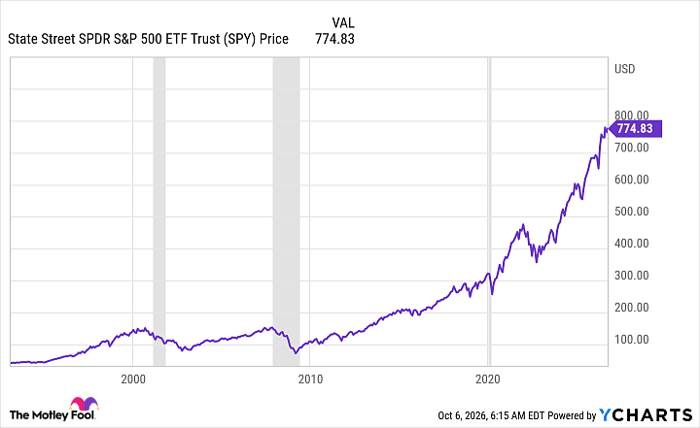
SPY data by YCharts
In fact, if you look at the chart above, the dot-com bubble bursting and the Great Recession are merely blips today, even though they were deep drawdowns at the time. If you go back even further and look only at the index's performance, since there was no ETF tracking it before 1993, these bear markets are even less noticeable. And the many bear markets before them are even less notable.
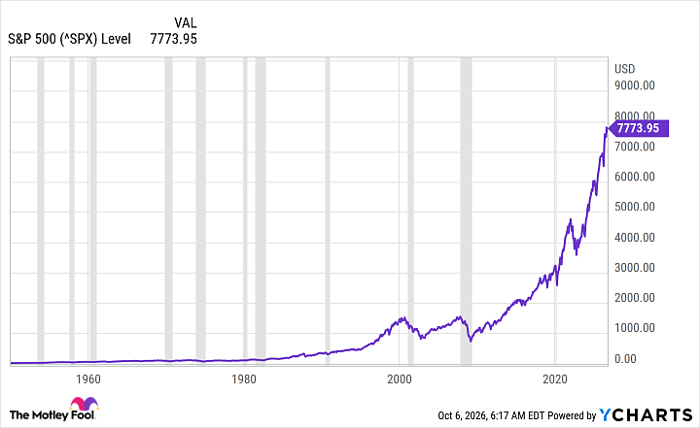
^SPX data by YCharts
The lessons of history, 33 years and counting
The big takeaway here, looking at 33 years or the longer history of the S&P 500 index, is that investors should focus on buying and holding for the long term. Even if you bought right before the Great Recession or the dot-com bubble, simply buying and holding would have resulted in strong capital appreciation. It would be even better if you bought more shares at regular intervals right through a downturn. That's known as dollar-cost averaging, and it basically leads you to buy more shares when prices are low and fewer shares when prices are high. Over time, it generally results in a lower average purchase price, which improves your long-term return. What you clearly shouldn't do is panic and sell out of fear, since history clearly shows that every bear market is eventually followed by a bull market.
In fact, controlling your emotions is a secondary lesson you shouldn't ignore. The last 33 years (and more) make it clear that bear markets are a normal part of investing. If you can accept that and stick to a long-term investment plan, even one as simple as buying SPDR S&P 500 ETF and holding it, a bear market is going to eventually come along. It will tax your emotions, but if you stick to your long-term plan and don't succumb to the fear that deep market drawdowns create, history shows you should be OK.
Should you buy stock in SPDR S&P 500 ETF Trust right now?
Before you buy stock in SPDR S&P 500 ETF Trust, consider this:
The Motley Fool Stock Advisor analyst team just identified what they believe are the 10 best stocks for investors to buy now… and SPDR S&P 500 ETF Trust wasn’t one of them. The 10 stocks that made the cut could produce monster returns in the coming years.
Consider when Netflix made this list on December 17, 2004... if you invested $1,000 at the time of our recommendation, you’d have $380,795!* Or when Nvidia made this list on April 15, 2005... if you invested $1,000 at the time of our recommendation, you’d have $1,390,634!*
Now, it’s worth noting Stock Advisor’s total average return is 946% — a market-crushing outperformance compared to 215% for the S&P 500. Don't miss the latest top 10 list, available with Stock Advisor, and join an investing community built by individual investors for individual investors.
See the 10 stocks »
*Stock Advisor returns as of October 14, 2026.
Reuben Gregg Brewer has no position in any of the stocks mentioned. The Motley Fool has no position in any of the stocks mentioned. The Motley Fool has a disclosure policy.
Recommended Articles


