


Bitcoin and Gold Outlook: BTC clings to support, XAU slides as US-Iran tensions re-escalate
- Bitcoin consolidates around $78,000 as firm ETF inflows boost recovery outlook.
- Gold declines and tests the $4,400 support level, raising the odds of a bearish flip in the technical structure.
- US and Iran exchange strikes for the first time in weeks, re-escalating tensions in the Middle East.
Bitcoin (BTC) maintains stability above $78,000 support on Monday as crypto prices broadly consolidate. Gold (XAU/USD), meanwhile, holds above $4,400, marking two consecutive days of declines.
Sentiment remains positive amid steady Bitcoin ETF inflows
Sentiment in the broader cryptocurrency market remains broadly positive, with the Fear & Greed Index holding at 62 on Monday, down slightly from 69 the previous day. If sentiment remains in the Greed territory, demand for Bitcoin spot Exchange-Traded Funds (ETFs) could absorb overhead pressure. Stability is required to defend $78,000 support and raise the odds of a breakout above $80,000.
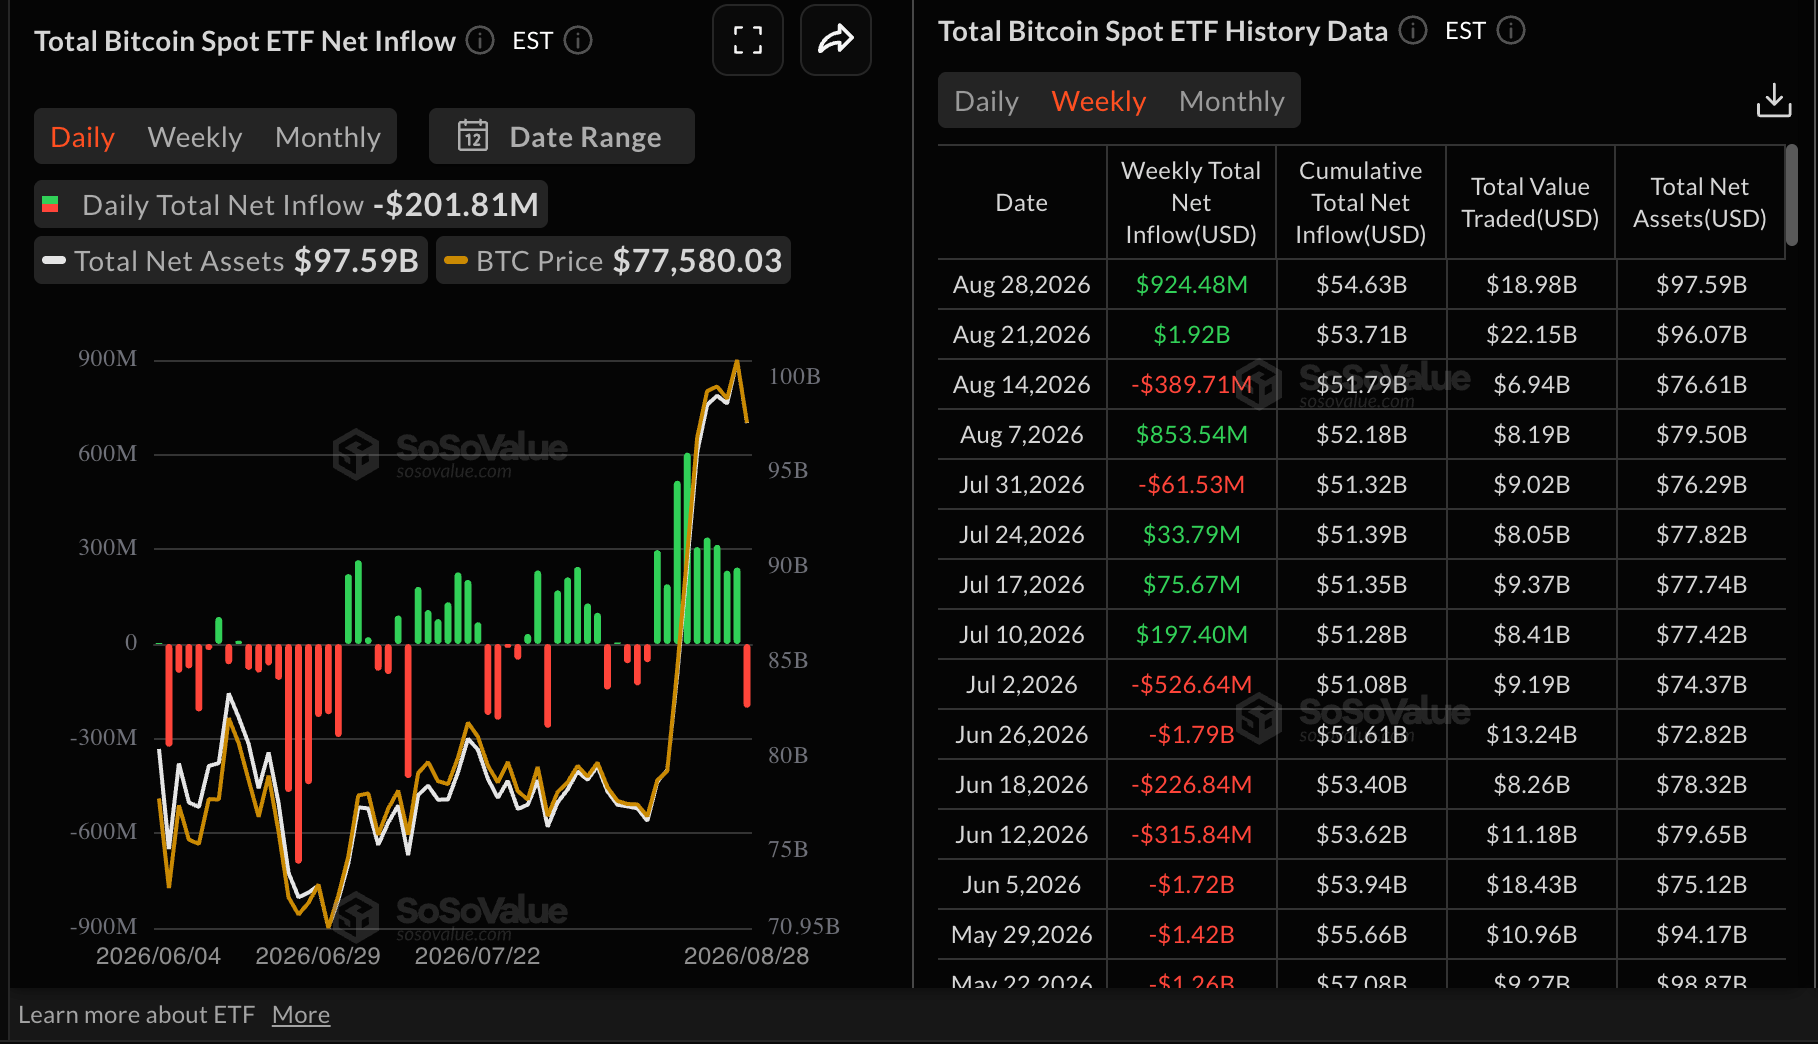
According to SoSoValue, inflows into US-listed spot ETFs amounted to $924 million through Friday, down from $1.92 billion in the week ending August 21. Cumulative inflows currently stand at $55 billion, with net assets under management at $98 billion.
US and Iran exchange strikes
The United States (US) and Iran exchanged military strikes for the first time in weeks over the weekend, renewing geopolitical tensions in the Middle East. US Central Command announced strikes targeting what it described as Iranian rocket launchers on Larak Island, in the Strait of Hormuz.
The Islamic Revolutionary Guard Corps (IRGC) claimed responsibility for strikes targeting US military installations in Jordan and the United Arab Emirates (UAE) on Sunday, framing the action as direct retaliation against recent US operations.
The renewed fighting in the six-month war comes after US President Donald Trump announced a shift in strategy last week to "economic warfare," heaping pressure on Iran with new sanctions in an attempt to break the stalemate in the conflict.
Technical analysis: Bitcoin bulls defend $78K support
Bitcoin trades at $78,000, holding a clear bullish near-term bias as the price stands well above the main Exponential Moving Averages (EMAs). The 50-day EMA is at $69,687, the 100-day EMA at $68,889 and the 200-day EMA at $72,249.36, all trailing below the market, suggesting a firmly supported uptrend after the recent surge from the mid-$60,000s.
Momentum stays constructive, with the Moving Average Convergence Divergence (MACD) indicator moderating from earlier extremes yet remaining in positive territory, while the Relative Strength Index (RSI) hovers just under the overbought threshold near 70, hinting at strong but stretched buying pressure.
-1788192803392.png)
Immediate support is found at the latest close around $77,995, where any pullback would first test the current pivot before exposing deeper demand at the rising 200-day EMA near $72,249. Below there, a more significant corrective phase would likely draw buyers toward the clustered 50-day and 100-day EMAs at $69,686 and $68,889, respectively, which reinforce the broader bullish structure. The pair’s path of least resistance remains higher in the short term, though the elevated RSI hints that fresh gains could be increasingly vulnerable to bouts of profit-taking.
"Bitcoin holding around $78,000 after a 23% surge is more telling than the surge itself. For months this market sat compressed, sold-out, and left for dead, and I argued that stillness was accumulation rather than decay," Yusuf Fakhro, Partner at ARP Digital told FXStreet in a comment, adding "it resolved, violently, to the upside in the strongest weekly gain since the post-election rally of November 2024, and the fact that it has consolidated at these levels rather than handing the move back is, to my mind, the strongest confirmation that this was a genuine regime shift and not a flash in the pan."
Technical outlook: Gold extends decline
Gold holds a constructive near-term bias as it remains above the 50-day, 100-day, and 200-day EMAs, clustered between roughly $4,315 and $4,365, suggesting underlying trend support after reclaiming the former descending resistance trendline around $4,335.
The RSI at 52 sits just above neutral, hinting at balanced but slightly positive momentum, while the MACD histogram has slipped below zero, warning that bulls may grind higher more slowly rather than in an impulsive rally.
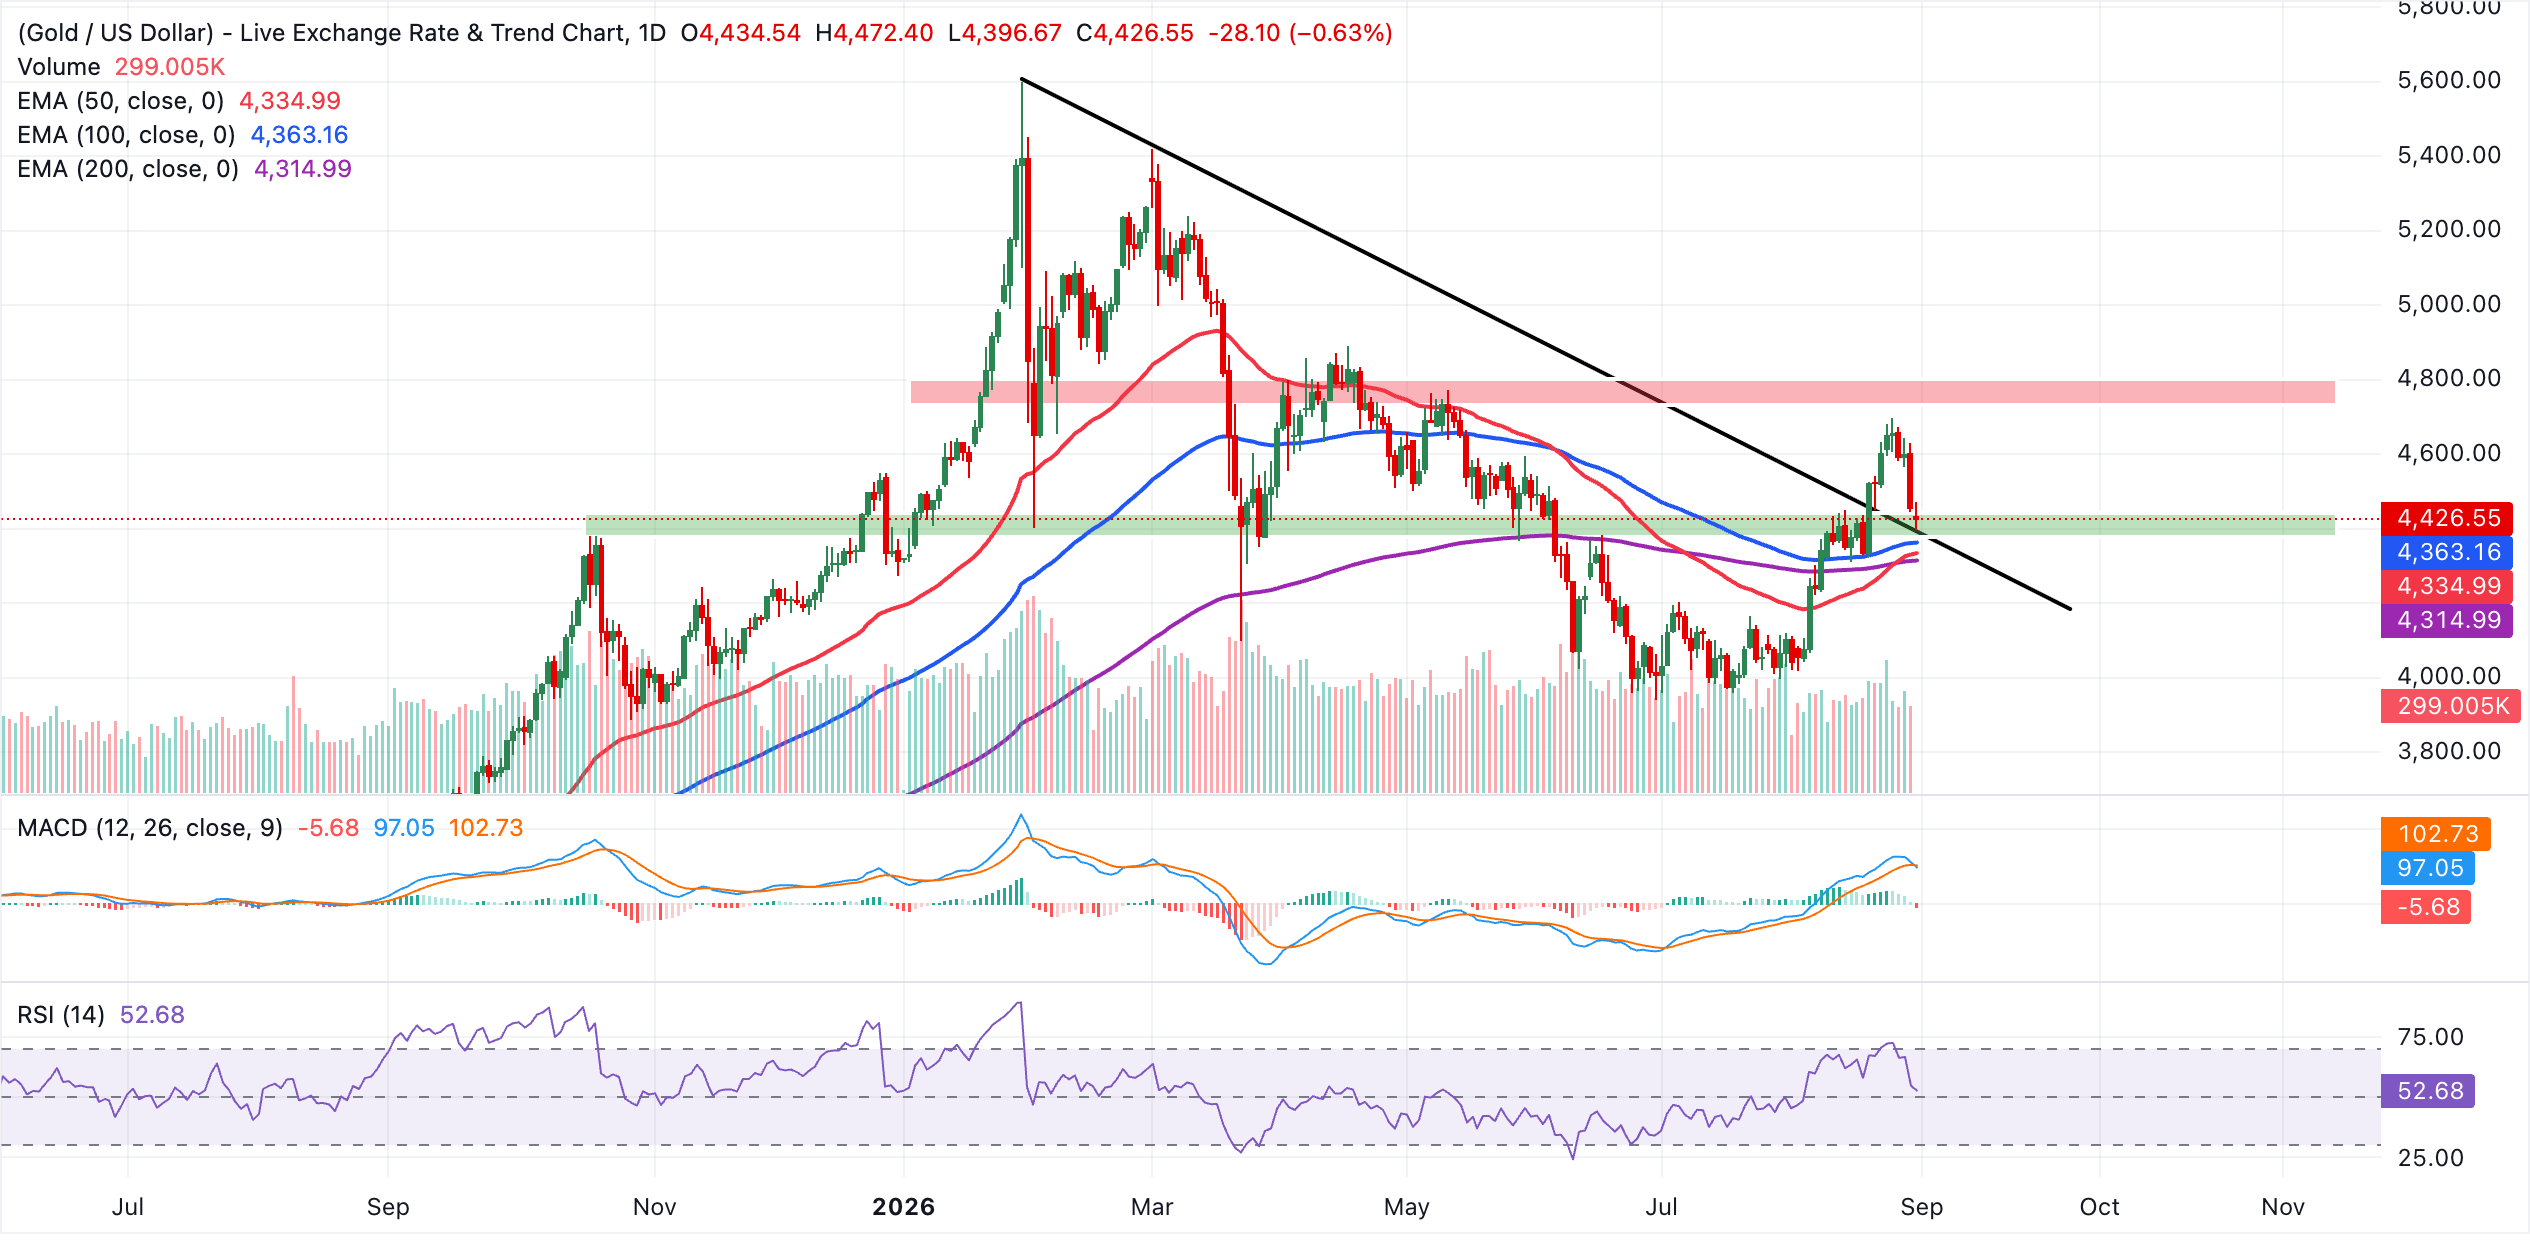
Initial support lies at the 100-day EMA near $4,363, followed by the reclaimed trend-line area at $4,335 that aligns with the 50-day EMA at $4,334, forming a dense support band. A deeper pullback would expose the longer-term floor defined by the 200-day EMA at $4,315, where buyers are likely to defend the broader uptrend as long as daily closes remain above this level.
(The technical analysis of this story was written with the help of an AI tool. Know more.)
Bitcoin, altcoins, stablecoins FAQs
Bitcoin is the largest cryptocurrency by market capitalization, a virtual currency designed to serve as money. This form of payment cannot be controlled by any one person, group, or entity, which eliminates the need for third-party participation during financial transactions.
Altcoins are any cryptocurrency apart from Bitcoin, but some also regard Ethereum as a non-altcoin because it is from these two cryptocurrencies that forking happens. If this is true, then Litecoin is the first altcoin, forked from the Bitcoin protocol and, therefore, an “improved” version of it.
Stablecoins are cryptocurrencies designed to have a stable price, with their value backed by a reserve of the asset it represents. To achieve this, the value of any one stablecoin is pegged to a commodity or financial instrument, such as the US Dollar (USD), with its supply regulated by an algorithm or demand. The main goal of stablecoins is to provide an on/off-ramp for investors willing to trade and invest in cryptocurrencies. Stablecoins also allow investors to store value since cryptocurrencies, in general, are subject to volatility.
Bitcoin dominance is the ratio of Bitcoin's market capitalization to the total market capitalization of all cryptocurrencies combined. It provides a clear picture of Bitcoin’s interest among investors. A high BTC dominance typically happens before and during a bull run, in which investors resort to investing in relatively stable and high market capitalization cryptocurrency like Bitcoin. A drop in BTC dominance usually means that investors are moving their capital and/or profits to altcoins in a quest for higher returns, which usually triggers an explosion of altcoin rallies.
Recommended Articles


