

GBP/USD rebounds as Dollar softens, but UK risks limit upside
- Sterling is boosted by broad US Dollar weakness, as DXY slides over 0.18%.
- Fed cut rates last week, signaling 75 bps of easing by year-end, though Powell downplayed prospects of a larger move.
- UK labor fragility and looming fiscal consolidation could cap Sterling’s gains ahead of Autumn budget risks.
The Pound Sterling bounces off last week’s low of 1.3453 yet bulls are not out of the woods, after the pair hit a two-month peak of 1.3726, before plunging following the Federal Reserve’s decision to reduce interest rates. The GBP/USD trades at 1.3496, up 0.27%.
GBP/USD recovers 0.33% above 1.35 as Fed cut weighs on Dollar; fiscal and labor headwinds in UK keep bulls cautious
The Greenback depreciates during Monday’s session, as depicted by the US Dollar Index (DXY). The DXY, which tracks the performance of the buck’s value against a basket of six currencies, dives 0.18% at 97.47, providing a boost for most G10 FX currencies.
Last week’s Fed cut rates and set the stage for over a total of 75 basis points of easing—including last Wednesday’s one, towards the year’s end. Nevertheless, Fed Chair Jerome Powell struck a mild hawkish tone at his presser, saying that the cut is more of a risk-management action than setting the path of interest rates. When asked about 50 bps cut, he said “No widespread support for 50 bps cut today.”
Besides this, eyes are on the US Congress as lawmakers face a deadline of September 30 to pass a funding bill to impede a government shutdown. Senators are expected to be back in Washington until September 28 while House members are not due to return until October 7, revealed NBC.
Across the pond, economists revealed that a vulnerable labor market in the UK and a possible need for further fiscal consolidation in the Autumn budget, could cap the GBP/USD’s advance.
The docket in the UK will feature Bank of England’s Governor Andrew Bailey, and Chief Economist Huw Pill, and the release of S&P Global Flash PMIs on Tuesday. In the US, traders’ eye Fed Governor Stephen Miran, Richmond Fed Thomas Barkin and Cleveland Fed Beth Hammack.
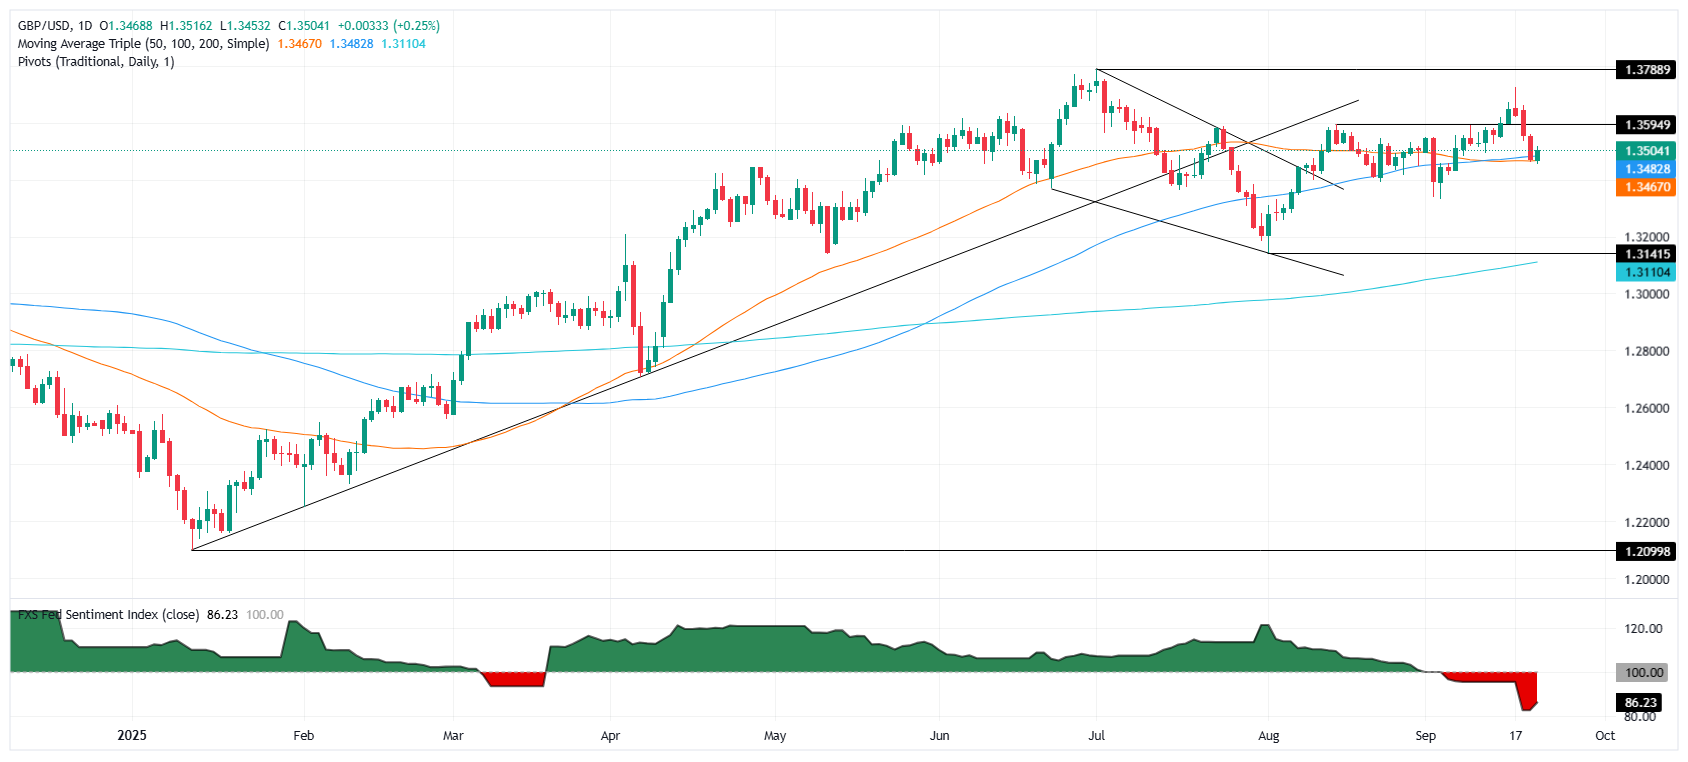
GBP/USD Price Forecast: Buyers must clear 1.3560 to challenge higher prices
Although the GBP/USD is printing a leg-up, it is facing resistance at the 20-day Simple Moving Average (SMA) at 1.3520. Failure to end the day above 1.3500 could sponsor a continuation of the short-term downtrend that could test 1.3400, with bears eyeing the next area of interest at 1.3332, the September 3 swing low.
Otherwise, if GBP/USD finishes Monday’s session above 1.3500, look for a challenge of last Friday’s high of 1.3559. Once surpassed, a bullish engulfing chart pattern would be formed, and pave the way for further upside.
Pound Sterling Price This Month
The table below shows the percentage change of British Pound (GBP) against listed major currencies this month. British Pound was the strongest against the Canadian Dollar.
| USD | EUR | GBP | JPY | CAD | AUD | NZD | CHF | |
|---|---|---|---|---|---|---|---|---|
| USD | -0.65% | -0.06% | 0.58% | 0.56% | -0.64% | 0.50% | -0.74% | |
| EUR | 0.65% | 0.61% | 1.17% | 1.23% | 0.00% | 1.16% | -0.09% | |
| GBP | 0.06% | -0.61% | 0.46% | 0.62% | -0.59% | 0.56% | -0.63% | |
| JPY | -0.58% | -1.17% | -0.46% | 0.04% | -1.20% | -0.04% | -1.29% | |
| CAD | -0.56% | -1.23% | -0.62% | -0.04% | -1.19% | -0.06% | -1.25% | |
| AUD | 0.64% | -0.00% | 0.59% | 1.20% | 1.19% | 1.16% | -0.04% | |
| NZD | -0.50% | -1.16% | -0.56% | 0.04% | 0.06% | -1.16% | -1.19% | |
| CHF | 0.74% | 0.09% | 0.63% | 1.29% | 1.25% | 0.04% | 1.19% |
The heat map shows percentage changes of major currencies against each other. The base currency is picked from the left column, while the quote currency is picked from the top row. For example, if you pick the British Pound from the left column and move along the horizontal line to the US Dollar, the percentage change displayed in the box will represent GBP (base)/USD (quote).
Recommended Articles


