


Dow Jones Industrial Average rallies into a payrolls print it cannot win
- DJIA closed just under 53,700, up roughly 620 points, its best day since August 4.
- Vice President Vance asked for cuts as the 30-year mortgage rate rose to 6.71%.
- Payrolls at 12:30 GMT Friday: 56K consensus after 23K jobs lost in July.
The Dow Jones Industrial Average closed just under 53,700 on Thursday, up roughly 620 points and close to 1.2%, its strongest session since August 4, after a Fed governor said he would be inclined to support holding rates at the September 15-16 meeting if the next two weeks of inflation data behave. The index printed its low just above 53,000 at 10:30 GMT, added the bulk of the gain between 12:30 GMT and 15:30 GMT, and spent the final four hours in a 100-point band beneath a high a shade above 53,750. September hike odds on the FedWatch tool ended the day at 50.4%, down from 63.2% on Wednesday, and the 10-year Treasury yield finished at 4.77% after touching its highest level since late 2023 a day earlier.
It rallied through an Institute for Supply Management (ISM) services Purchasing Managers Index (PMI) that beat at 55.4 against a 54.3 consensus and carried a prices paid reading of 72.6, up from 70.3. That is not the kind of number a hold is built on, and the index added roughly 300 points after it printed.
A hold that pleases neither camp
Thursday also produced the clearest statement yet of what the White House wants from the committee, and it is not a hold. Vice President JD Vance told a press briefing that the Fed should be lowering rates because President Trump wants Americans to be able to afford a home, and asked for some help from the central bank, hours after the average 30-year fixed mortgage rate rose to 6.71%, its highest since July 2025. The request landed less than a week after the Fed Chair told Jackson Hole that prices are the committee's predominant focus.
The committee's own hawks are pulling the other way. The July vote was 9-3 with three regional presidents dissenting in favour of a hike, one of them on record that a single quarter-point move would not do much, and a second governor said this week he would support tightening if inflation fails to ease. The equity market's bet is the outcome in the middle, which neither the administration nor the dissenters are arguing for, and 620 points is a lot to have paid for a compromise whose loudest backer attached a condition to it.
Why Friday can only take points away
The problem with a rally built on a hold is that the report due at 12:30 GMT on Friday cannot deliver one. Nonfarm payrolls carry a 56K consensus after 23K jobs were lost in July, with the unemployment rate seen at 4.1% and average hourly earnings at 0.3% on the month and 3% YoY, down from 3.2%. A Fed Chair who has said prices come first is not going to base a hold on weak hiring, so a soft print buys equities nothing on the rate side, and a second poor month in a row turns the labour market from a rates story into an earnings story.
A strong print is worse. It confirms the case the three dissenters made in July, puts the September hike back above 60% where it sat on Wednesday morning, and sends the 10-year back above 4.80%, with WTI Crude Oil just above $91.00 and Brent near $95.50 after the heaviest exchange of fire between American and Iranian forces in more than a month. The data the hold actually depends on do not arrive until next week, with the Producer Price Index (PPI) on September 10 and the Consumer Price Index (CPI) on September 11, so Thursday's gain has to survive a report that can hurt it and cannot help it before the numbers that could vindicate it are printed.
Payrolls first, then the prints that decide the meeting
Friday's report is the only red-band release before the weekend, and its subcomponents carry as much weight as the headline, with the U6 underemployment rate after 7.9% and participation after 61.4% arriving at 12:30 GMT alongside the main number. Next week opens quietly with the four-week average of Automatic Data Processing (ADP) employment change on Tuesday at 12:15 GMT after an 11.75K prior reading.
Thursday, September 10 brings PPI at 12:30 GMT, with the headline seen at 0.3% on the month after a flat July and the core measure at 0.3% after 0.2%, against annual rates of 4.7% and 4.2%, alongside claims after a 206K print and existing home sales. Friday, September 11 delivers CPI at 12:30 GMT after 0.1% on the month and 3.4% YoY in July with core at 2.5% YoY, followed by the preliminary Michigan sentiment index at 14:00 GMT after 51.7 and the one-year inflation expectations gauge after 4%. Every one of those prints lands before the September 15-16 meeting, and the governor who leaned toward a hold made his lean conditional on them.
Levels and bias
Upside: 53,800 is the first hurdle, with Thursday's high stopping just above 53,750 and the index unable to hold above 53,700 into the close. A daily close above 53,800 opens 54,000, and beyond it only the record high just under 54,750 from early August is left.
Downside: 53,500 is the shelf Thursday cleared and the level that decides whether the day was a breakout or a squeeze, and a daily close back beneath it hands the gain back to the range. Beneath it sit 53,250 and then 53,000, with Thursday's low just above the latter, and the rising 50-day Exponential Moving Average (EMA) near 52,800 remains the line under the whole August advance. The 200-day EMA just above 50,000 is not in play.
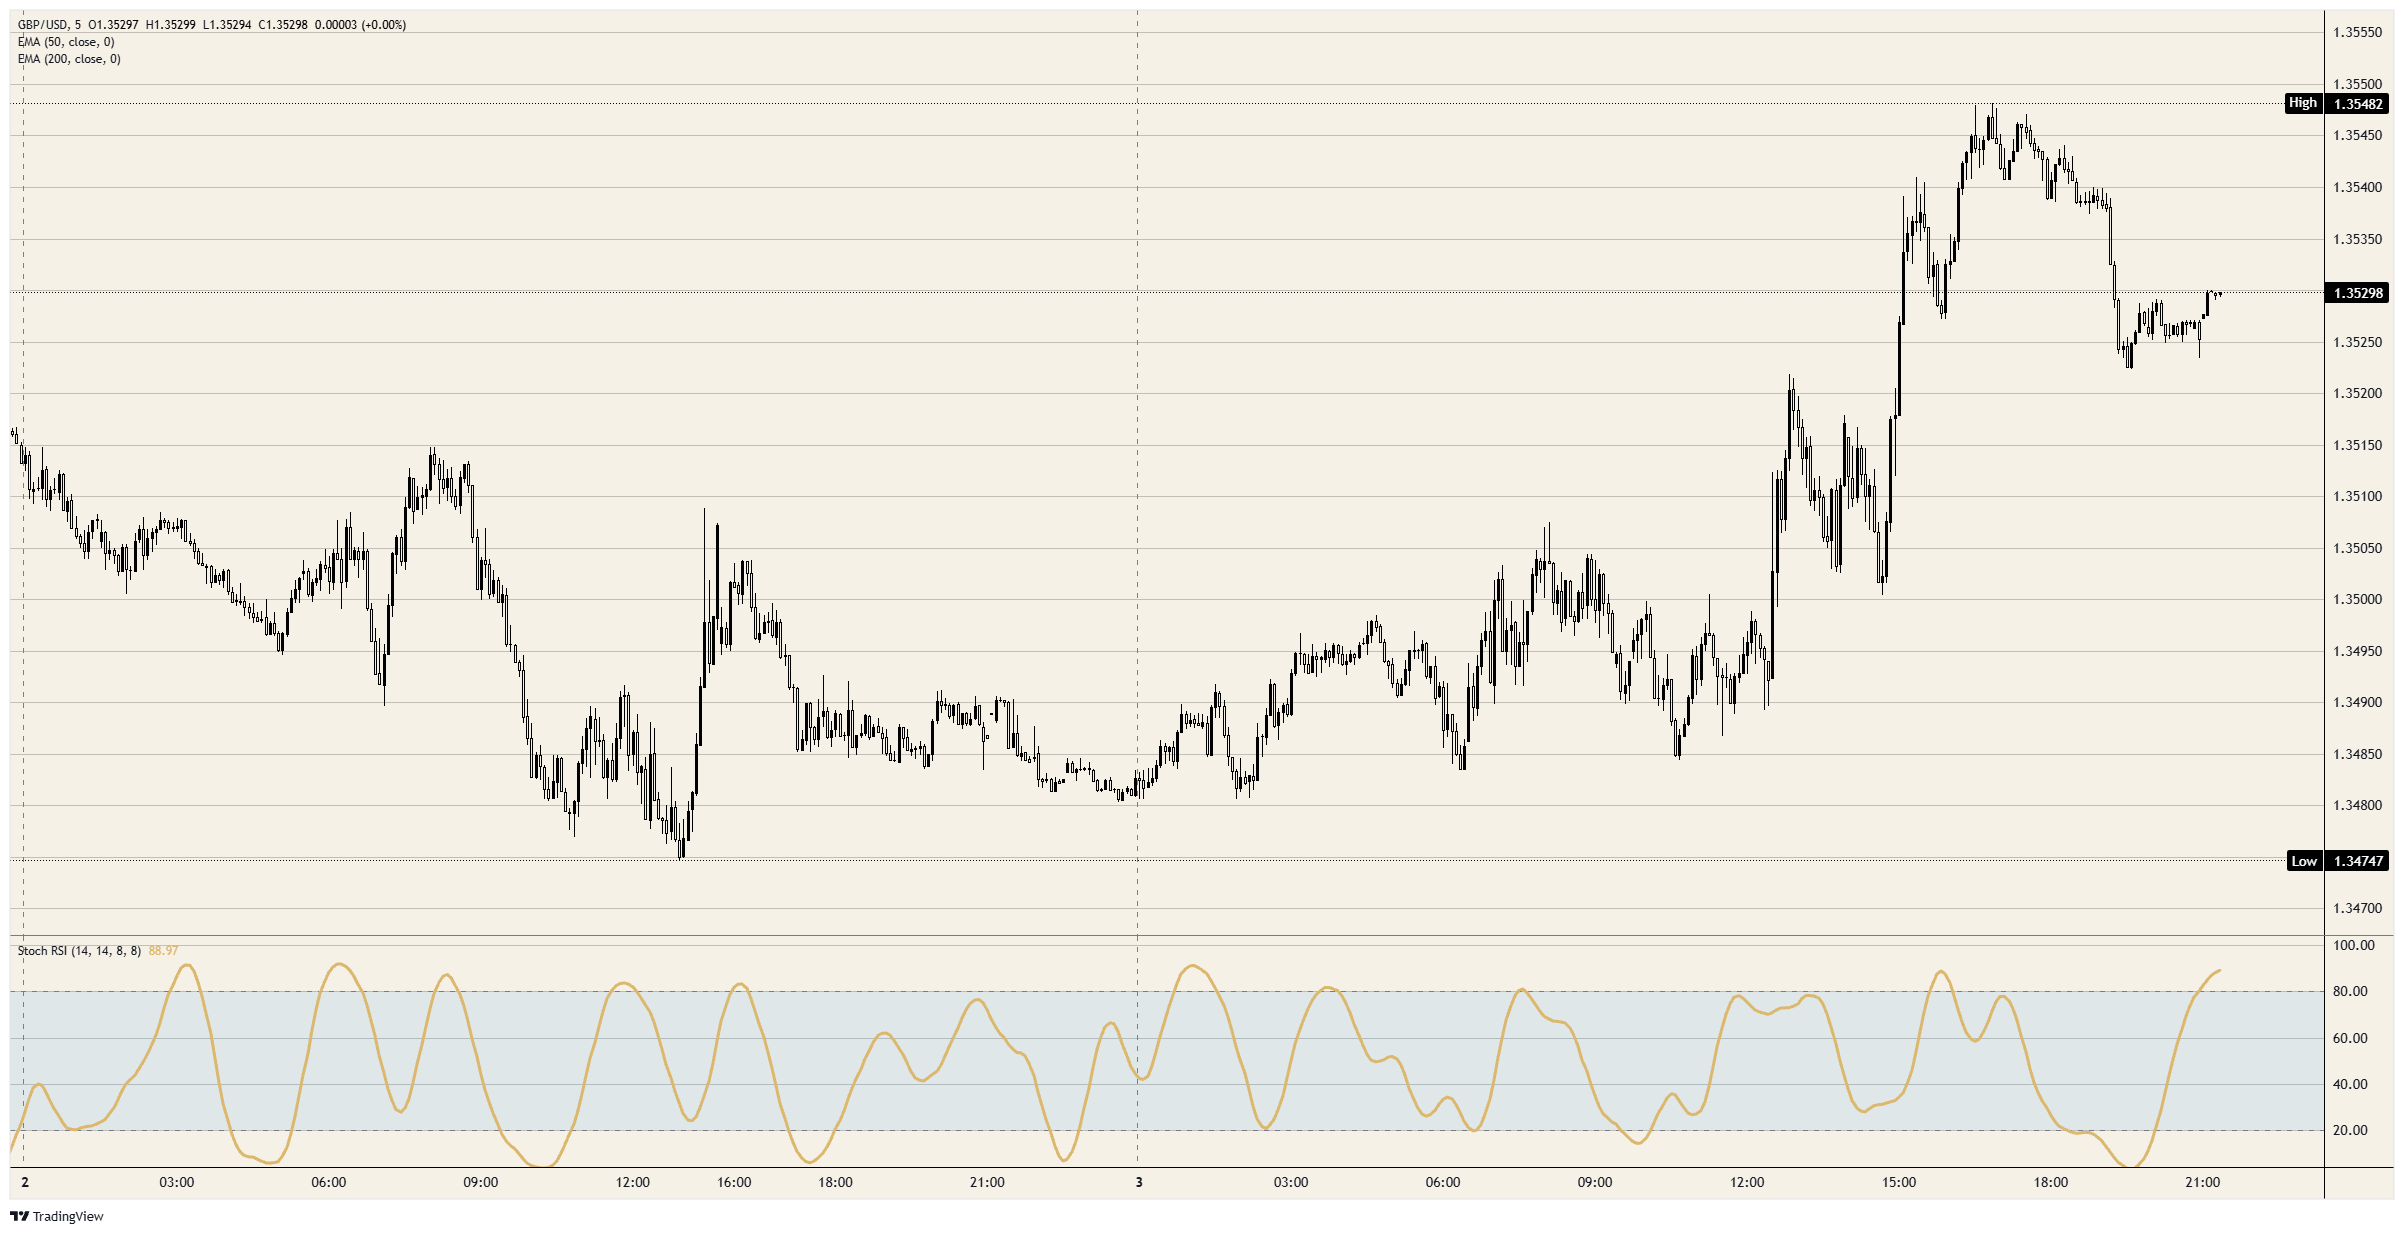
Bias: Bullish while 53,500 holds, with 53,800 and 54,000 the objectives. The daily Stochastic Relative Strength Index (Stoch RSI) near 36 is turning up from the lower third of its range, and the five-minute reading worked off an overbought print without the index giving back more than 100 points, which is what a session that intends to continue looks like. Friday is the risk rather than the trend: a strong payrolls print tests 53,500 before the European close, and a daily close beneath it reopens 53,250 and the 50-day EMA.
Dow Jones 5-minute chart
Futures FAQs
The futures market is an exchange-based auction in which participants buy and sell contracts of an underlying asset at a predetermined future date and price. The set price is agreed upon today and is derived from the underlying asset. Futures contracts can be based on a wide range of assets, with commodities among the most popular, although currencies and indices are other common underlying assets. Futures prices depend on their underlying asset and act as a mechanism for firms, institutions, and large-position traders to manage risks through hedging.
Futures can be traded in different ways. The most common ways are via a regulated exchange or via Contracts For Difference (CFDs). In the former, liquidity is high and pricing is more transparent, with the broker serving only as an intermediary between you and the market. Still, it generally requires more capital. The largest futures exchanges are the Chicago Mercantile Exchange (CME) and the New York Mercantile Exchange (NYME). As for CFDs, these require less capital and thus trading is more flexible, but at the cost of less transparency.
The E-mini S&P 500 index, Crude Oil (Brent, WTI), Natural Gas, Gold, Silver, Copper, and soft commodities such as grains are among the most actively traded contracts. These offer strong liquidity and are closely followed by traders worldwide. Futures market volume consistently exceeds spot market volume, often significantly. This dominance is driven by leverage, hedging, and higher liquidity on exchanges.
Yes. Future gauges, particularly equity index futures such as those of the S&P 500 or the Nasdaq, are widely considered key gauges of market sentiment because they reflect investors’ expectations for the next session’s opening price. When equity futures drop, it is a sign of risk-aversion, signaling bearish market sentiment. On the contrary, rising equity futures suggest markets are risk on.
As a futures contract approaches its maturity date, the futures price converges upon the spot price, becoming almost identical at expiration. However, prices can diverge significantly before the contract ends. A market is in contango when future prices are higher than spot prices, while the mirror image is called backwardation (when current prices are higher than future prices). For commodities, the normal state of the market is contango because holding the asset over time incurs costs such as storage or insurance fees. When markets turn from contango to backwardation – or vice versa – it signals a shift in the trend: a change from contango to backwardation is taken as a bullish sign, while going from backwardation to contango is generally considered bearish.
Recommended Articles


