

Cardano Price Forecast: Bearish breakout warns of a 15% downside risk

Source Fxstreet
  • Cardano hovers below $0.20 on Wednesday after facing a 6% loss the previous day.
  • On-chain data shows declining network activity and REV, indicating reduced demand in the Cardano ecosystem.
  • Cardano futures point to a sell-side bias amid declining Open Interest and elevated long liquidations over the past 24 hours.

Cardano (ADA) hovers around $0.1900 at press time on Wednesday after a 6% decline the previous day, breaking below a crucial support level. Declining on-chain activity across the Cardano ecosystem, with reduced transaction count and Real Economic Value (REV), suggests waning user demand. Cardano futures data indicates fading retail speculation with declining Open Interest and over $2 million in long liquidations in the last 24 hours. 

Fading ecosystem activity and mixed retail demand

Blockworks data shows that the Cardano ecosystem is experiencing a decline in transaction count, resulting in lower revenue collection. The transaction count is down to 18,334 on Monday, from 40,063 on August 21, while its REV, which tracks the total transaction fees and paid failure collateral, dropped to $1,167 on Monday, from $2,796 on August 22. 

This decline in on-chain activity suggests that Cardano is struggling to gain market share among layer-1 blockchains. Moreover, the reduced activity translates to lower intrinsic demand for the ADA token.
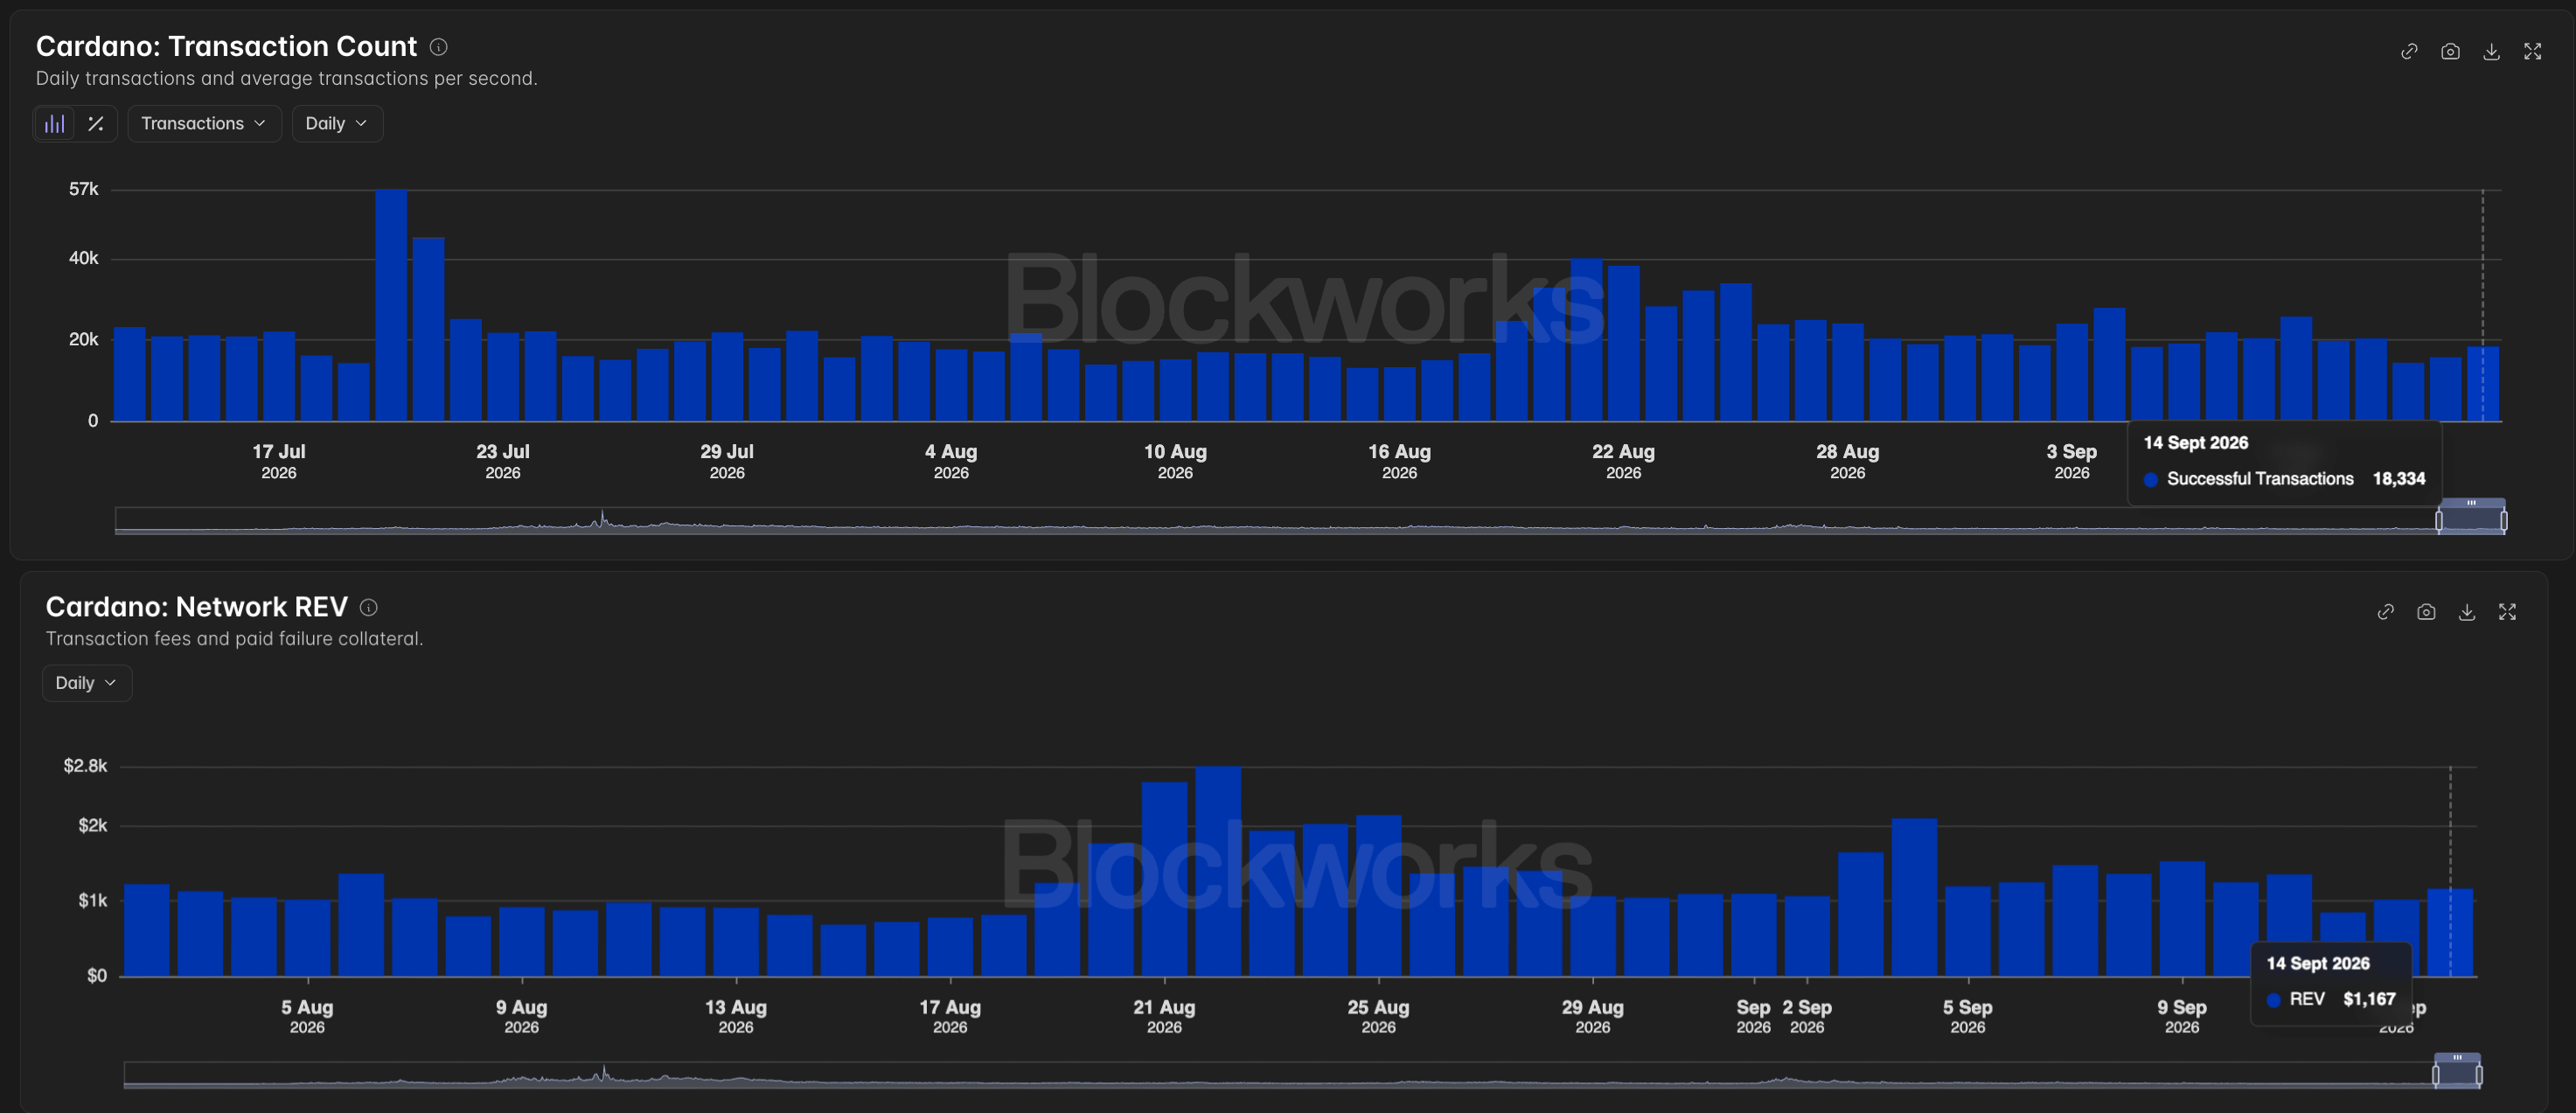
Cardano on-chain data. Source: Blockworks

On the derivatives side, metrics show sell-side dominance. CoinGlass data shows that ADA futures Open Interest (OI) is down over 4% in the last 24 hours to $409.84 million, suggesting a positional wipeout or a reduction in the notional value of active contracts. The $2.77 million in long liquidations over the last 24 hours, out of a total of $2.90 million in liquidations, reaffirms the wipeout of bullish positions.

However, the ADA OI-weighted funding rate remains positive, at 0.0030%, down from 0.0051% the previous day, suggesting that traders are shifting away from long-side positional buildup.
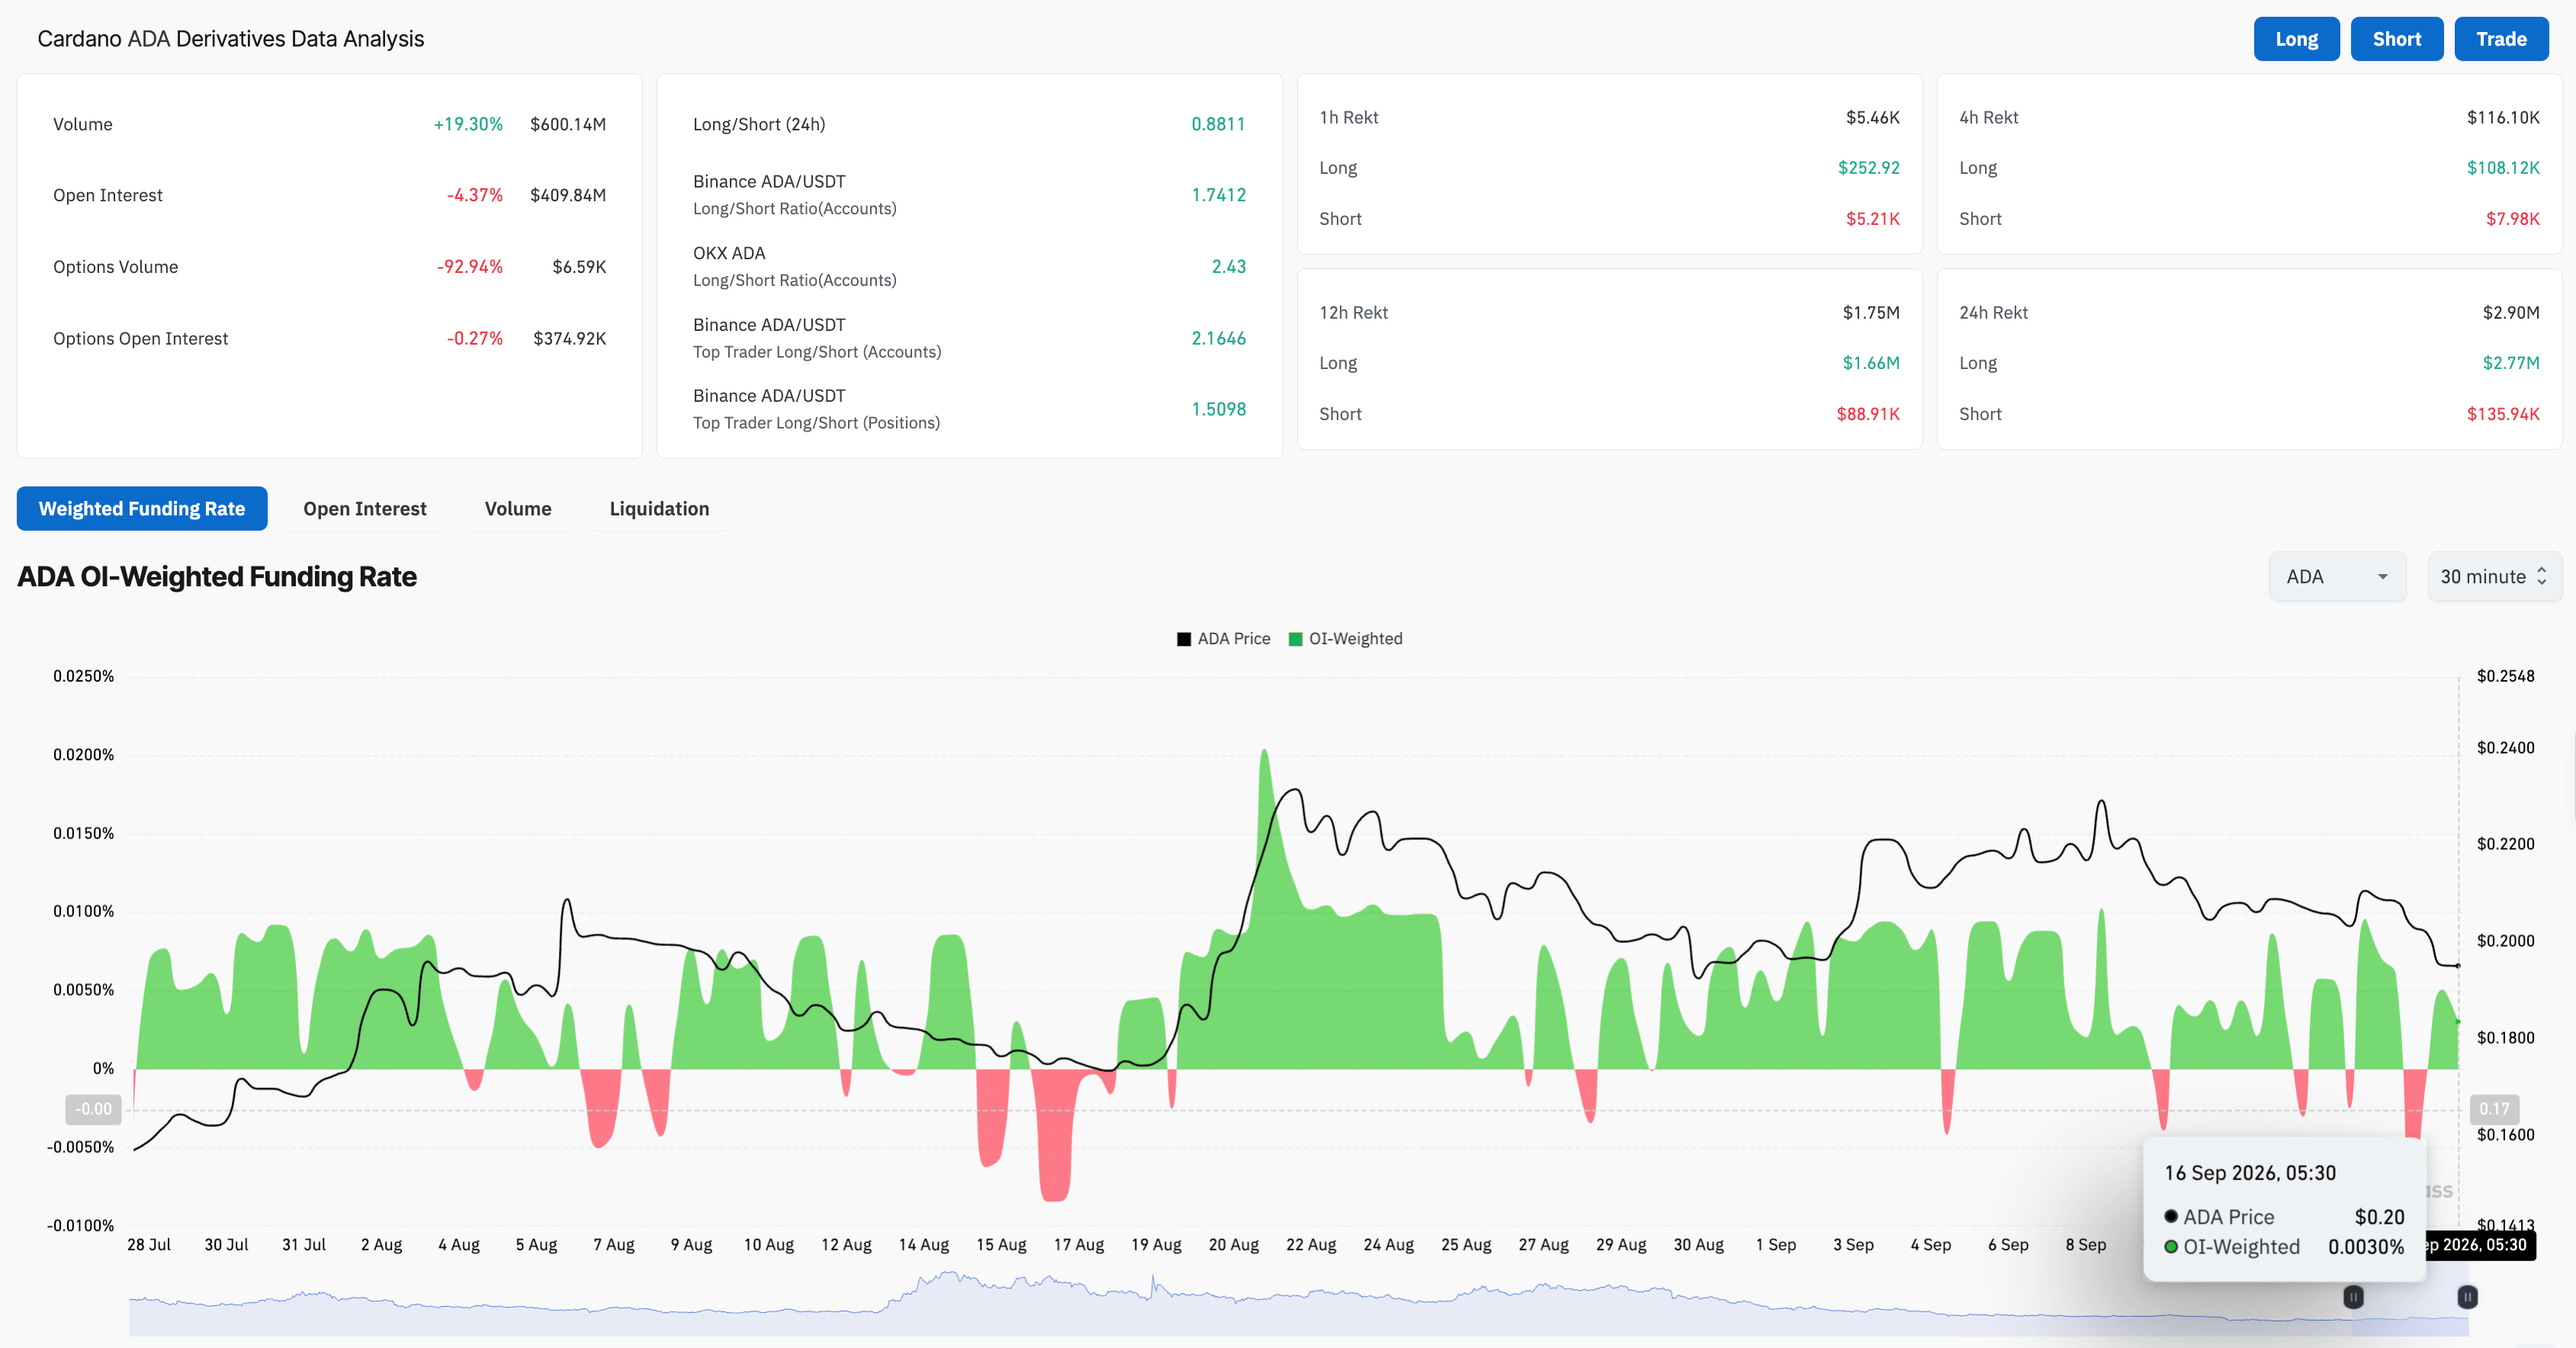
ADA derivatives data. Source: CoinGlass

Technical outlook: Cardano’s downside breakout eyes $0.16

Cardano trades around $0.1900 on Wednesday, keeping a bearish near-term tone after a 6% drop the previous day. This pullback broke below the 50-day and 100-day Exponential Moving Averages (EMAs) at $0.1994 and $0.2002, respectively, while the 200-day EMA looms much higher near $0.2442.

In addition, Cardano slips below the 50% retracement level of the downswing from $0.2887 to $0.1385, at $0.1999, reaffirming the bearish bias. The next support band for ADA emerges at the 23.6% Fibonacci retracement level of $0.1647, indicating a 15% downside risk from the current market price.

The Relative Strength Index (RSI) hovers around 44, hinting at subdued buying interest, and the Moving Average Convergence Divergence (MACD) and signal line extend a declining trend, with an expanding bearish profile, together reinforcing the view of firm downside momentum.

Chart Analysis ADA/USDT (Binance)
ADA/USDT daily price chart.

On the topside, initial resistance is defined by the 50-day EMA at $0.1994, followed closely by the 100-day EMA at $0.2002, with an additional hurdle at the 50% retracement level around $0.1999. Any sustained recovery toward the 200-day EMA at $0.2442 would first need to overcome these layers of supply.

(The technical analysis of this story was written with the help of an AI tool. Know more.)

Disclaimer: For information purposes only. Past performance is not indicative of future results.
placeholder
US August CPI lands tonight: after a 5.4% PPI shock, will the Fed hike on September 16?US August PPI came in at 5.4% year-on-year, above the 5.3% consensus, with core PPI at 4.6%. Traders have pushed the odds of a 25bp Fed hike on September 15-16 to around 70%. Tonight's CPI is the last major inflation print before the decision — here is the full calendar, the consensus numbers, and what a hot versus cool reading would mean for the dollar, yields, gold and stocks.
Author  Irene Q.
Sep 11, Fri
US August PPI came in at 5.4% year-on-year, above the 5.3% consensus, with core PPI at 4.6%. Traders have pushed the odds of a 25bp Fed hike on September 15-16 to around 70%. Tonight's CPI is the last major inflation print before the decision — here is the full calendar, the consensus numbers, and what a hot versus cool reading would mean for the dollar, yields, gold and stocks.
placeholder
Brent tests $108 as a key export pipeline stays shut — can the rally clear $110?Brent crude rose 2.55% to $106.97 and WTI 2.32% to $102.30 as a major regional export pipeline remained offline with no restart timeline. Front-month backwardation has widened to $5.53 from $3.84 a week ago, European gas is at its highest since December 2022, and one analyst sees $119.48 if talks stall.
Author  Irene Q.
Sep 14, Mon
Brent crude rose 2.55% to $106.97 and WTI 2.32% to $102.30 as a major regional export pipeline remained offline with no restart timeline. Front-month backwardation has widened to $5.53 from $3.84 a week ago, European gas is at its highest since December 2022, and one analyst sees $119.48 if talks stall.
placeholder
Fed hike odds near 90% into Wednesday's decision — how to trade the dollar, gold and the S&P 500A 0.3% monthly core CPI print has lifted the market-implied probability of a 25bp Fed hike on 16 September to roughly 86.5% ~ 90%, which would be the first increase since July 2023. Here is the decision timeline, the pricing versus the forecasts, both scenarios, and the key levels for the dollar, gold and the S&P 500.
Author  Suzie
Sep 14, Mon
A 0.3% monthly core CPI print has lifted the market-implied probability of a 25bp Fed hike on 16 September to roughly 86.5% ~ 90%, which would be the first increase since July 2023. Here is the decision timeline, the pricing versus the forecasts, both scenarios, and the key levels for the dollar, gold and the S&P 500.
placeholder
Gold falls below $4,300 as higher US yields bolster Fed rate hike betsGold price (XAU/USD) tumbles to near $4,295 during the early Asian session on Tuesday. The precious metal faces some selling pressure as rising bond yields and surging energy prices strengthen expectations that the US Federal Reserve (Fed) will raise interest rates this week. 
Author  FXStreet
Yesterday 01: 23
Gold price (XAU/USD) tumbles to near $4,295 during the early Asian session on Tuesday. The precious metal faces some selling pressure as rising bond yields and surging energy prices strengthen expectations that the US Federal Reserve (Fed) will raise interest rates this week. 
placeholder
【Daily Brief】10-year Treasury yield briefly tops 5%, S&P 500 slips to 7,602 and the dollar firms at 99.3 as the Fed's decision eve beginsThe 10-year Treasury yield touched 5.014% on Monday — its first print above 5% since October 2023 — while the S&P 500 closed 0.48% lower at 7,619.98 and the dollar index firmed to 99.3. Here is the full market wrap ahead of Wednesday's FOMC decision, the dot plot and the August retail sales report, plus today's CLARITY Act Senate vote.
Author  Irene Q.
23 hours ago
The 10-year Treasury yield touched 5.014% on Monday — its first print above 5% since October 2023 — while the S&P 500 closed 0.48% lower at 7,619.98 and the dollar index firmed to 99.3. Here is the full market wrap ahead of Wednesday's FOMC decision, the dot plot and the August retail sales report, plus today's CLARITY Act Senate vote.
Related Instrument
goTop
quote