


Crypto Overview: Bitcoin falls to $75,000 as CLARITY Act fails to advance – Pi Network, Injective lead losses
- Bitcoin hovers around $75,000 on Wednesday following a 3% decline the previous day.
- US Senate fails to advance the CLARITY Act to a cloture vote, wiping out over $600 million from the crypto market.
- Pi Network and Injective are leading losses over the last 24 hours, emerging as the weakest performers.
Bitcoin (BTC) price trades around $75,000 on Wednesday, following a 3% decline the previous day as the US Senate failed to advance the CLARITY Act to a cloture vote. The broader cryptocurrency market's risk-on sentiment eases, with over $600 million in liquidations in 24 hours, driven primarily by long-position unwinding. Pi Network and Injective are leading losses over the last 24 hours, emerging as the weakest performers.
CLARITY Act failed to reach the voting floor
The US Senate on Tuesday voted against advancing the CLARITY Act to a cloture vote by a vote of 49-50. This keeps the crypto market structure legislation in limbo, which would divide regulatory oversight between the Securities and Exchange Commission (SEC) and the Commodity Futures Trading Commission (CFTC).
Still, both agencies have indicated that they are prepared to pursue changes to the regulatory framework using their existing authority, as previously reported by FXStreet.
Crypto market sentiment takes a hit
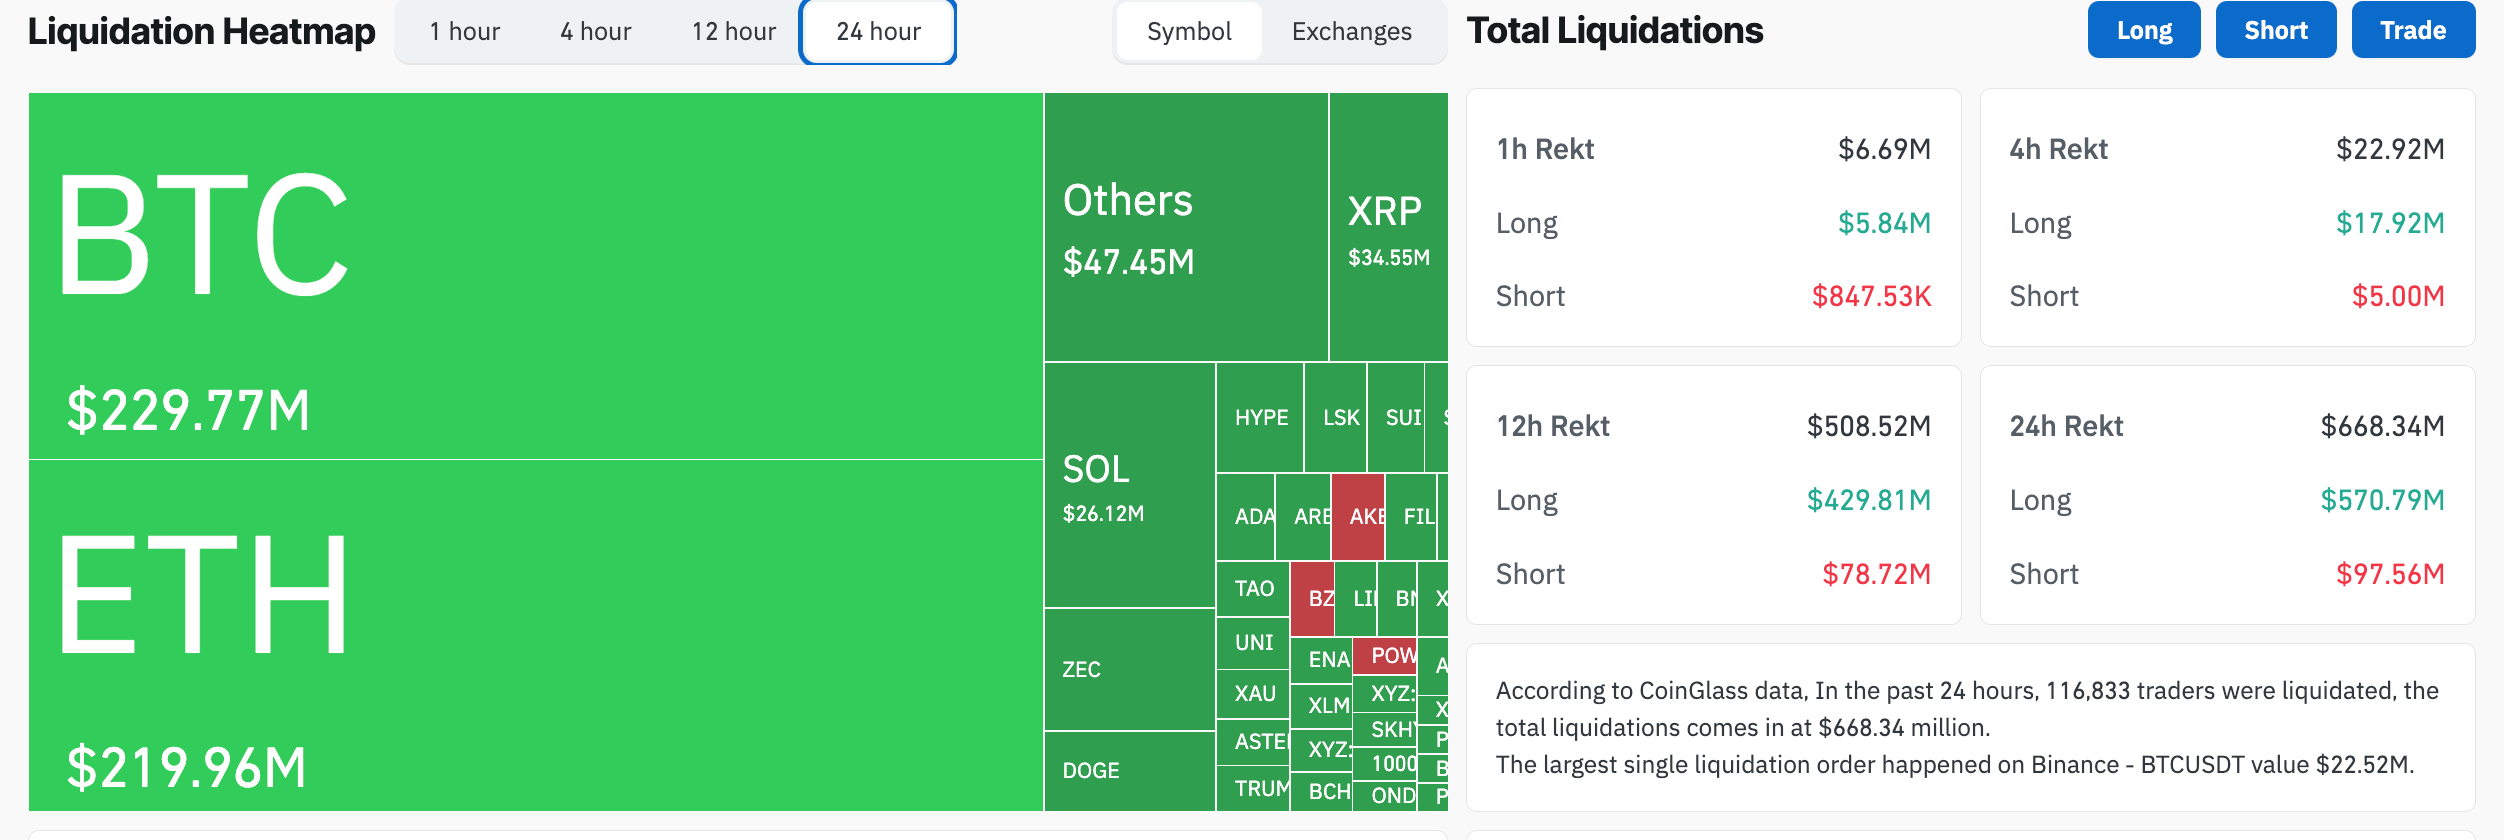
The failure of the CLARITY Act to reach the Senate floor eased excess demand in the crypto market. CoinGlass data shows that $570 million in long positions were liquidated in the last 24 hours, out of $668 million in total liquidations, reflecting a sell-side bias.
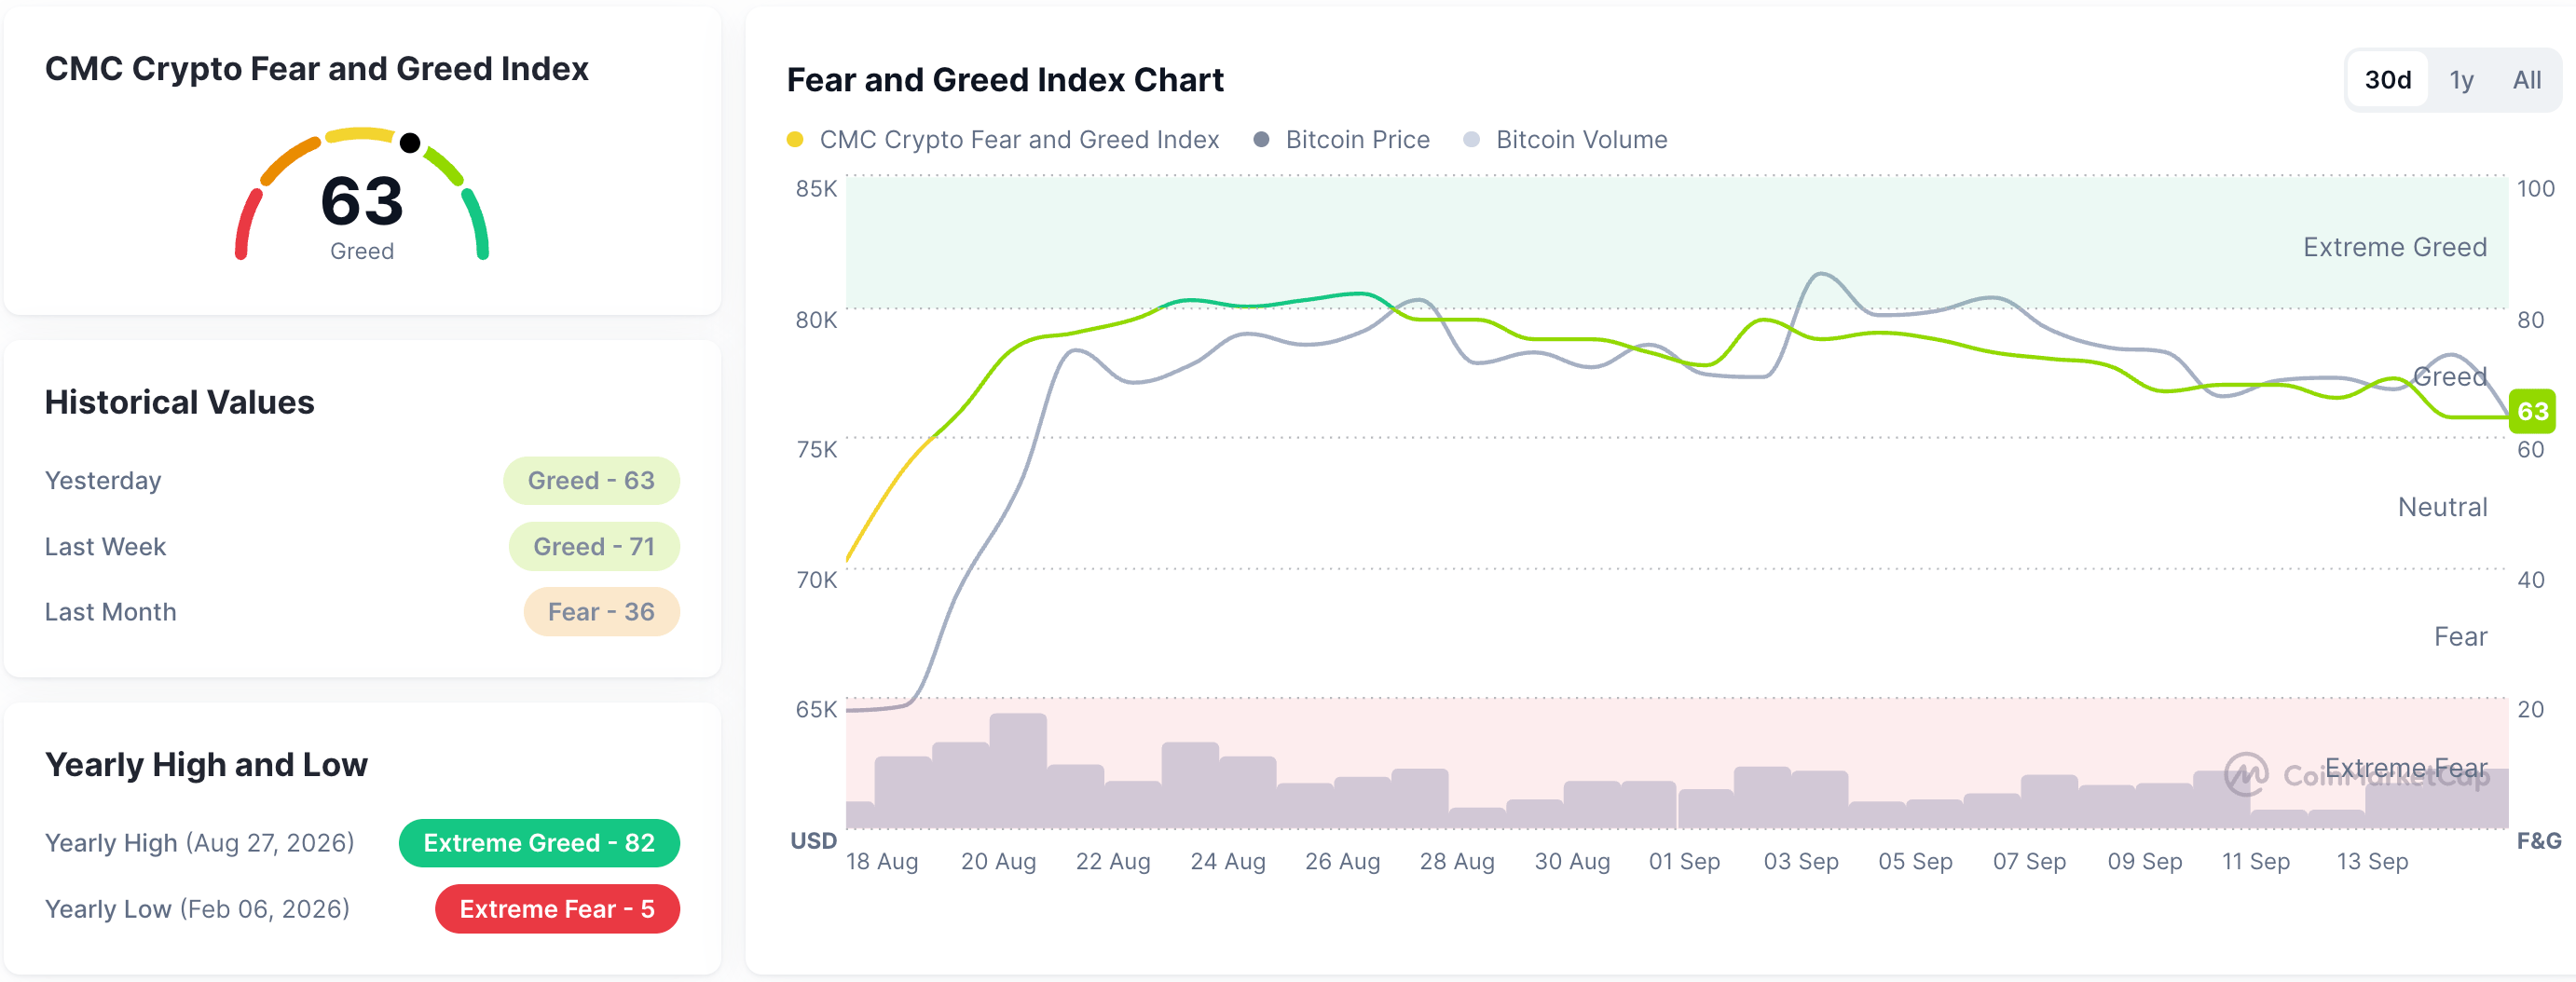
CoinMarketCap’s data shows the Fear and Greed Index is down to 63 on Wednesday, from 71 last week, signaling reduced risk appetite in the crypto market. A dip below 60 would confirm a more neutral sentiment among crypto investors, making a sustained recovery difficult.
Bitcoin risks a steeper correction
Bitcoin hovers around $75,500 at press time on Wednesday, holding steady following a 3% drop the previous day. Still, BTC maintains a constructive bias, sustaining above the 50% retracement level of the downswing from $97,924 to $57,800 at $75,233.
In addition, the price hovers above the key Exponential Moving Averages (EMAs), with the 50-day EMA near $73,566 and the 200-day EMA near $73,052, reinforcing an underlying bullish structure.
The Relative Strength Index (RSI) has eased back toward the neutral 48 zone while the Moving Average Convergence Divergence (MACD) declines toward the zero line, with an expanding bearish profile, suggesting waning upside momentum.
On the downside, immediate support is provided by the 50% retracement level at $75,233, backed by a structural band formed by the 50-day EMA at $73,566 and the 200-day EMA at $72,052. A deeper pullback would find support at the 100-day EMA near $71,385 and the 23.6% retracement around $65,458, potentially stemming further downside.
Looking up, initial resistance aligns with the broken support trendline near $82,850, followed by the 78.6% Fibonacci retracement near $87,476.
Pi Network and Injective face intense selling pressure
Pi Network is down 5% on Wednesday, extending a 7% decline from the previous day. The PI token maintains a clear bearish bias as price remains below the 50-day and 100-day EMAs at roughly $0.0941 and $0.1046, and beneath the broader 200-day EMA near $0.1377.
The pair has slipped just above the 50% Fibonacci retracement at $0.0971, measured from $0.1341 to $0.0704, reaffirming the bearish bias.
Momentum eases on the daily chart, with the RSI around 39 hinting at renewed downside pressure, while the MACD crosses below its signal line, indicating a new bearish profile and reinforcing dominant downside pressure.
The immediate support for PI aligns with the 23.6% Fibonacci retracement level at $0.0819, followed by the $0.0704 swing low.
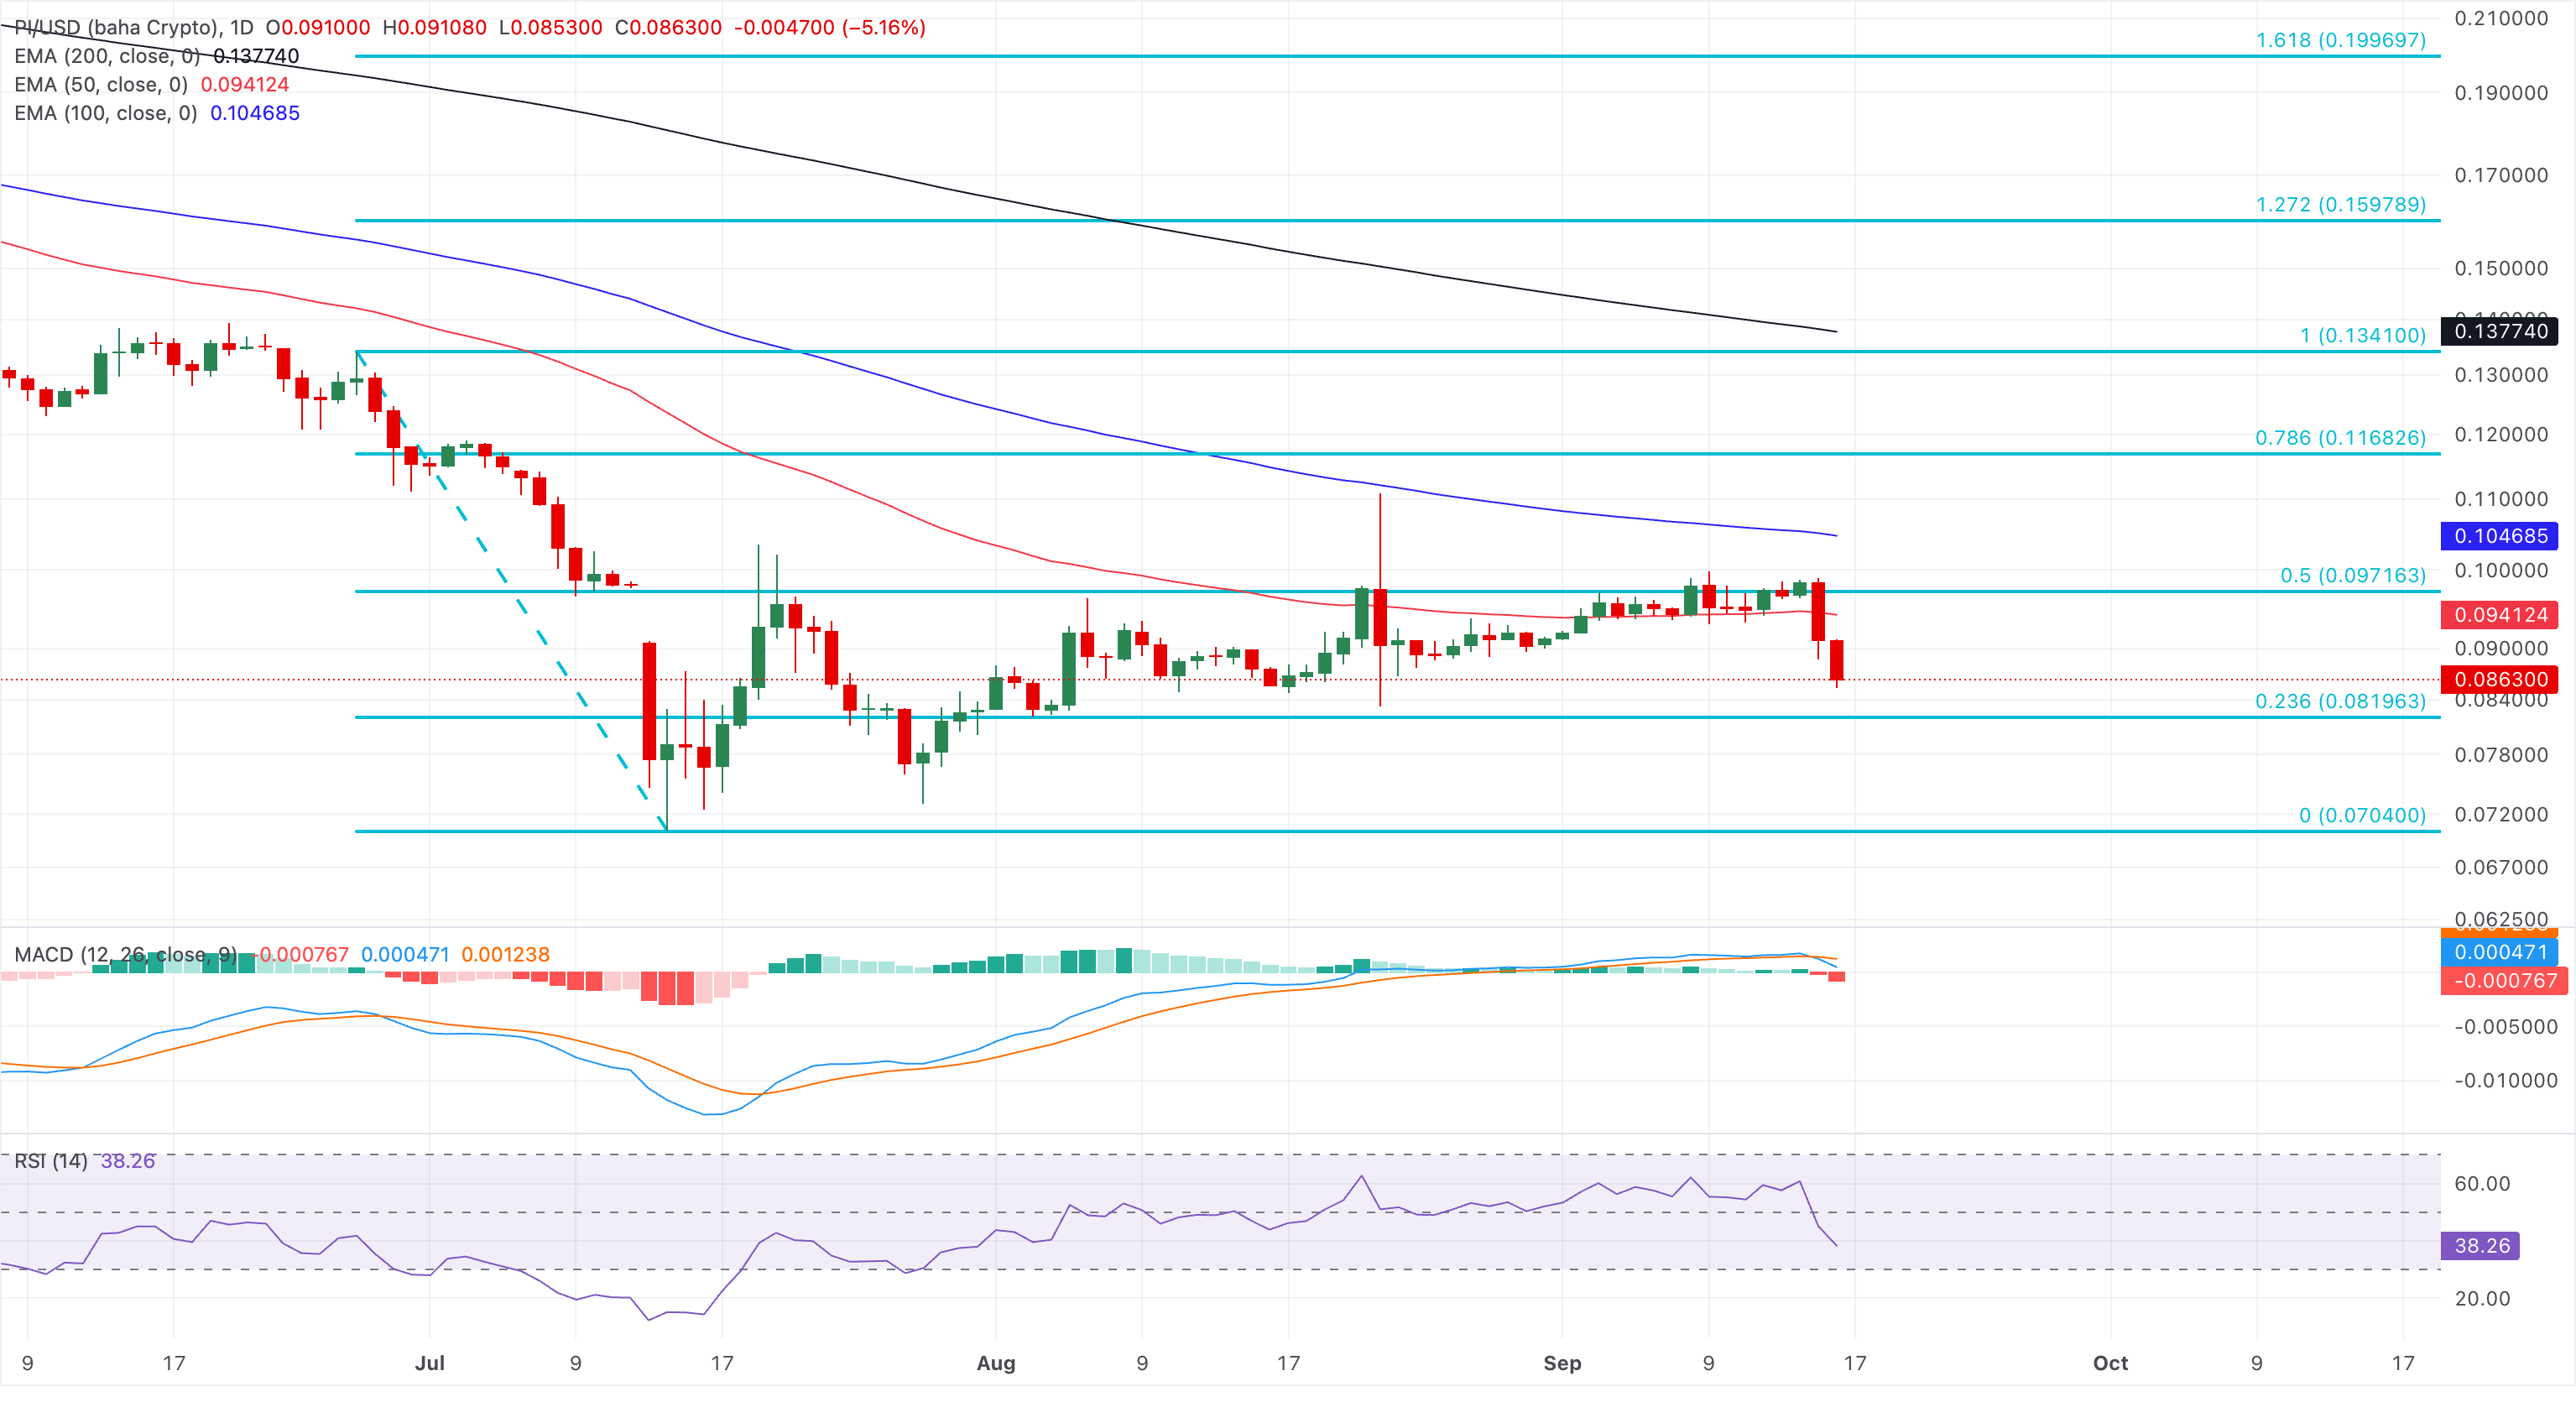
On the topside, initial resistance comes at the 50-day EMA around $0.0941, closely followed by the 50% Fibonacci retracement at $0.0971, forming a tight supply cluster. Further barrier emerges at the 100-day EMA at $0.1046, reinforcing this mid-range resistance band.
Injective hovers around $5.3790 on Wednesday, following a 13% drop the previous day. Still, price reflects a constructive medium-term tone, trading above the 50-day and 200-day EMAs at $5.2380 and $5.1121, respectively, suggesting the broader uptrend structure remains intact despite a flattening bias.
The RSI at around 49 signals neutral momentum, while the MACD has slipped below its signal line, hinting that upside traction is moderating rather than collapsing.
Injective tests the 50% retracement of the downswing from $7.3450 to $3.9570, at $5.3911 as the immediate support, followed by the 50-day and 200-day EMAs at $5.2380 and $5.1121.
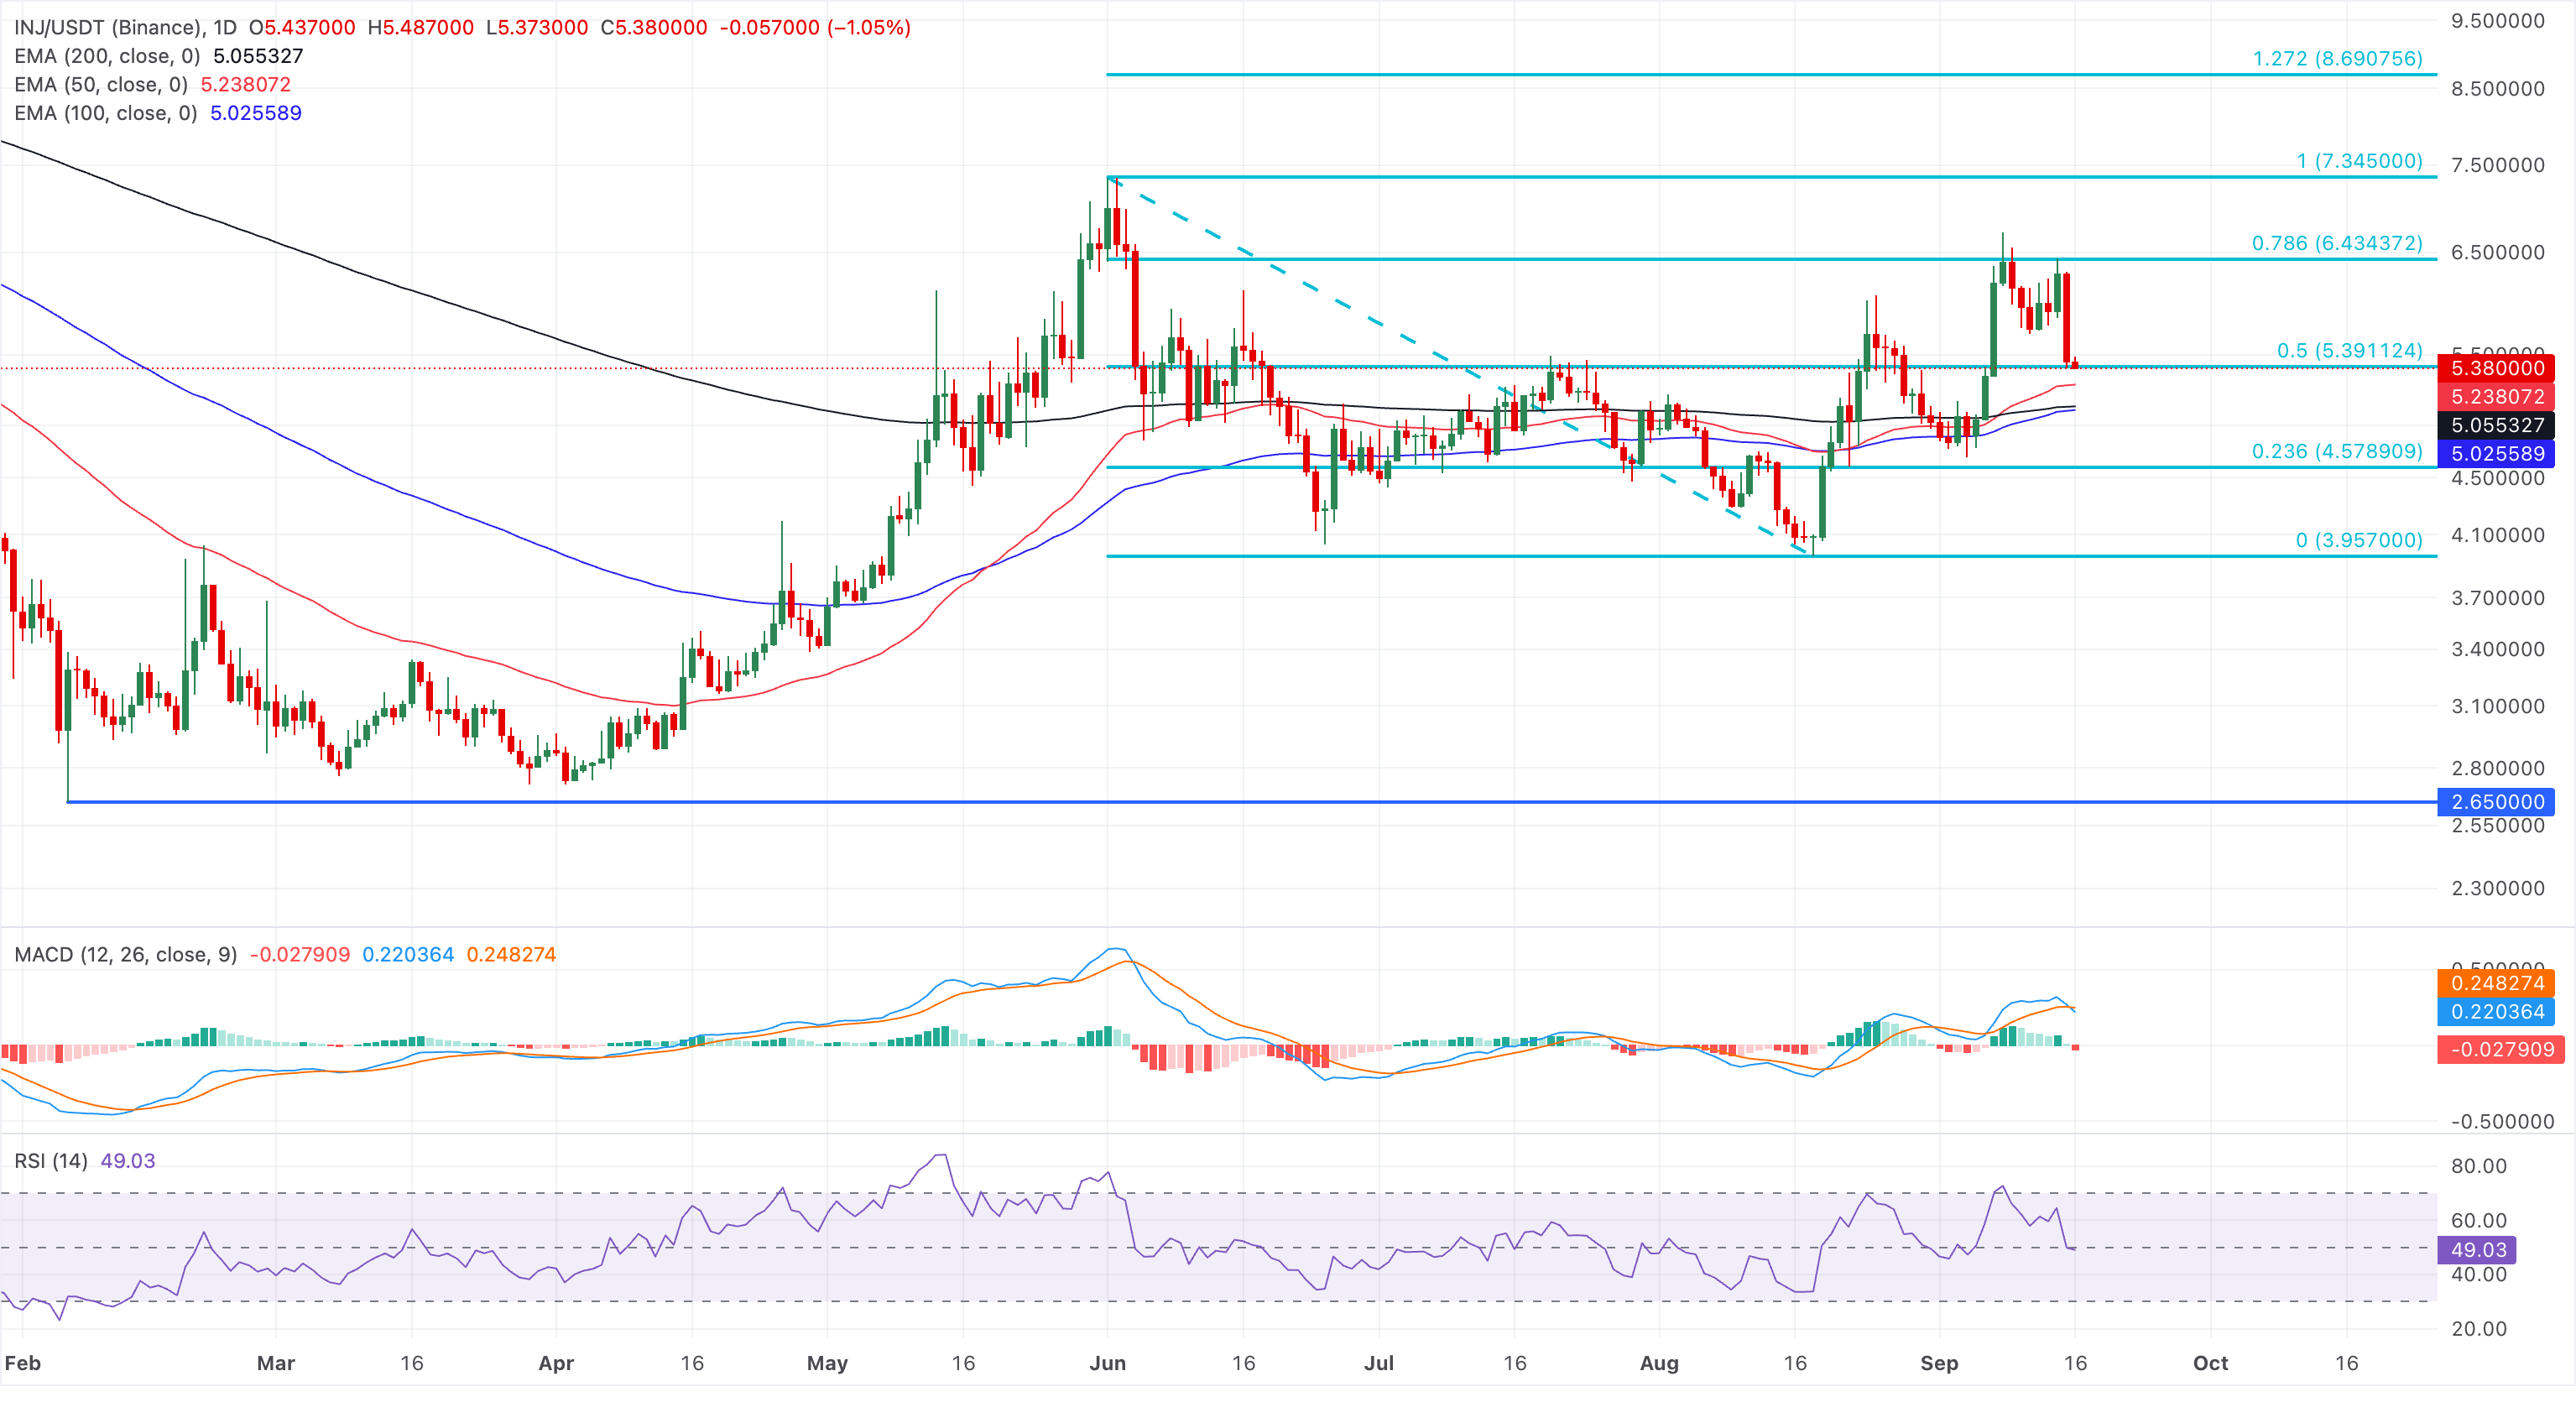
A potential rebound in INJ could face opposition at the 78.6% Fibonacci retracement level at $6.4343, which capped gains twice earlier this month.
(The technical analysis of this story was written with the help of an AI tool. Know more.)
Recommended Articles


