


Bitcoin and Gold Outlook: BTC and XAU remain pressured amid sticky US-Iran tensions
- Bitcoin’s sell-off extends below $79,000 as cryptocurrencies broadly correct on Monday.
- Gold falls for a second consecutive day, testing support at $4,400 as geopolitical tensions stay high.
- US and Iran exchanged strikes over the weekend, with Tehran threatening intense retaliation.
Bitcoin (BTC) is correcting below $79,000 on Monday, mirroring the broader cryptocurrency market’s lethargic, bearish-shifting outlook. The Crypto King was rejected near $81,500 last Thursday, suggesting investor exhaustion.
Meanwhile, Gold (XAU/USD) remains pressed against the near-term $4,400 support, as focus shifts to the upcoming United States (US) Consumer Price Index (CPI) data on Friday. Investors are currently pricing in 60% odds that the Federal Reserve (Fed) will adopt a stricter monetary policy, raising interest rates in the 3.75%-4.00% range.
US-Iran exchange strikes, weighing on Bitcoin and Gold
Over the weekend, the US military struck three Iran-linked oil tankers in the Gulf of Oman, reportedly disabling two and destroying the third. In retaliation, Iran targeted three US-affiliated vessels and three additional oil tankers attempting to transit the Strait of Hormuz.
Tehran also announced plans to declare a restricted zone near the strait and to unveil a new shipping route with Oman in the coming days. The exclusion zone will be used to stop shipping vessels attempting to transit through the strait without Iranian permission.
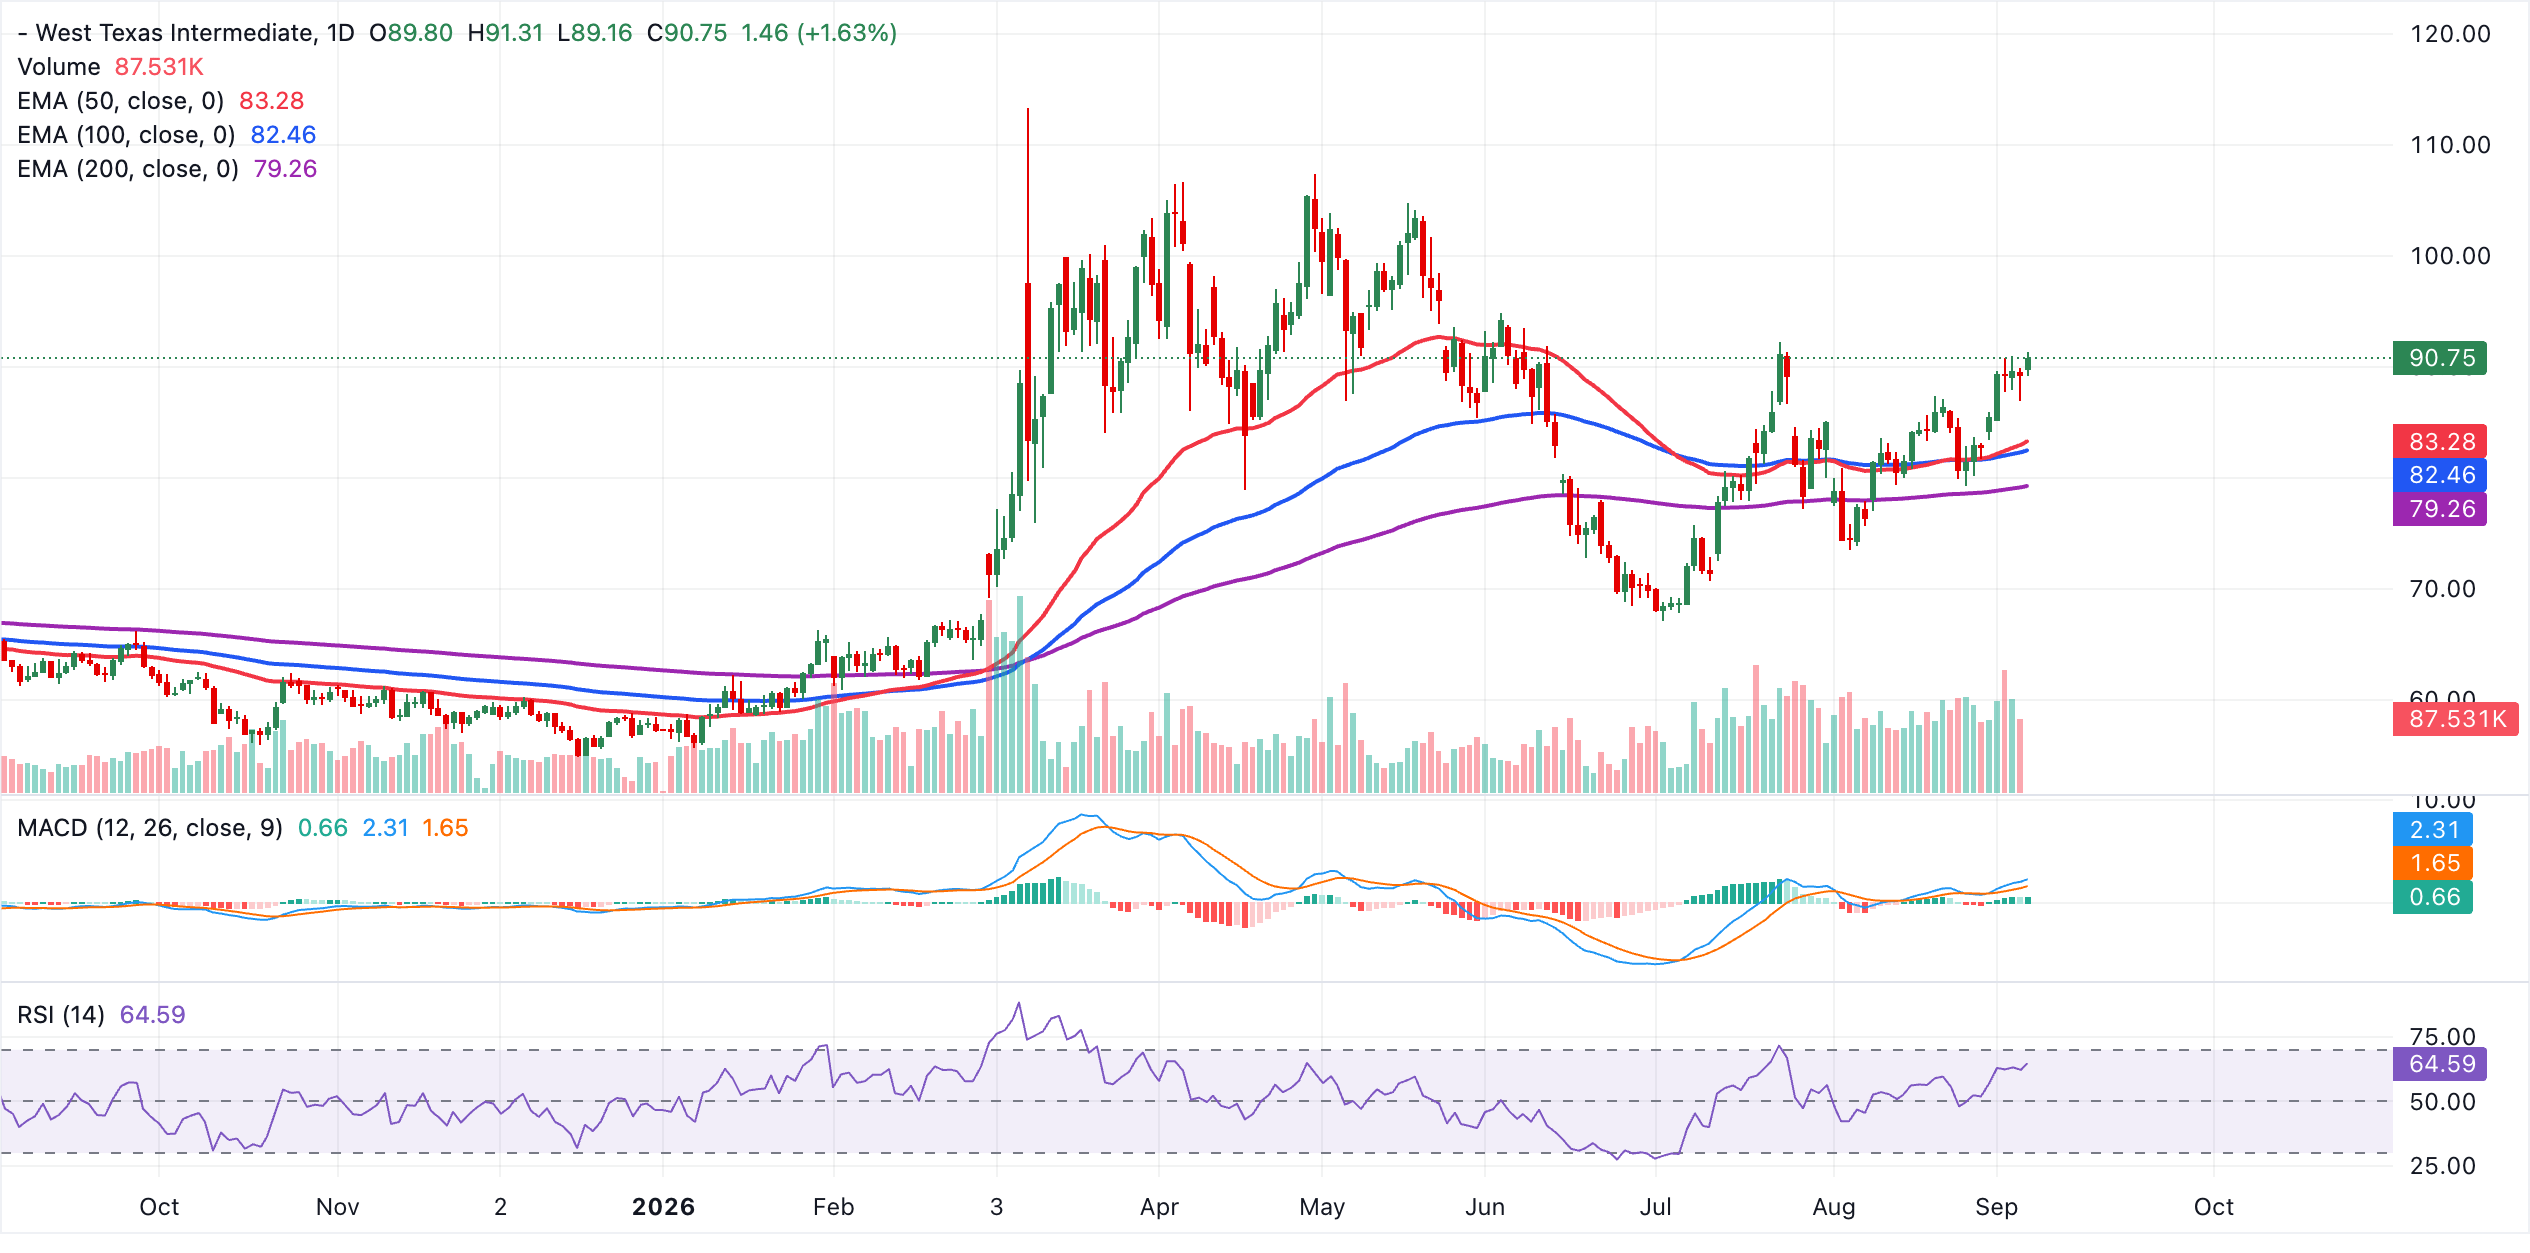
West Texas Intermediate (WTI) Crude Oil has risen above $90.00 on Monday, suggesting renewed tensions between the two nations could continue to intensify price pressures.
Technical analysis: Bitcoin slips despite bullish outlook
Bitcoin trades at $78,704, maintaining a constructive bullish bias as price stays well above the 50-day, 100-day, and 200-day Exponential Moving Averages (EMAs), suggesting a firmly supported medium-term uptrend despite the latest pullback from recent highs.
The Relative Strength Index (RSI) at 61 stays in positive territory, hinting that buyers still retain control even as momentum cools from overbought extremes, while the negative drift in the Moving Average Convergence Divergence (MACD) line below its signal and toward the zero line warns of easing upside pressure in the near term.
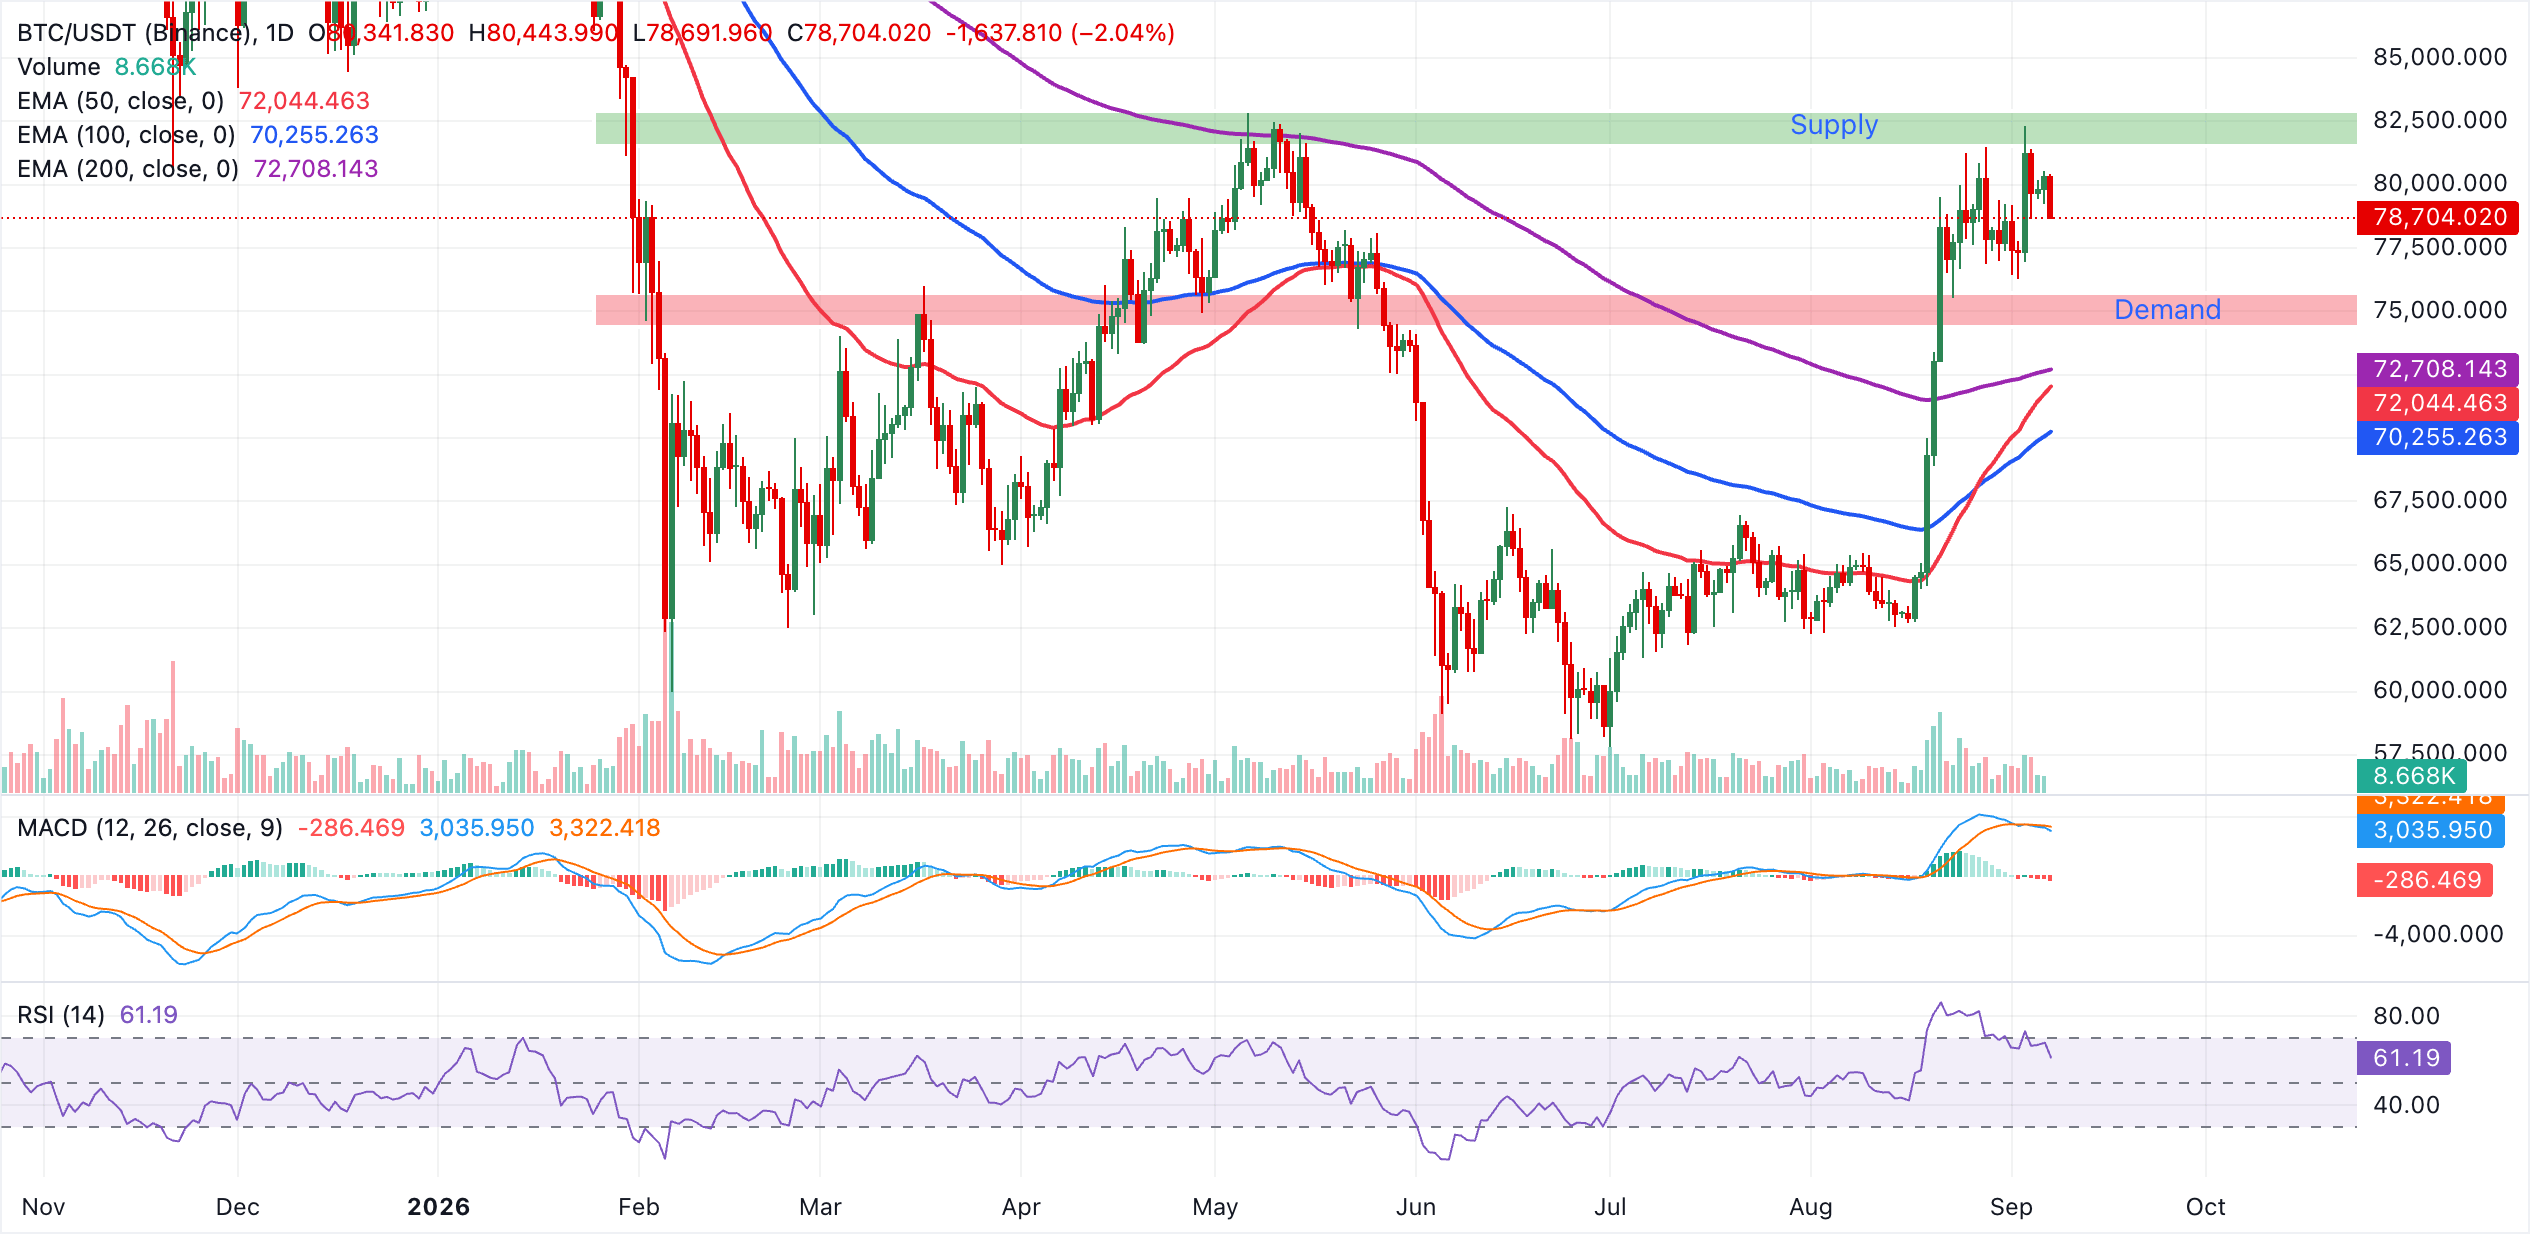
Initial support lies near $72,708, where the 200-day EMA converges with the broader trend floor, followed by the 50-day EMA around $72,044, which reinforces a deeper but still corrective setback within the broader bullish structure.
A more pronounced decline would expose the 100-day EMA at $70,255 as the next key cushion, where dip-buying interest could re-emerge if sentiment remains broadly constructive. As long as price holds above this EMA stack, the path of least resistance is likely to remain to the upside, with any fresh highs above current levels needed to re-energize the bullish leg.
Gold technical outlook: XAU presses against key support
Gold trades at $4,412 and holds above the 50-day, 100-day and 200-day EMAs, which cluster between roughly $4,318 and $4,368 and suggest the broader uptrend remains supported despite the recent pullback.
The RSI at about 51 is neutral to slightly positive, while the MACD sits in negative territory with its recent downturn hinting that bullish momentum is still fragile.
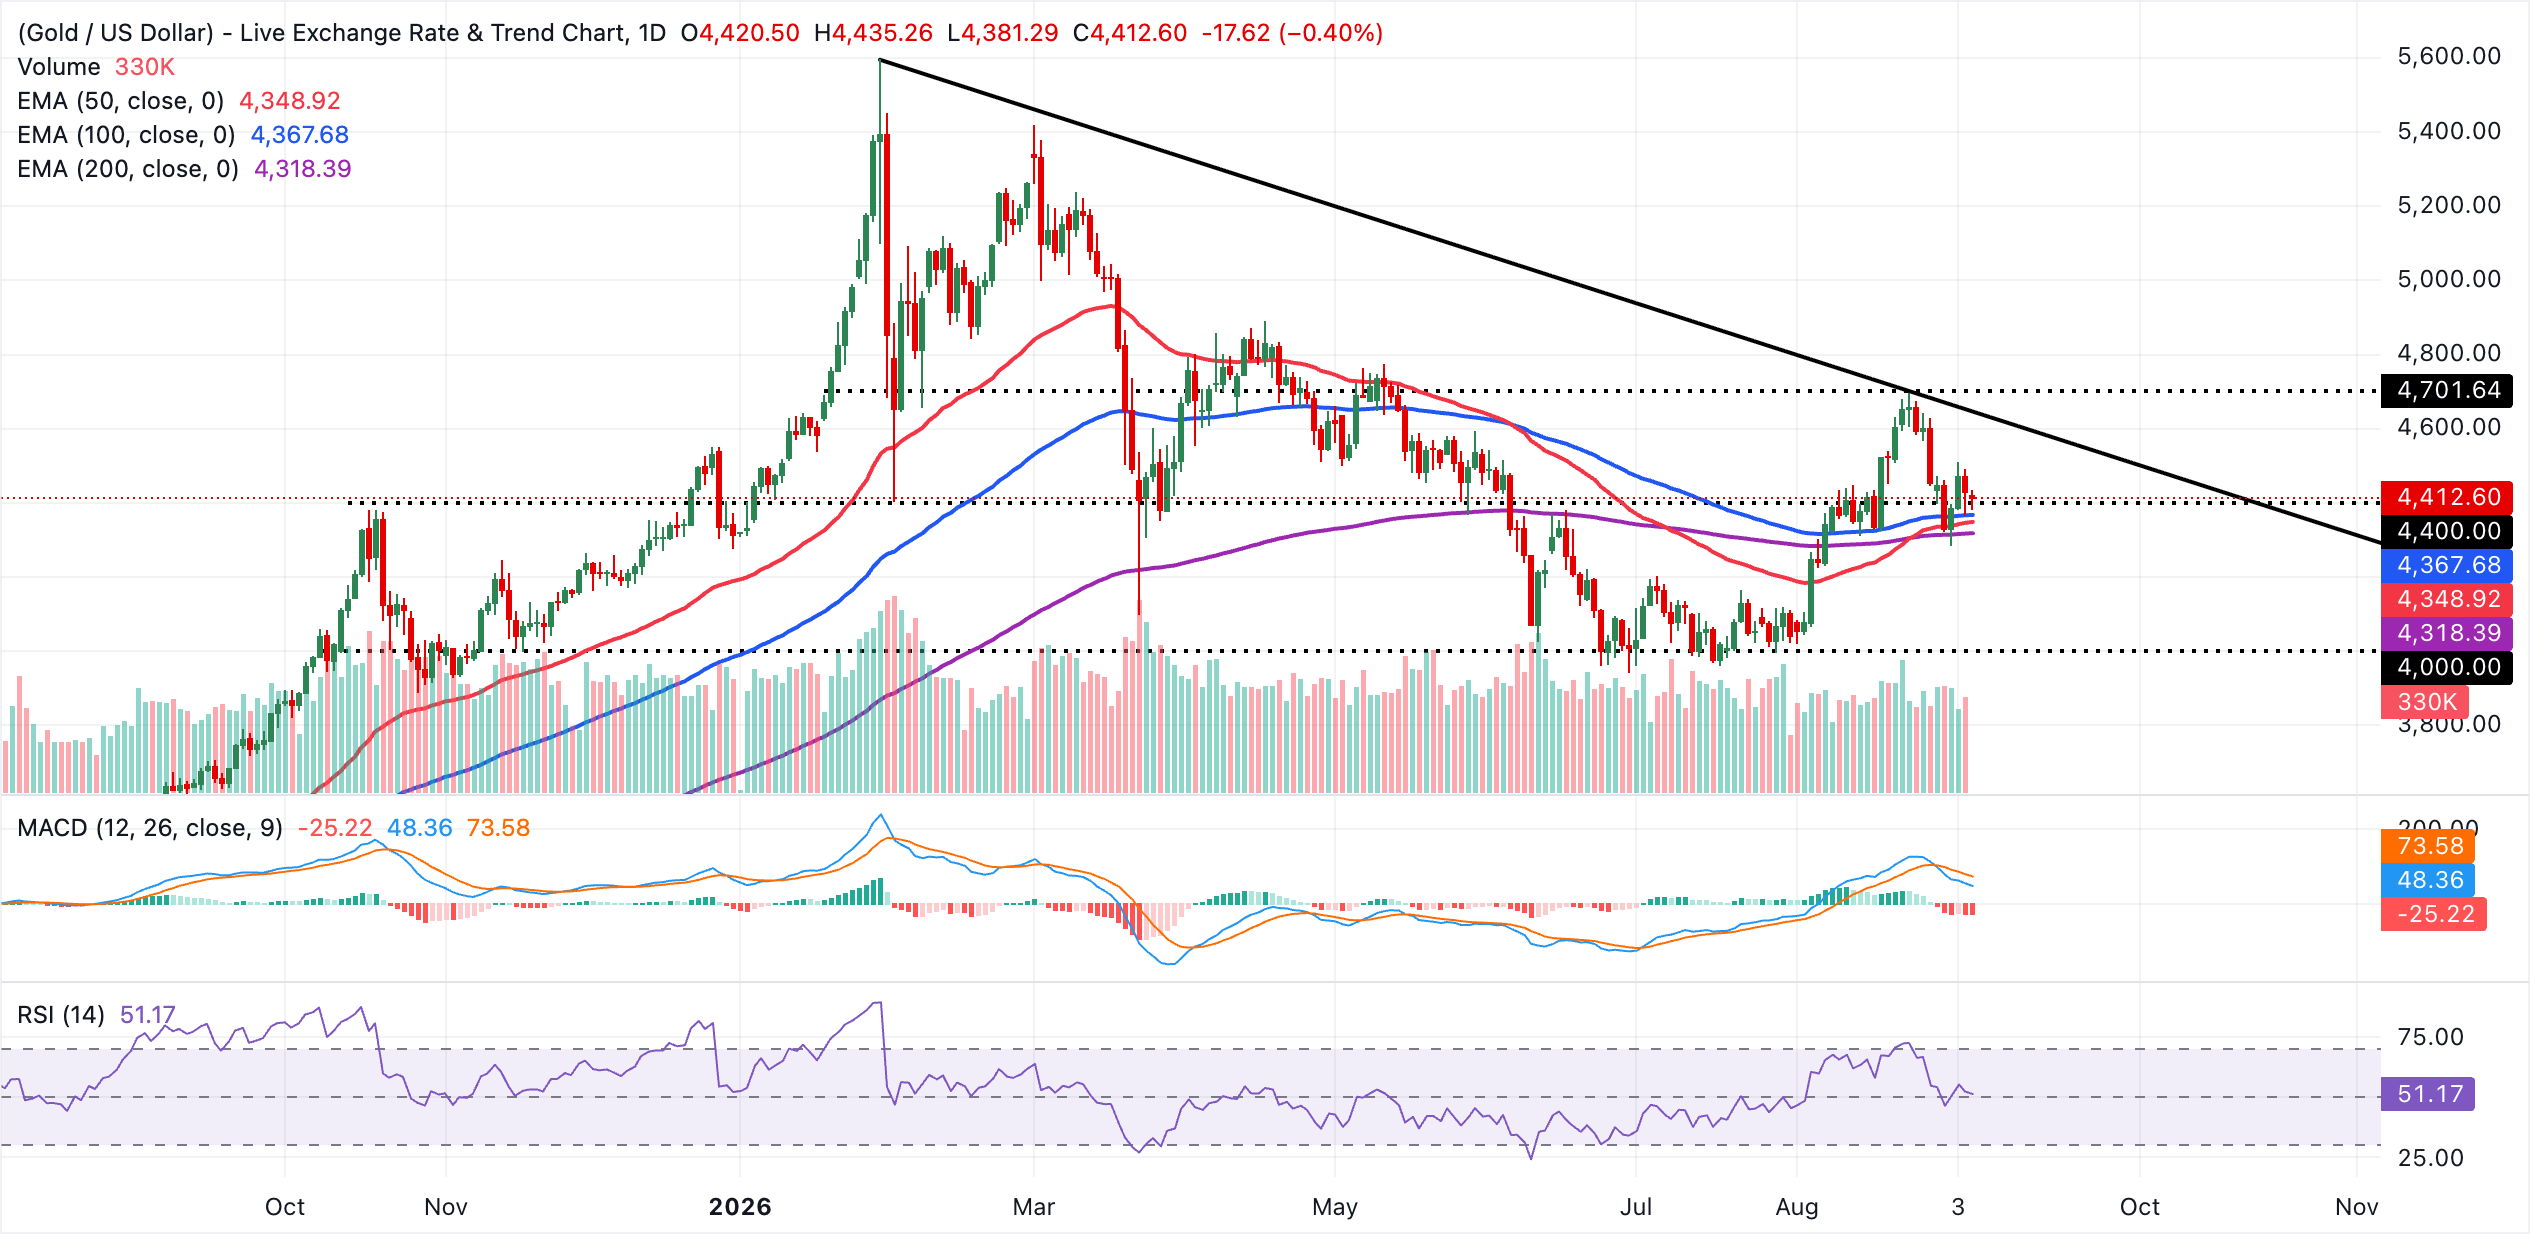
Initial resistance lies at the next psychological level at $4,500, followed by the downward resistance trendline, with its latest break reference near $4,528. A sustained move above this barrier would reopen the way toward higher highs. On the downside, immediate support is seen at the 100-day EMA around $4,368, followed by the 50-day EMA near $4,349 and then the 200-day EMA at about $4,318, where buyers would be expected to defend the prevailing bullish structure.
(The technical analysis of this story was written with the help of an AI tool. Know more.)
Bitcoin, altcoins, stablecoins FAQs
Bitcoin is the largest cryptocurrency by market capitalization, a virtual currency designed to serve as money. This form of payment cannot be controlled by any one person, group, or entity, which eliminates the need for third-party participation during financial transactions.
Altcoins are any cryptocurrency apart from Bitcoin, but some also regard Ethereum as a non-altcoin because it is from these two cryptocurrencies that forking happens. If this is true, then Litecoin is the first altcoin, forked from the Bitcoin protocol and, therefore, an “improved” version of it.
Stablecoins are cryptocurrencies designed to have a stable price, with their value backed by a reserve of the asset it represents. To achieve this, the value of any one stablecoin is pegged to a commodity or financial instrument, such as the US Dollar (USD), with its supply regulated by an algorithm or demand. The main goal of stablecoins is to provide an on/off-ramp for investors willing to trade and invest in cryptocurrencies. Stablecoins also allow investors to store value since cryptocurrencies, in general, are subject to volatility.
Bitcoin dominance is the ratio of Bitcoin's market capitalization to the total market capitalization of all cryptocurrencies combined. It provides a clear picture of Bitcoin’s interest among investors. A high BTC dominance typically happens before and during a bull run, in which investors resort to investing in relatively stable and high market capitalization cryptocurrency like Bitcoin. A drop in BTC dominance usually means that investors are moving their capital and/or profits to altcoins in a quest for higher returns, which usually triggers an explosion of altcoin rallies.
Recommended Articles


