

Top Altcoins Price Prediction: Ripple, Cardano, Solana – Bulls defend key support levels

Source Fxstreet
  • Ripple edges higher on Thursday, retesting the 200-day EMA at $1.38.
  • Cardano is up nearly 2% on Thursday, extending its mild 2% rebound from the 50-day EMA at $0.1924 the previous day.
  • Solana hovers around $100, holding above its $98.02 horizontal support level.

Ripple (XRP), Cardano (ADA), and Solana (SOL) show mild gains on Thursday, holding at crucial support levels amid easing bullish momentum. The technical outlook for XRP, ADA, and SOL indicates downside risk as the US-Iran war weighs on the broader crypto market. 

Ripple pulls back below 200-day EMA

Ripple trades around $1.3685 on Thursday, holding a bullish near-term bias as price advances above the 50-day and 100-day Exponential Moving Averages (EMAs) at $1.2227 and $1.2191, respectively.

Despite this constructive positioning, the 200-day EMA at $1.3827 now acts as the overhead barrier. A confirmed breakout above this level could see XRP extend its recovery toward the August 23 high at $1.5507.

The Moving Average Convergence Divergence (MACD) has moved below its signal line, with a slightly expanding negative histogram, suggesting that upside momentum is softening as the Relative Strength Index (RSI) near 60 approaches the neutral zone from overbought territory.

Chart Analysis XRP/USDT (Binance)
XRP/USDT daily price chart.

On the downside, initial demand is seen around the clustered dynamic supports provided by the 50-day and 100-day EMAs near $1.2227 and $1.2191, with deeper structural support traced back toward the prior breakout area around $1.0573.

Cardano rebounds from key support cluster

Cardano is up nearly 2% on Thursday, advancing its 2% rise from the previous day. The mild recovery suggests a constructive near-term bullish bias, with price trading above both the 50-day EMA at $0.1925 and the 100-day EMA at $0.1975 while tracking an upward-sloping support trendline around $0.1838.

However, the broader recovery is still capped by the 200-day EMA at $0.2531 overhead, reinforced by an ascending trendline. Cardano must clear above this zone for a sustained recovery toward the February 2 high at $0.2991.

The MACD declines below its signal line and remains marginally above zero, suggesting that upside momentum is waning, while the RSI, at 54, drops from the overbought zone into neutral territory.
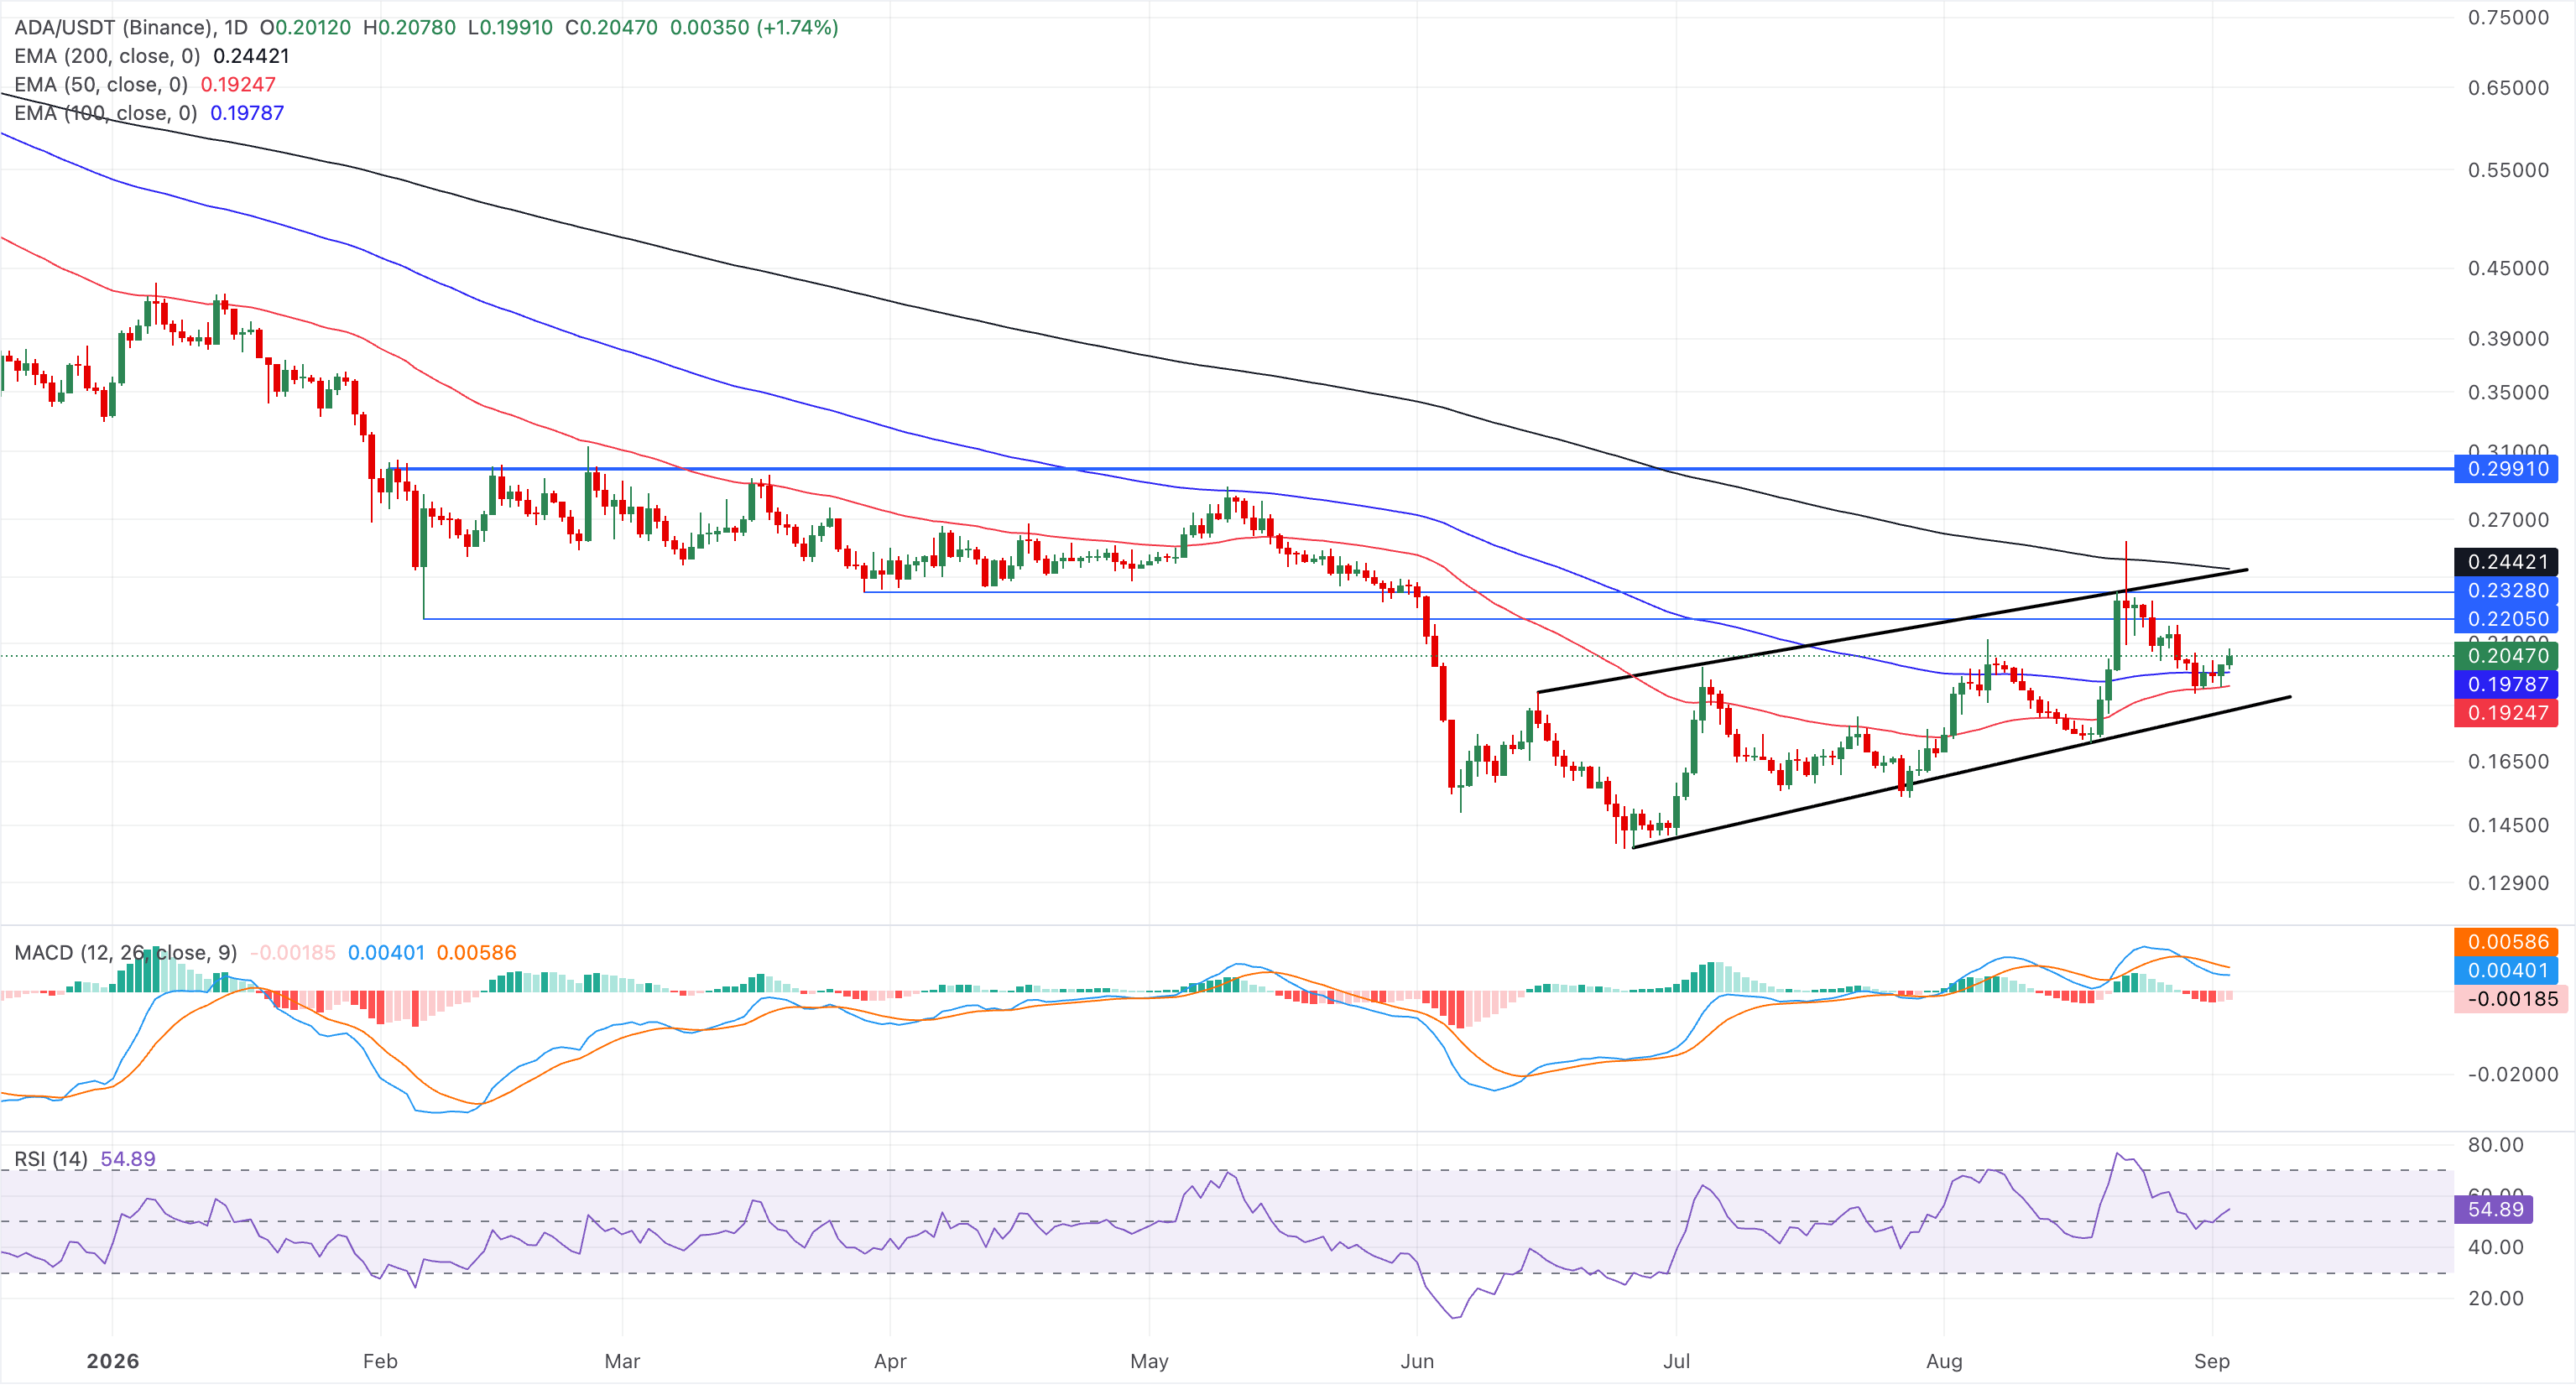
ADA/USDT daily price chart.

Immediate support is seen at the recent $0.2051 area, with stronger demand clustered around the 100-day EMA at $0.1975 and the 50-day EMA at $0.1925.

Solana is back at $100

Solana trades around $100 at press time on Thursday, maintaining a bullish near-term bias as price holds above the 50-, 100- and 200-day EMAs clustered between roughly $83.85 and $93.58, which collectively underpin the broader uptrend.

The RSI at 63 is declining from overbought territory, indicating easing bullish momentum, while the MACD has slipped marginally below its signal line, hinting at waning upside momentum.

The next notable structural barrier is the horizontal resistance line at $116.88, marked by the December 18 low, which would come into focus only if buyers extend the ongoing advance.
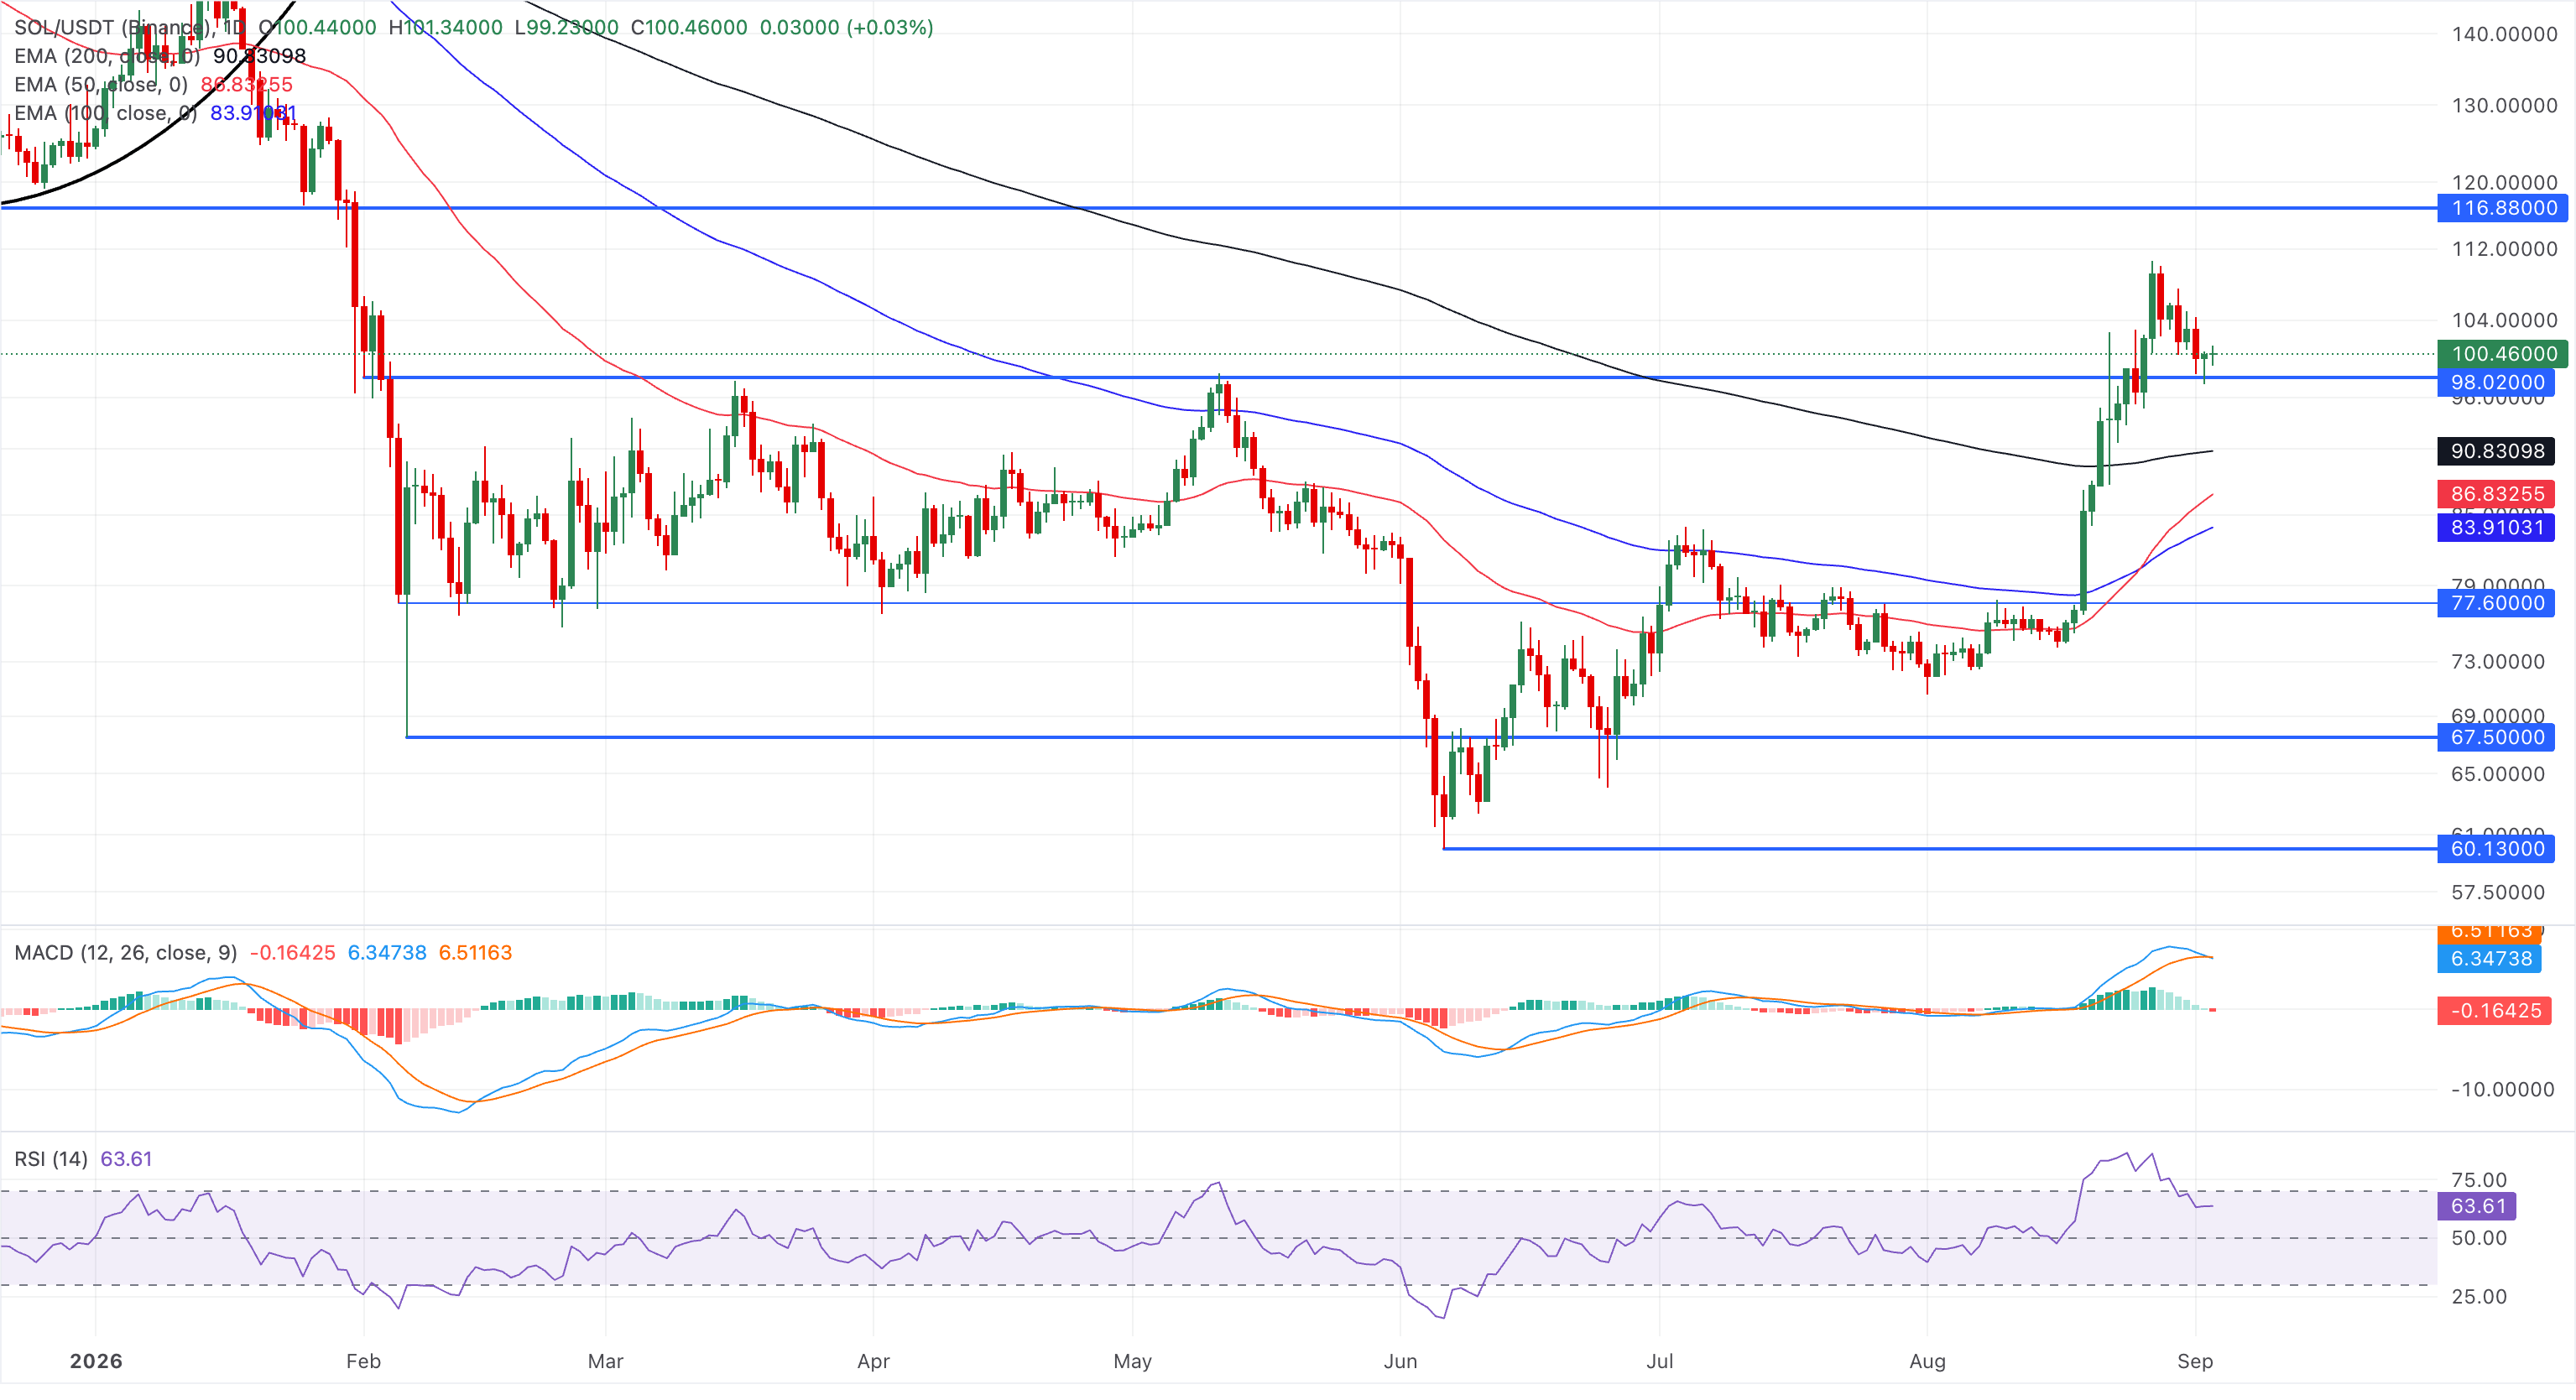
SOL/USDT daily price chart.

On the downside, immediate support is at the current price level near the $100 psychological threshold, reinforced by the February 1 low at $98.02, followed by the 200-day EMA around $93.58.

(The technical analysis of this story was written with the help of an AI tool. Know more.)

Disclaimer: For information purposes only. Past performance is not indicative of future results.
placeholder
US dollar clings to nine-week lows near 98.4 as Brent nears $100 and the yen hits a seven-month high — five events to watch todayThe dollar is pinned near nine-week lows even after a blockbuster jobs report, as an oil spike toward $100, a surging yen and China's reflation data crowd the driver's seat. Five key events to watch today: Brent at $99.46, USD/JPY at 154, China CPI/PPI, PBOC gold buying, and Thursday's PPI / Friday's CPI ahead of the September 15-16 FOMC.
Author  Eric Nkando
Sep 09, Wed
The dollar is pinned near nine-week lows even after a blockbuster jobs report, as an oil spike toward $100, a surging yen and China's reflation data crowd the driver's seat. Five key events to watch today: Brent at $99.46, USD/JPY at 154, China CPI/PPI, PBOC gold buying, and Thursday's PPI / Friday's CPI ahead of the September 15-16 FOMC.
placeholder
US August CPI lands tonight: after a 5.4% PPI shock, will the Fed hike on September 16?US August PPI came in at 5.4% year-on-year, above the 5.3% consensus, with core PPI at 4.6%. Traders have pushed the odds of a 25bp Fed hike on September 15-16 to around 70%. Tonight's CPI is the last major inflation print before the decision — here is the full calendar, the consensus numbers, and what a hot versus cool reading would mean for the dollar, yields, gold and stocks.
Author  Irene Q.
Sep 11, Fri
US August PPI came in at 5.4% year-on-year, above the 5.3% consensus, with core PPI at 4.6%. Traders have pushed the odds of a 25bp Fed hike on September 15-16 to around 70%. Tonight's CPI is the last major inflation print before the decision — here is the full calendar, the consensus numbers, and what a hot versus cool reading would mean for the dollar, yields, gold and stocks.
placeholder
Brent tests $108 as a key export pipeline stays shut — can the rally clear $110?Brent crude rose 2.55% to $106.97 and WTI 2.32% to $102.30 as a major regional export pipeline remained offline with no restart timeline. Front-month backwardation has widened to $5.53 from $3.84 a week ago, European gas is at its highest since December 2022, and one analyst sees $119.48 if talks stall.
Author  Irene Q.
18 hours ago
Brent crude rose 2.55% to $106.97 and WTI 2.32% to $102.30 as a major regional export pipeline remained offline with no restart timeline. Front-month backwardation has widened to $5.53 from $3.84 a week ago, European gas is at its highest since December 2022, and one analyst sees $119.48 if talks stall.
placeholder
Fed hike odds near 90% into Wednesday's decision — how to trade the dollar, gold and the S&P 500A 0.3% monthly core CPI print has lifted the market-implied probability of a 25bp Fed hike on 16 September to roughly 86.5% ~ 90%, which would be the first increase since July 2023. Here is the decision timeline, the pricing versus the forecasts, both scenarios, and the key levels for the dollar, gold and the S&P 500.
Author  Suzie
17 hours ago
A 0.3% monthly core CPI print has lifted the market-implied probability of a 25bp Fed hike on 16 September to roughly 86.5% ~ 90%, which would be the first increase since July 2023. Here is the decision timeline, the pricing versus the forecasts, both scenarios, and the key levels for the dollar, gold and the S&P 500.
placeholder
Silver Price Forecast: XAG/USD falls to near $63.50 amid Fed hike bets, higher oil pricesSilver price (XAG/USD) loses its gains from the previous day, trading around $63.50 per troy ounce during Asian hours on Monday. Non-yielding Silver is currently facing significant headwinds driven by rising Federal Reserve (Fed) rate-hike expectations for the upcoming September decision.
Author  FXStreet
15 hours ago
Silver price (XAG/USD) loses its gains from the previous day, trading around $63.50 per troy ounce during Asian hours on Monday. Non-yielding Silver is currently facing significant headwinds driven by rising Federal Reserve (Fed) rate-hike expectations for the upcoming September decision.
goTop
quote