


Ondo Price Forecast: ONDO holds key support as network’s tokenized stocks launch on Uniswap
- ONDO clings to critical support above $0.30, trading within a broader bearish trend from June highs of $0.43.
- Ondo Finance lists over 430 tokenized stocks and ETFs on decentralized exchange Uniswap, expanding access to global markets.
- ONDO technical outlook remains largely bearish, with the major moving averages capping the upside amid weak momentum indicators.
Ondo Finance (ONDO) is facing a pivotal moment as it attempts to hold above the $0.30 short-term support level on Tuesday. Since early June, ONDO has declined by more than 30%, putting significant pressure on the technical setup and reducing the probability of a sustained bullish reversal.
Uniswap lists Ondo Finance tokenized stocks and ETFs
Ondo Finance announced on Tuesday that more than 430 tokenized stocks and Exchange-Traded Funds (ETFs) are now available for trading on the decentralized exchange (DEX) Uniswap.
Qualified participants on Ethereum (ETH) and BNB Chain can now gain exposure to leading equities such as SpaceX (SPCX), Tesla (TSLA), Nvidia (NVDA), and Apple (AAPL), along with major ETFs like QQQ and SPY, all seamlessly via the Uniswap platform.
Ondo Finance stated in the press release that protocols, wallets, or applications that have integrated UniswapX can link their users to Ondo tokenized stocks and ETFs without additional integration work.
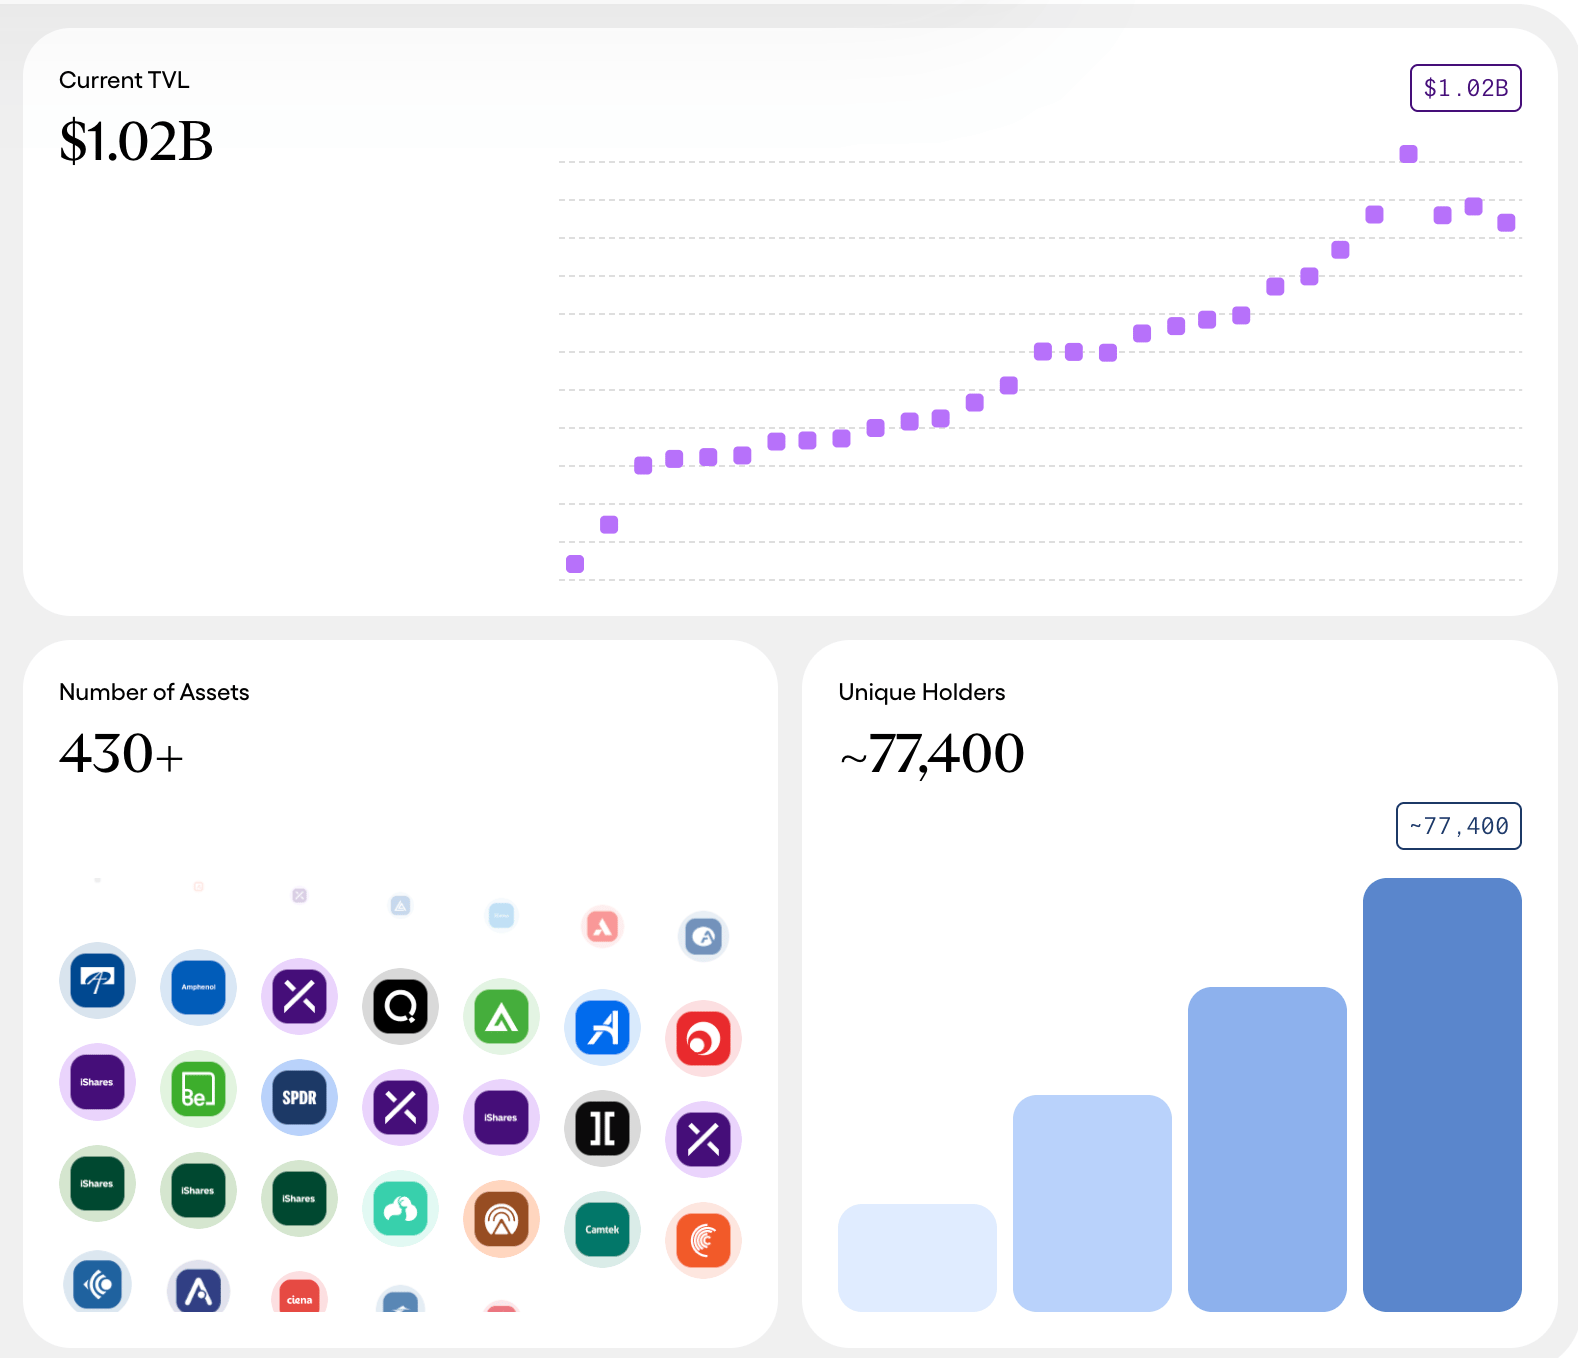
Ondo Finance is a leading real-world asset (RWA) tokenization platform, with a self-reported Total Value Locked (TVL) of $1.02 billion. The protocol boasts over 77,000 unique holders spread across over 430 assets.
Price analysis: Ondo under pressure as bearish signals persist
ONDO trades around $0.31 as bulls aggressively defend the psychological $0.30 support level. Meanwhile, the token upholds a bearish bias, sitting decisively below the short and long-term Exponential Moving Averages (EMAs).
Momentum conditions reinforce the cautious tone, with the Relative Strength Index (RSI) hovering near 39 in weak territory on the daily chart and the Moving Average Convergence Divergence (MACD) histogram still negative, hinting at persistent downside pressure despite mild stabilization.
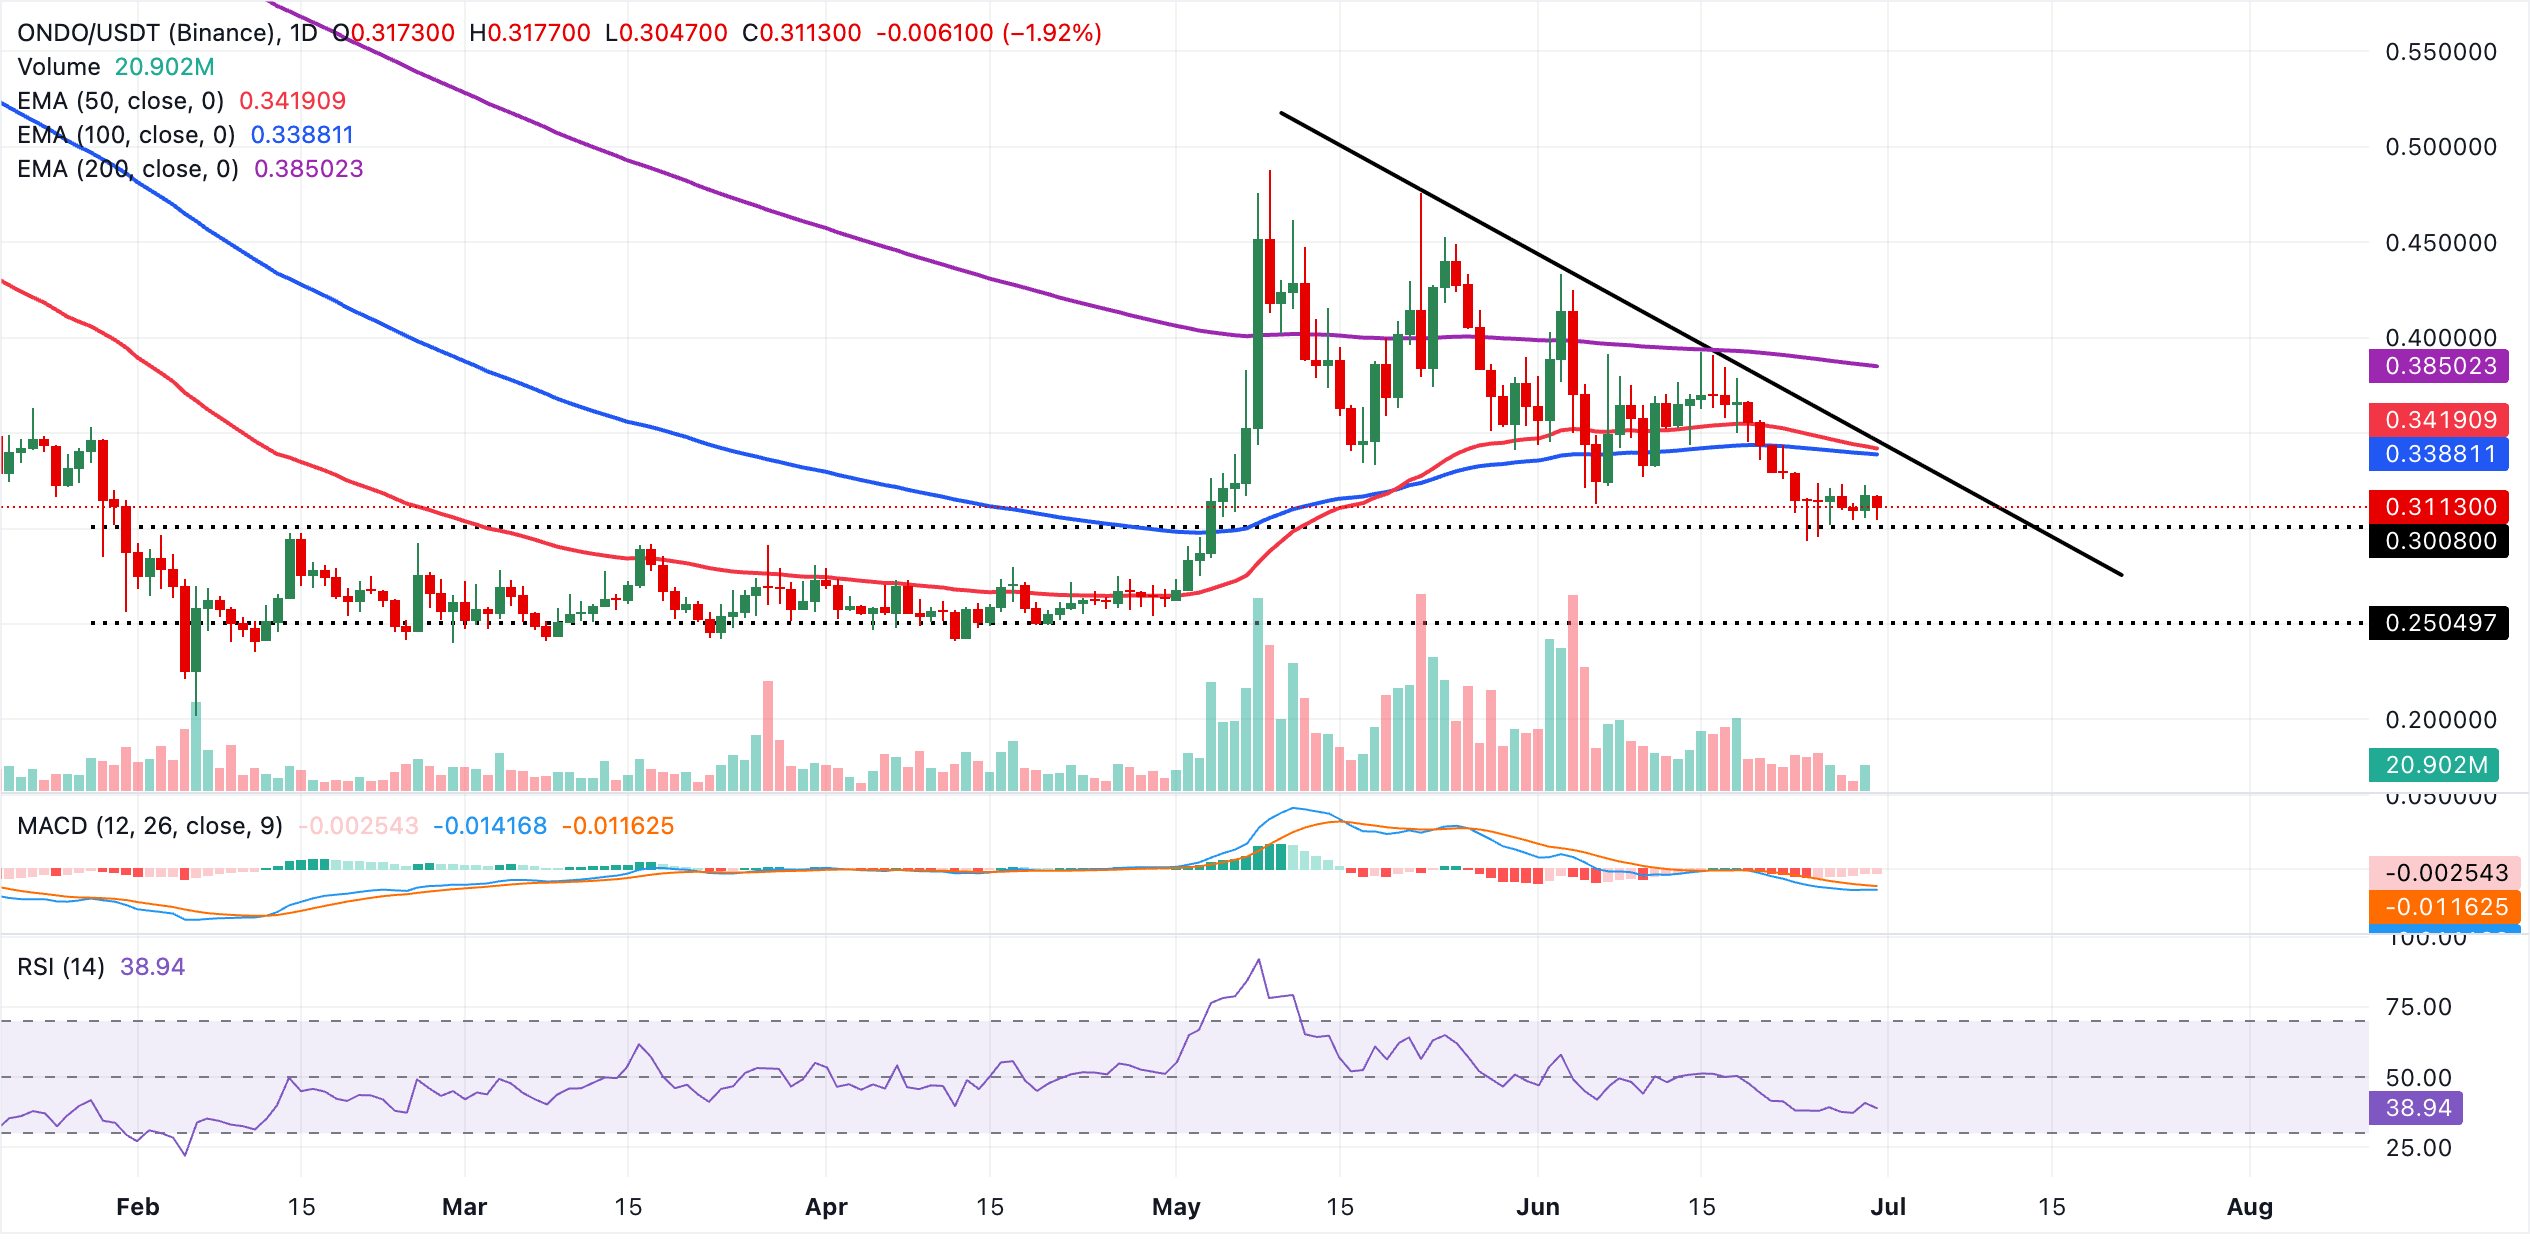
Initial resistance aligns with the 100-day EMA at $0.34, followed closely by the 50-day EMA at $0.34, forming a compact supply zone that bulls would need to reclaim to ease the current bearish structure. Above these barriers, the 200-day EMA at $0.39 marks a more significant hurdle within the broader downtrend, while the longer-term descending trendline, referenced around $0.52, defines the upper boundary. Looking down, ONDO bulls hold firmly to the immediate support at $0.30, where a deeper sell-off will likely open the door to losses targeting the demand area at $0.25.
(The technical analysis of this story was written with the help of an AI tool.)
Bitcoin, altcoins, stablecoins FAQs
Bitcoin is the largest cryptocurrency by market capitalization, a virtual currency designed to serve as money. This form of payment cannot be controlled by any one person, group, or entity, which eliminates the need for third-party participation during financial transactions.
Altcoins are any cryptocurrency apart from Bitcoin, but some also regard Ethereum as a non-altcoin because it is from these two cryptocurrencies that forking happens. If this is true, then Litecoin is the first altcoin, forked from the Bitcoin protocol and, therefore, an “improved” version of it.
Stablecoins are cryptocurrencies designed to have a stable price, with their value backed by a reserve of the asset it represents. To achieve this, the value of any one stablecoin is pegged to a commodity or financial instrument, such as the US Dollar (USD), with its supply regulated by an algorithm or demand. The main goal of stablecoins is to provide an on/off-ramp for investors willing to trade and invest in cryptocurrencies. Stablecoins also allow investors to store value since cryptocurrencies, in general, are subject to volatility.
Bitcoin dominance is the ratio of Bitcoin's market capitalization to the total market capitalization of all cryptocurrencies combined. It provides a clear picture of Bitcoin’s interest among investors. A high BTC dominance typically happens before and during a bull run, in which investors resort to investing in relatively stable and high market capitalization cryptocurrency like Bitcoin. A drop in BTC dominance usually means that investors are moving their capital and/or profits to altcoins in a quest for higher returns, which usually triggers an explosion of altcoin rallies.
Recommended Articles


