

3 Bullish Signals Suggest Ethereum May Be Undervalued in April
Ethereum (ETH) has outperformed the broader market and all top-10 large-cap digital assets over the past month, gaining more than 12% amid war-driven macro volatility reshaping capital flows.
Several analysts have now pointed to three distinct signals that paint a bullish picture for Ethereum’s price heading into the second half of April.
Ethereum Record Network Activity Meets Depressed Prices
Leon Waidmann, head of research at Lisk, highlighted that the Ethereum mainnet recorded 3.62 million transactions on April 12. That figure marks the first time the network has processed more than 3 million transactions in a single day.
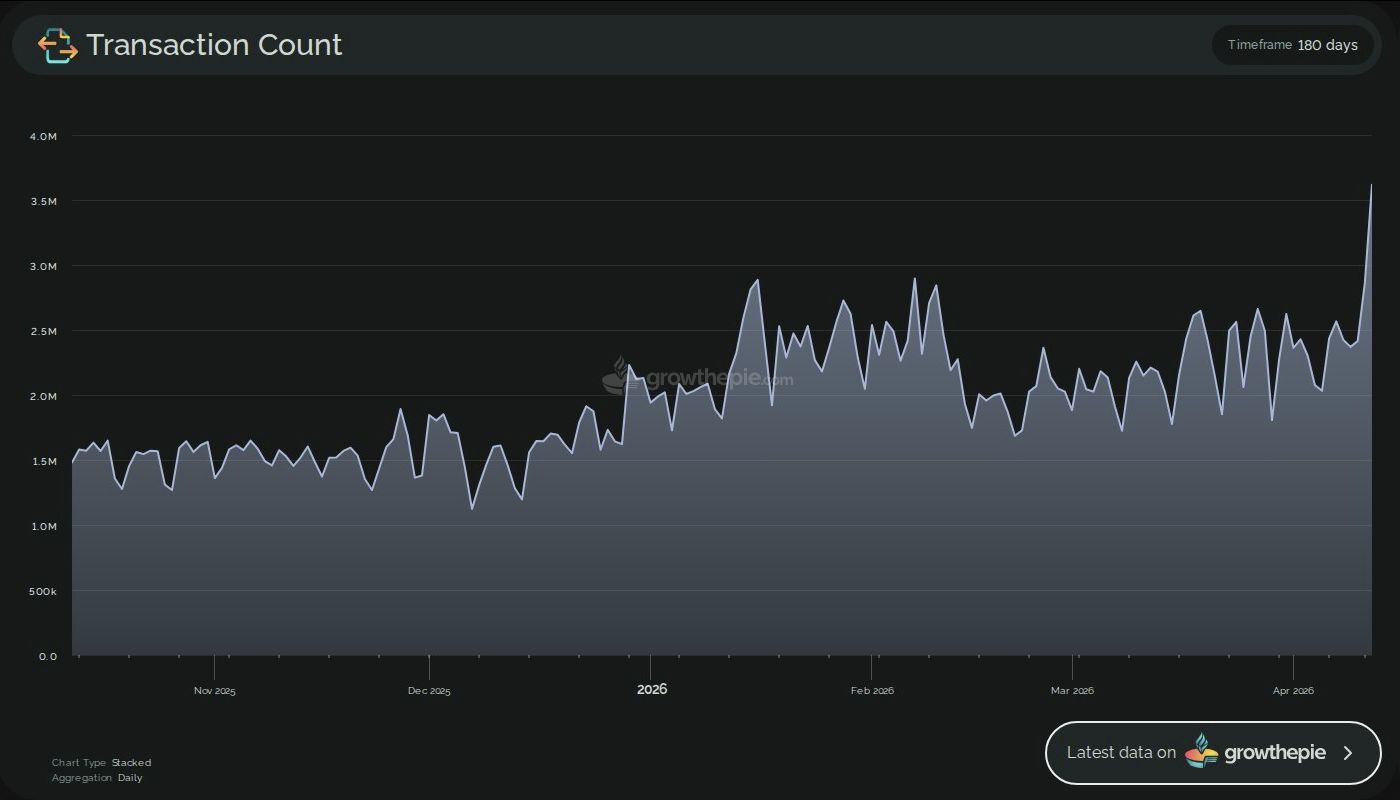 Ethereum Transaction Activity. Source: X/Leon Waidmann
According to Waidmann, daily transactions have trended higher since November 2025. The baseline shifted from roughly 1.5 million to approximately 2.5 million over the past six months.
Combined with 284,000 new users in Q1 and a record stablecoin supply, these metrics point to sustained organic growth on Ethereum’s base layer.
Follow us on X to get the latest news as it happens
Meanwhile, staking infrastructure provider Everstake noted that ETH still trades more than 50% below its all-time high despite strong network activity. Thus, the price reflects a wide gap between network usage and market valuation.
“This creates a notable divergence, because network activity is at peak levels, while price has yet to fully reflect that strength. Historically, such gaps tend to narrow over time,” the post read. “Ethereum stands on one of the strongest foundations it has ever had – record usage, a deeply established ecosystem, and continuous progress in scaling and development. In many ways, this highlights a simple dynamic: price often follows fundamentals, not the other way around. And the fundamentals are already in place.”
Technical Indicators Flash Bullish Signals
On the technical side, analyst Crypto Patel pointed to the Ethereum Rainbow Chart, a logarithmic regression tool that maps long-term valuation bands. According to Patel,
“The Ethereum Rainbow Chart is saying one simple thing right now. It’s cheap. Not ‘okay to buy.’ Not ‘maybe wait.’ Not ‘hold and hope.’ Just cheap.”
He noted that ETH has only entered this band twice before, and both times it reached the upper “Take Profit” range within 18 months.
Separately, analyst Ash Crypto highlighted a confirmed weekly MACD bullish crossover. The Moving Average Convergence Divergence indicator tracks momentum shifts on longer timeframes.
According to Ash Crypto, the previous two weekly MACD crosses on ETH preceded rallies of 183% and 75%, respectively.
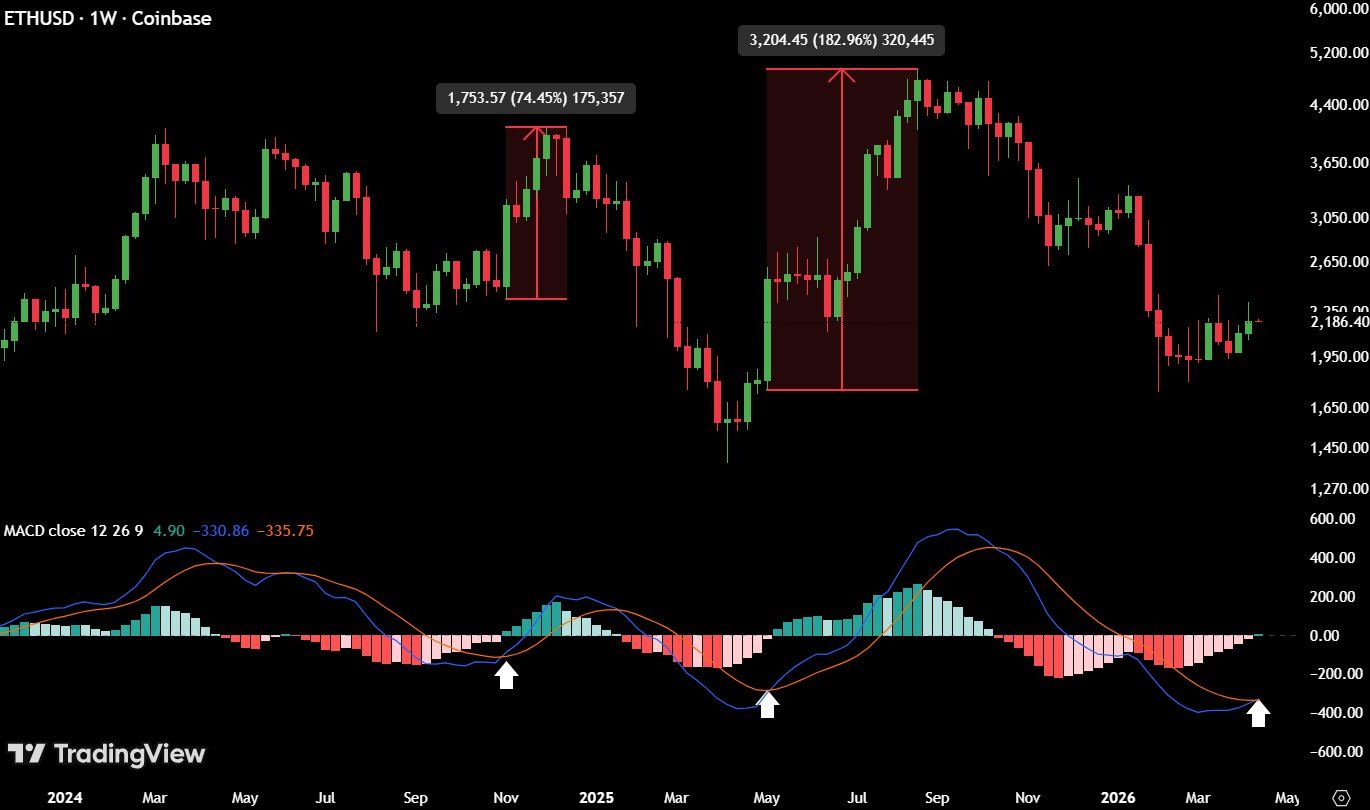 Ethereum Price Prediction. Source: X/Ash Crypto
With ETH trading near $2,346 as of April 14, a 183% rally from current levels would place the asset around $6,639, while a 75% move would target approximately $4,105. Whether the current confluence of on-chain strength and technical signals translates into sustained price action will likely depend on broader macro conditions through Q2.
Subscribe to our YouTube channel to watch leaders and journalists provide expert insights
Recommended Articles


