

$765 Million ETH Changes Hands As Whales Anchor Ethereum Price Above $2,000
Ethereum (ETH) is trading at $2,068, pressing directly against the 0.236 Fibonacci level at $2,055. The token has been pulled in two directions simultaneously — long-term holders booking profits from elevated cost bases while whale-tier addresses absorb that supply to prevent a structural breakdown.
The $2,000 level is the line separating these two forces. Which cohort wins determines the next significant move.
Old ETH Holders Are Selling
The Glassnode HODL Waves chart tracking the 3-to-5 year holding cohort spans December 26, 2025, through March 26, 2026. That band held relatively stable between 14.2% and 14.4% of total ETH supply from late December through January 20 before beginning a gradual decline.
The decline accelerated sharply at the right edge of the chart. Between March 21 and March 26, the 3-to-5 year cohort dropped from approximately 13.6% to 12.8% of supply — a fall of nearly 0.8 % in under a week. This represents the second-largest distribution event from this cohort visible in the 2026 data, behind only the drop recorded in late January.
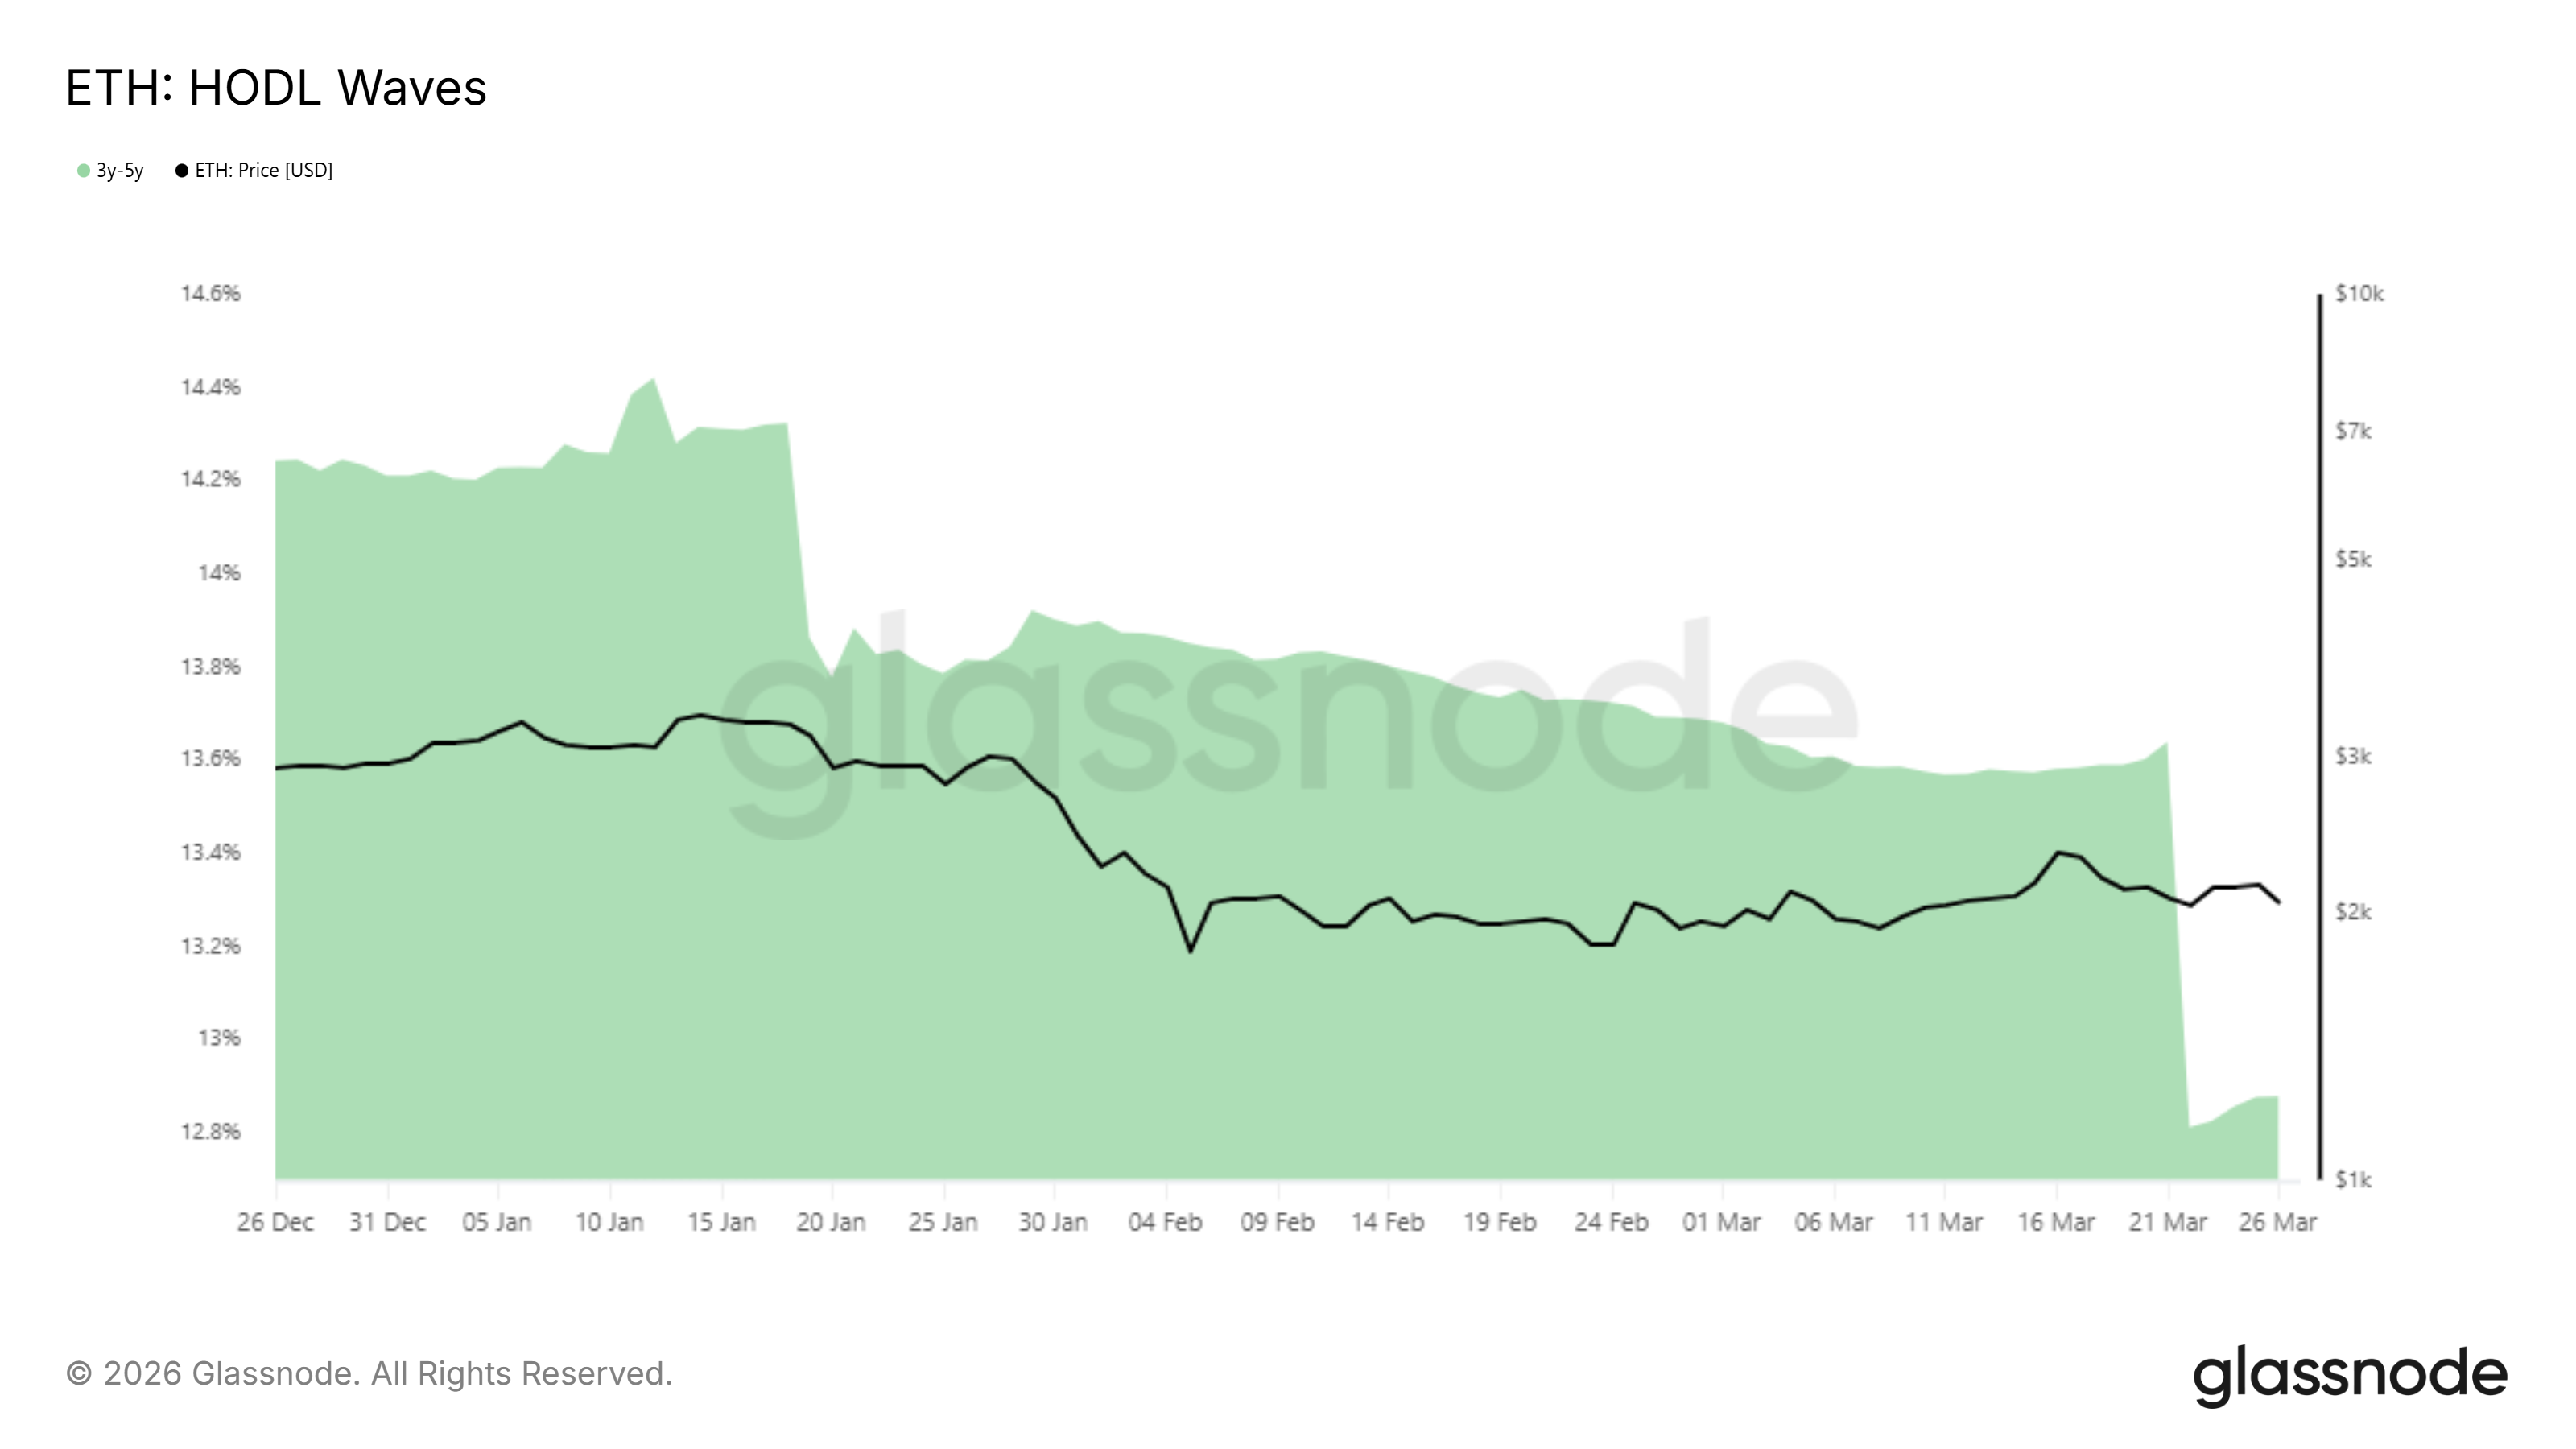 Ethereum HODL Waves. Source: Glassnode
Holders in this cohort acquired ETH between 2021 and 2023, a period that includes both the 2021 bull market peak near $5,000 and the 2022 bear market lows. Many of those who bought near the top are still underwater.
Those who accumulated during the bear market are now sitting on meaningful profits at current prices and are choosing to realize them. Their exit is not panic — it is deliberate profit-taking at a price level they may not see again soon.
Whales Are Absorbing Smaller Holders Are Selling
The Santiment address supply distribution chart tracking three cohorts — addresses holding 10,000 to 100,000 ETH (blue), 100,000 to 1,000,000 ETH (red), and 1,000,000 to 10,000,000 ETH (yellow) — shows a clear shift in supply ownership since March 25.
The blue cohort sold approximately 370,000 ETH between March 25 and the time of writing. That selling did not push the price lower in any meaningful way.
Want more token insights like this? Sign up for Editor Harsh Notariya’s Daily Crypto Newsletter here.
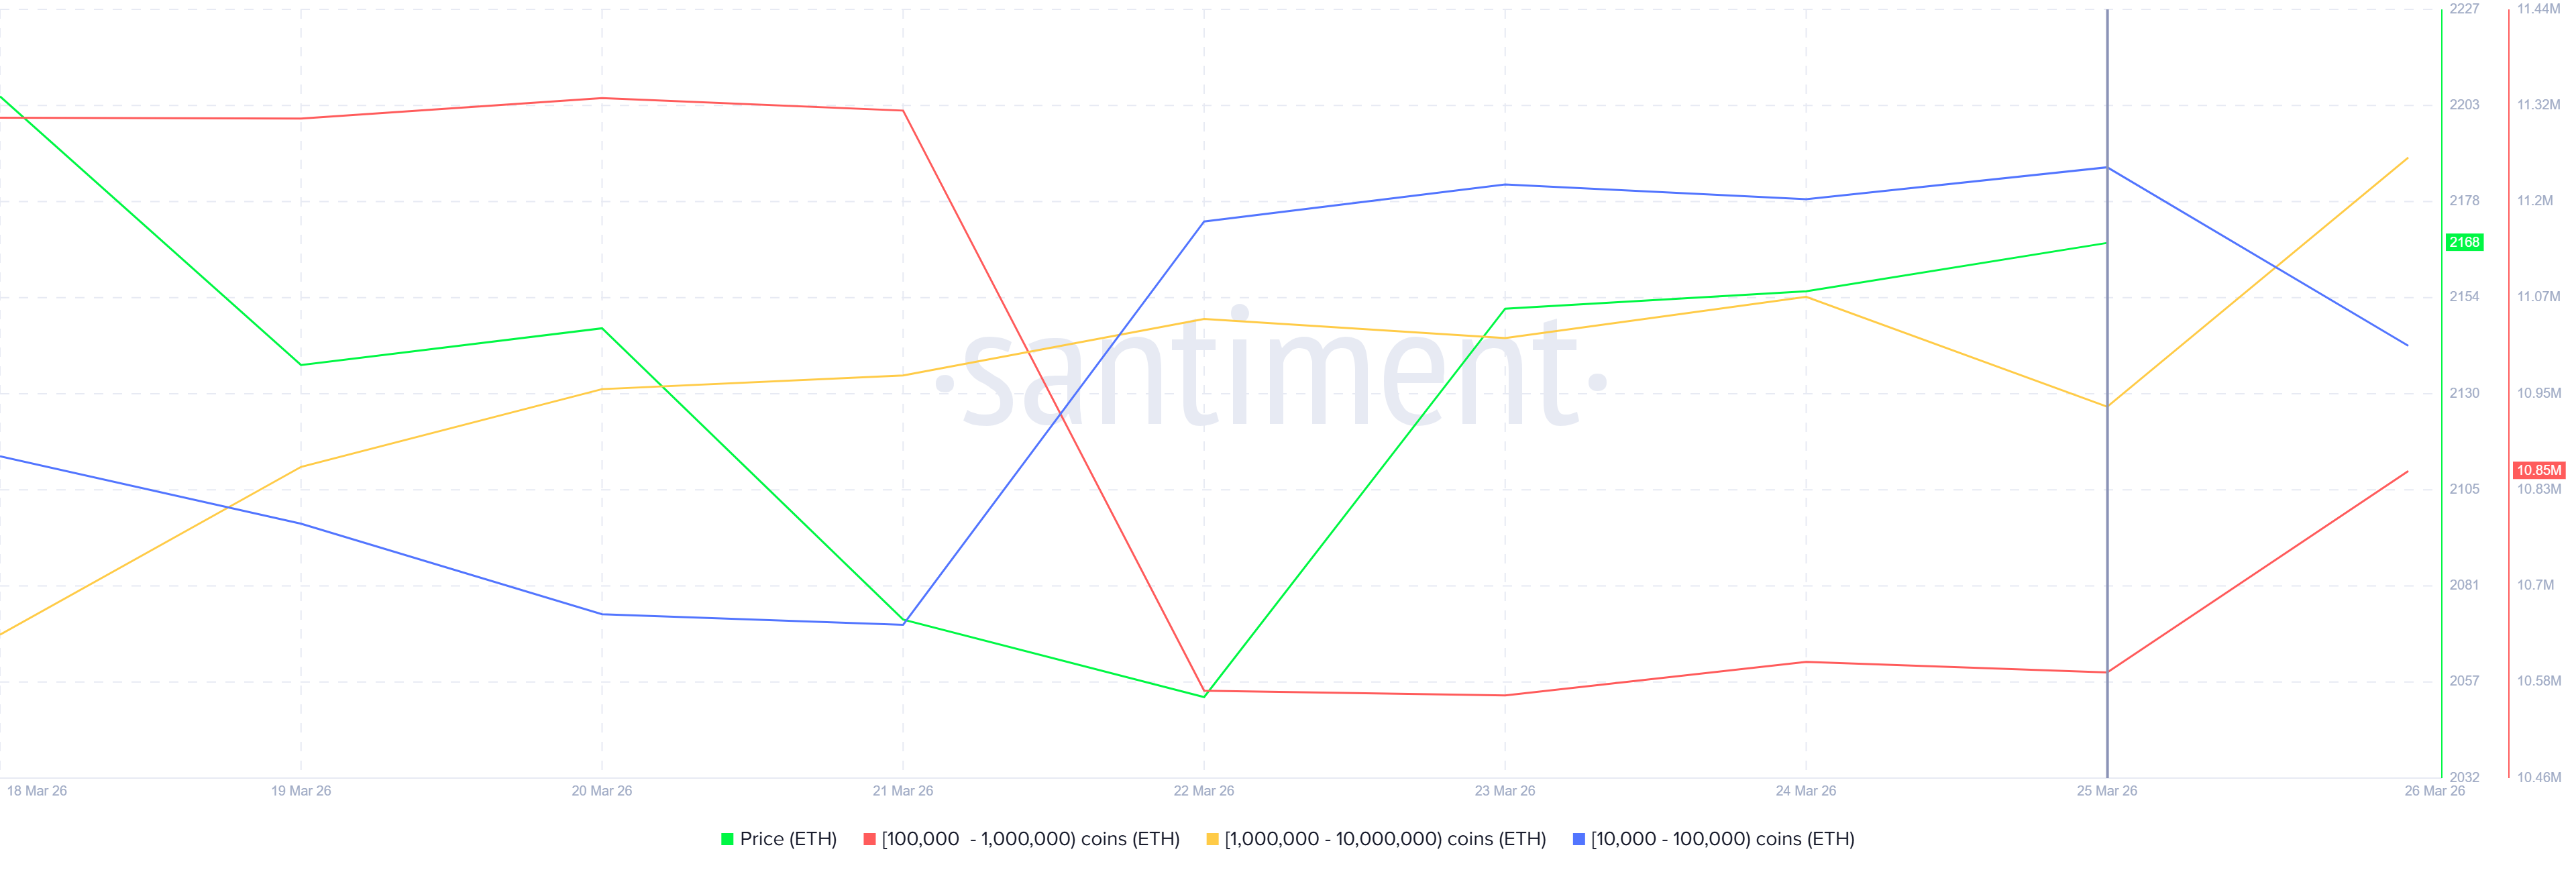 Ethereum Whale Holding. Source: Santiment
Instead, the red and yellow cohorts absorbed that supply collectively, with the two larger whale tiers increasing their balances in direct proportion to the blue cohort’s exit. At the current Ethereum price, that transfer of 370,000 ETH represents approximately $765 million changing hands from mid-tier holders into the largest whale addresses on the network.
This dynamic — larger addresses absorbing supply that smaller addresses are offloading — is what will likely keep ETH above $2,000. As long as that buying continues to absorb available sell-side supply, it acts as a structural floor against further price decline.
ETH Price Trajectory Going Forward
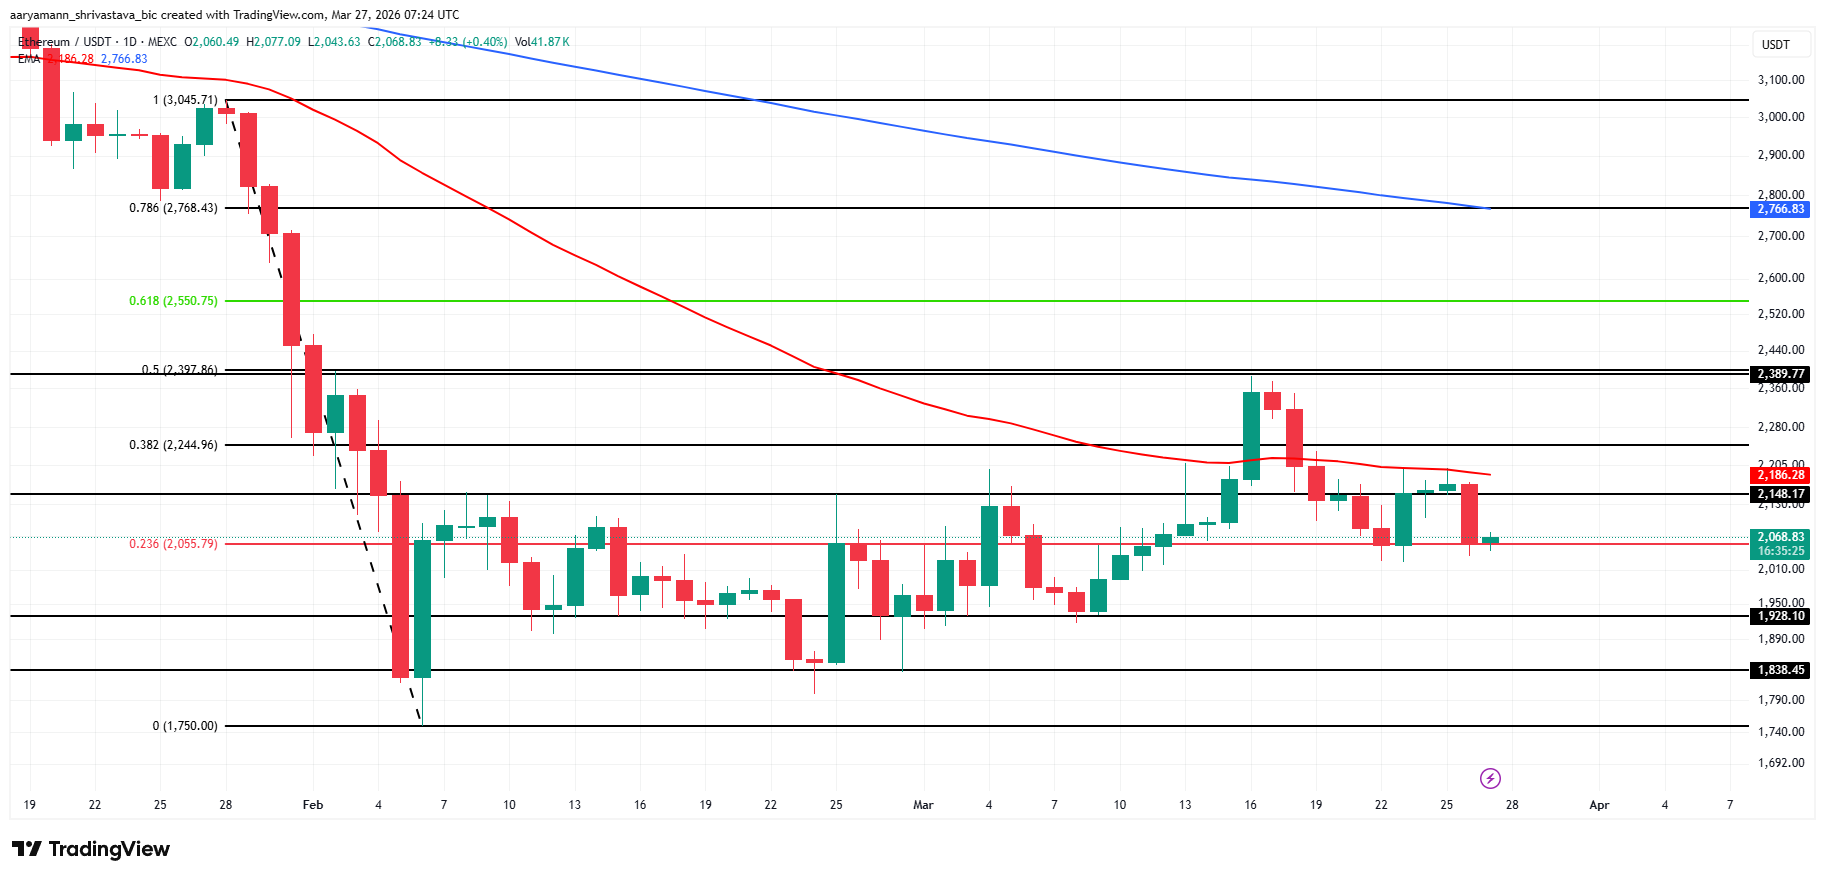
The daily chart shows Ethereum price at $2,068, sitting at the 0.236 Fibonacci level at $2,055, with the red 50-day EMA sloping downward at $2,186 acting as immediate resistance. The Fibonacci retracement grid runs from the zero level at $1,750 to the 1.0 level at $3,045.
The 0.236 level at $2,055 has been the battleground since early March. Every session that has tested it has either closed above or produced a recovery. Ethereum price is currently pressing it again, and the outcome of this test determines the next destination. Below $2,055, the $1,928 horizontal support is the next level on the chart and represents the last defense before the $1,838 floor comes into play.
 ETH Price Analysis. Source: TradingView
The bullish invalidation requires reclaiming the 0.382 level at $2,244. Above that, the 0.5 level at $2,397 becomes the next target, followed by the 0.618 level at $2,550.
A sustained move toward $2,550 would require whale accumulation to accelerate as the 3-to-5-year holder selling pressure subsides. This is a scenario that becomes more likely only if the broader market stabilizes above $2,000.
Recommended Articles


