

NVIDIA Stock Price Bleeds Despite AGI Breakthrough Comments from CEO
NVIDIA (NVDA) stock price trades near $175, down roughly 9% over the past month. The stock opened the week flat after failing to reclaim $176 in the prior session. Since late October 2025, NVDA has been confined inside a falling channel, and the recent attempt to break the upper trendline has failed.
The macro environment has not helped. The Iran conflict has pushed oil past $100, feeding inflation expectations that keep bond yields elevated. Rising yields compress the valuation multiples of growth stocks, and NVIDIA has not been immune despite its dominant AI position.
A Falling Channel Where the Two Key Indicators Are Weakening
The daily chart shows NVIDIA trading inside a descending channel from near $212 in late October. Every rally attempt since has been rejected at or near the upper trendline.
Between early and mid-March, NVDA rallied close to 8% and briefly pushed the Chaikin Money Flow (CMF), a proxy for big money flows, above the zero line. However, the CMF has since turned lower, indicating institutional capital is pulling back again.
Despite the weakness, a CMF divergence has kept the NVIDIA stock price from collapsing entirely. Between November 6 and March 20, while the NVDA price trended lower inside the channel, the CMF formed a higher low formation.
This suggests that even though big money flows have been negative, the intensity of selling has been diminishing with each wave lower. The critical CMF floor sits at -0.23. That level has been broken only once since late November, and the resulting correction was significant.
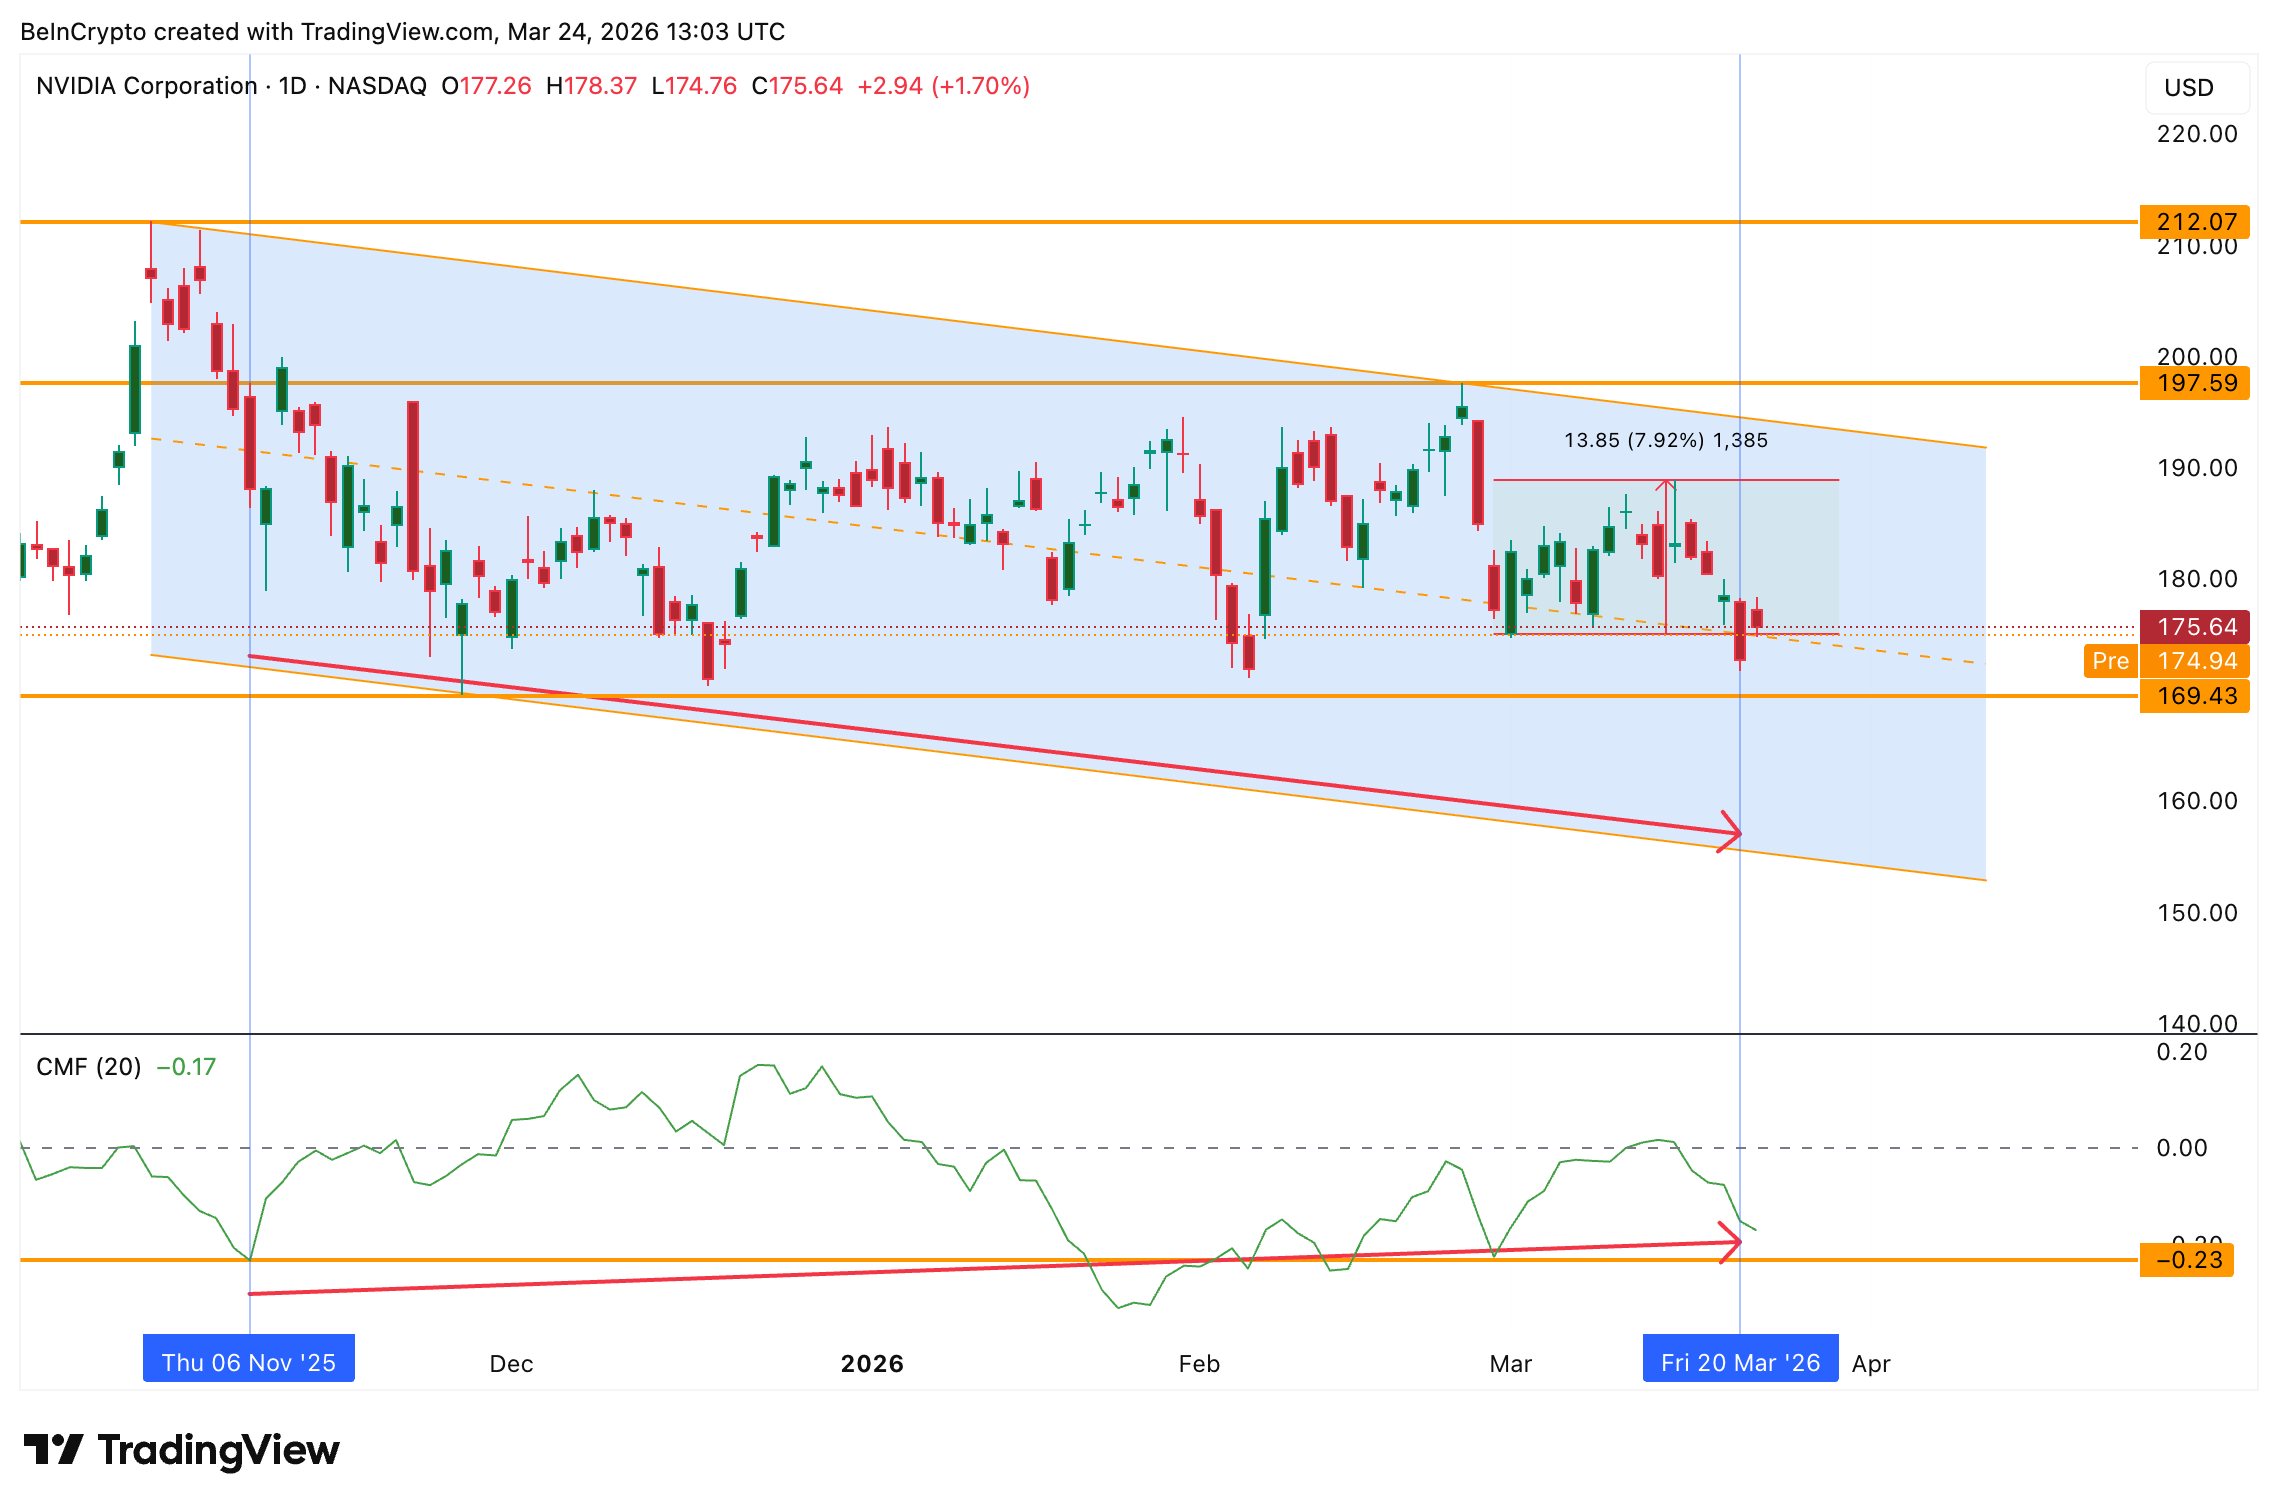 NVDA Falling Channel and CMF: TradingView
If -0.23 breaks again, the last structural support under the channel disappears.
The Exponential Moving Average (EMA) cluster, an indicator that gives more weight to recent price data to identify trend direction, adds a compounding risk. The 20-day EMA has already crossed below the 100-day EMA around March 19, forming a bearish crossover.
Since that crossover began building around March 18, NVDA has corrected over 6%. The stock now trades below all three key EMAs, with only the 200-day at $173 sitting below as a final support.
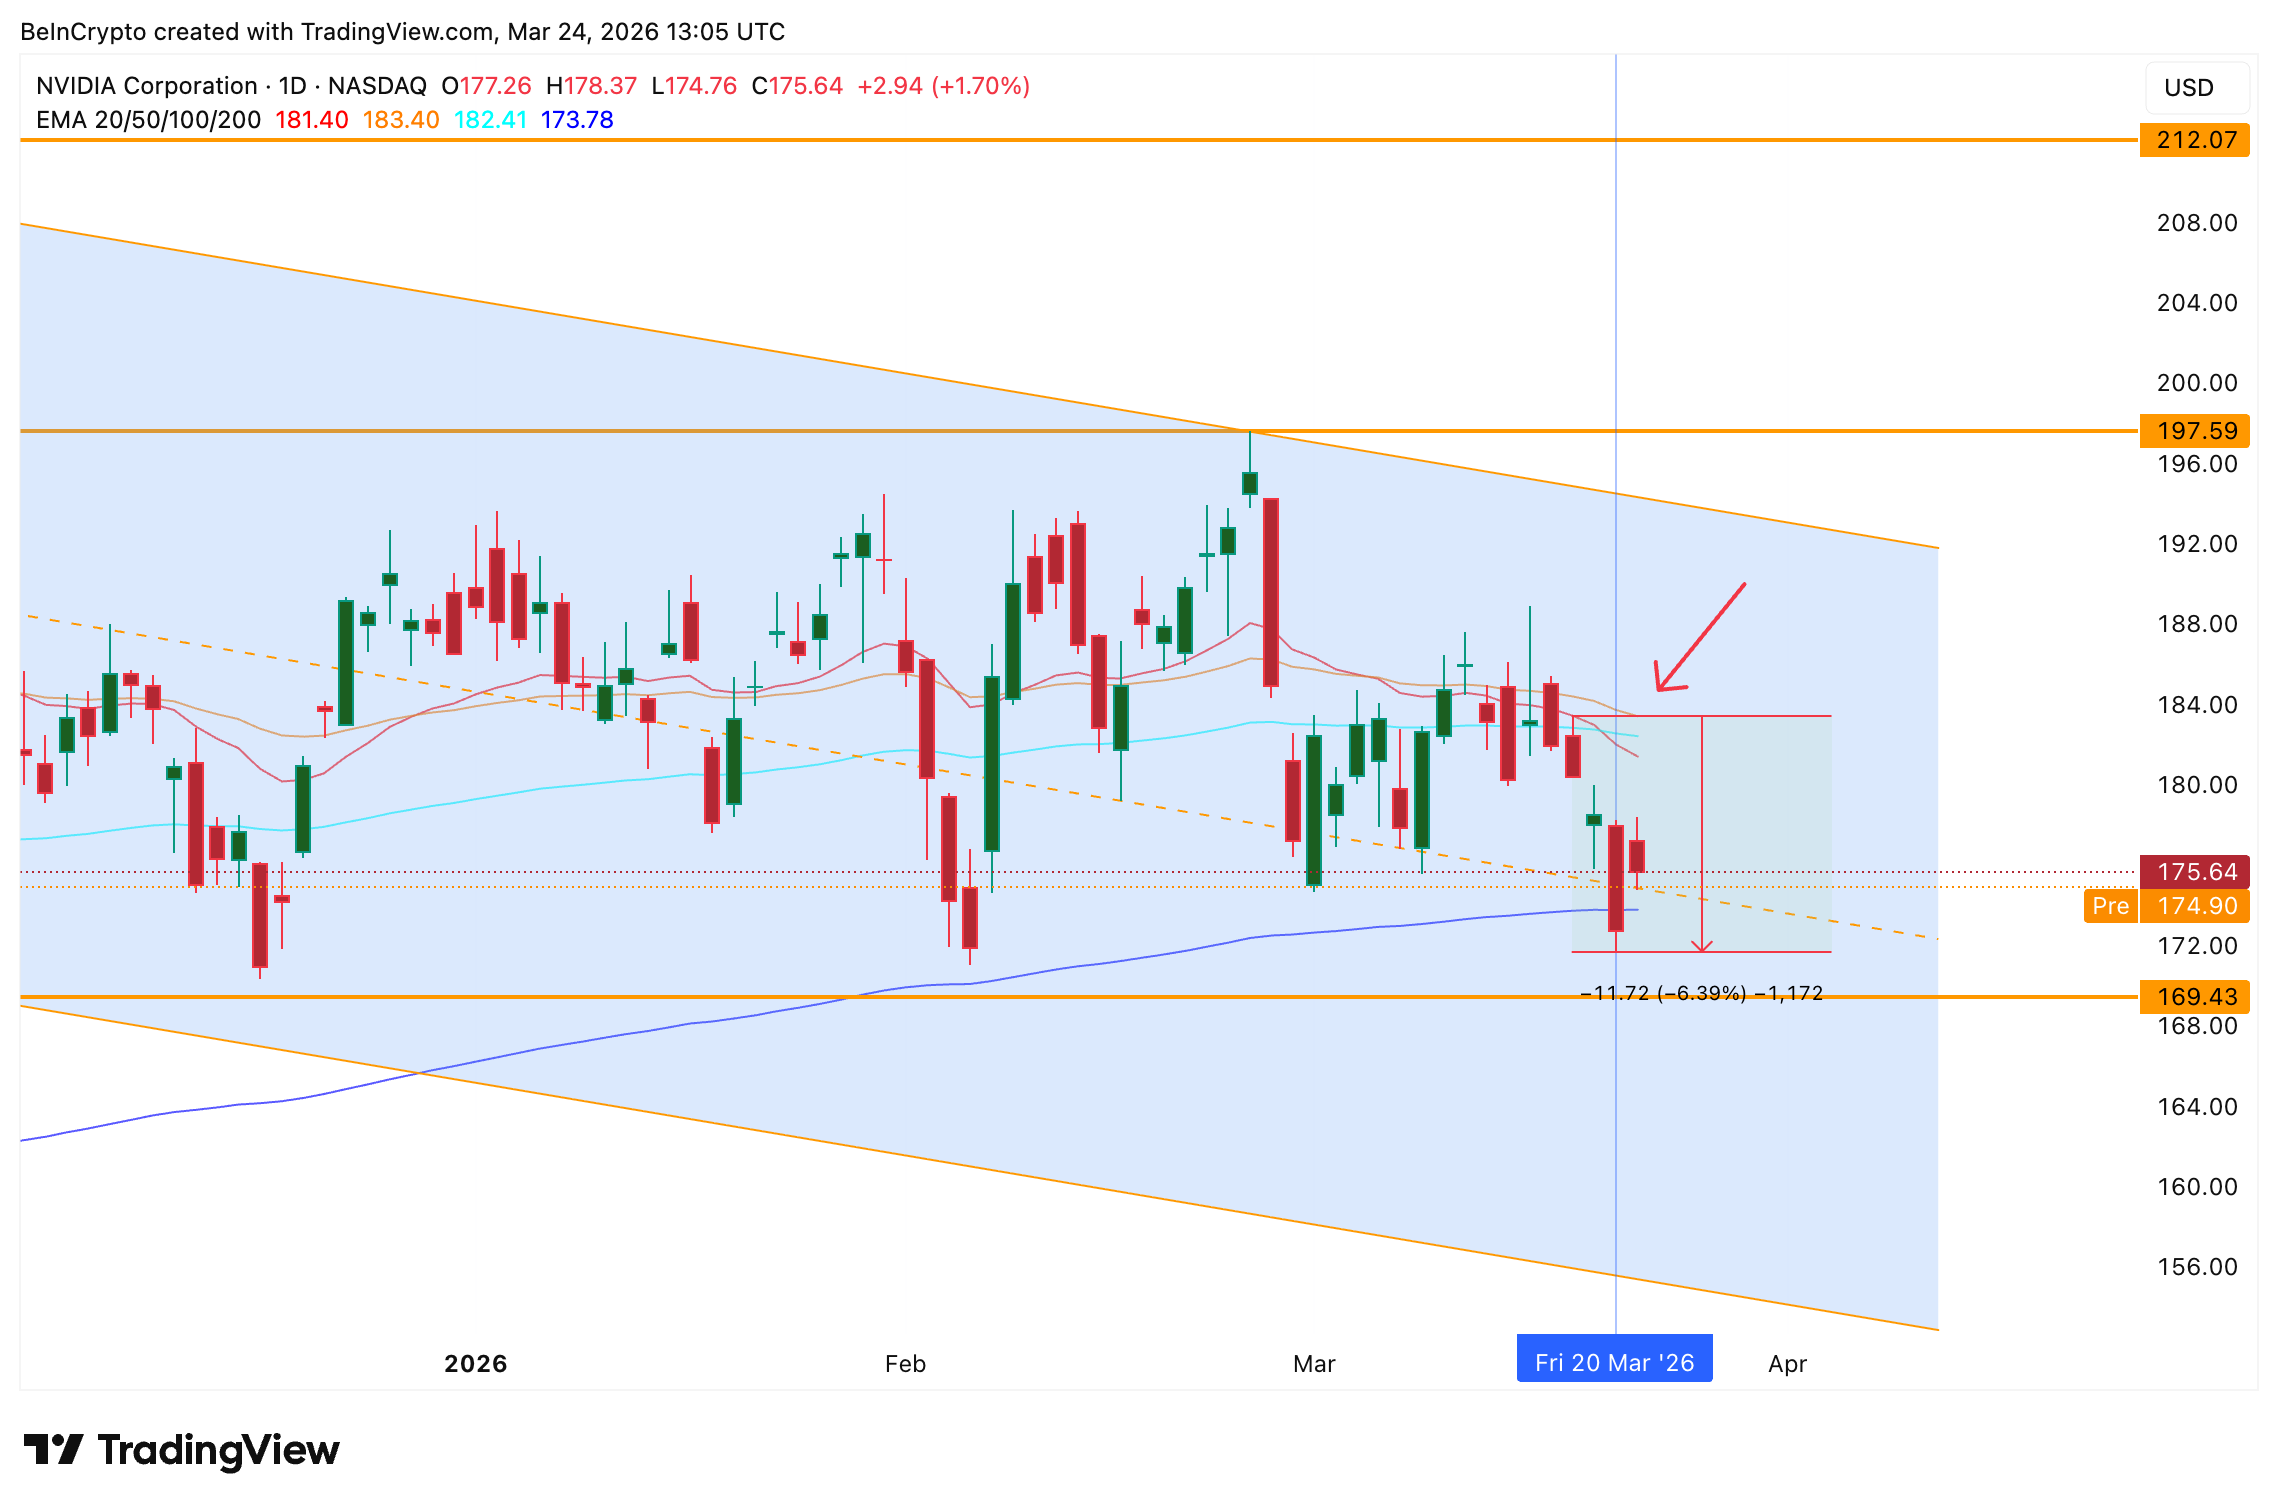 EMA Crossover Risk: TradingView
A second crossover is now developing. The 50-day EMA is closing in on the 100-day. If that completes, it would reinforce the bearish momentum and bring the lower channel support into focus.
The CMF divergence is the thread holding the falling channel together. The EMA crossovers are the scissors.
Options Traders Are Building Fresh Bearish Positions
The options market confirms the technical deterioration rather than contradicting it.
Around the February 25 earnings report, when NVDA closed at $195 and reported earnings of $1.62 per share, the put-call volume ratio stood at 0.55 and the open interest ratio at 0.83. Both readings reflected moderate confidence with manageable hedging. Calls were being traded almost twice as frequently as puts, a bullish sign.
Want more insights like this? Sign up for Editor Harsh Notariya’s Daily Crypto Newsletter here.
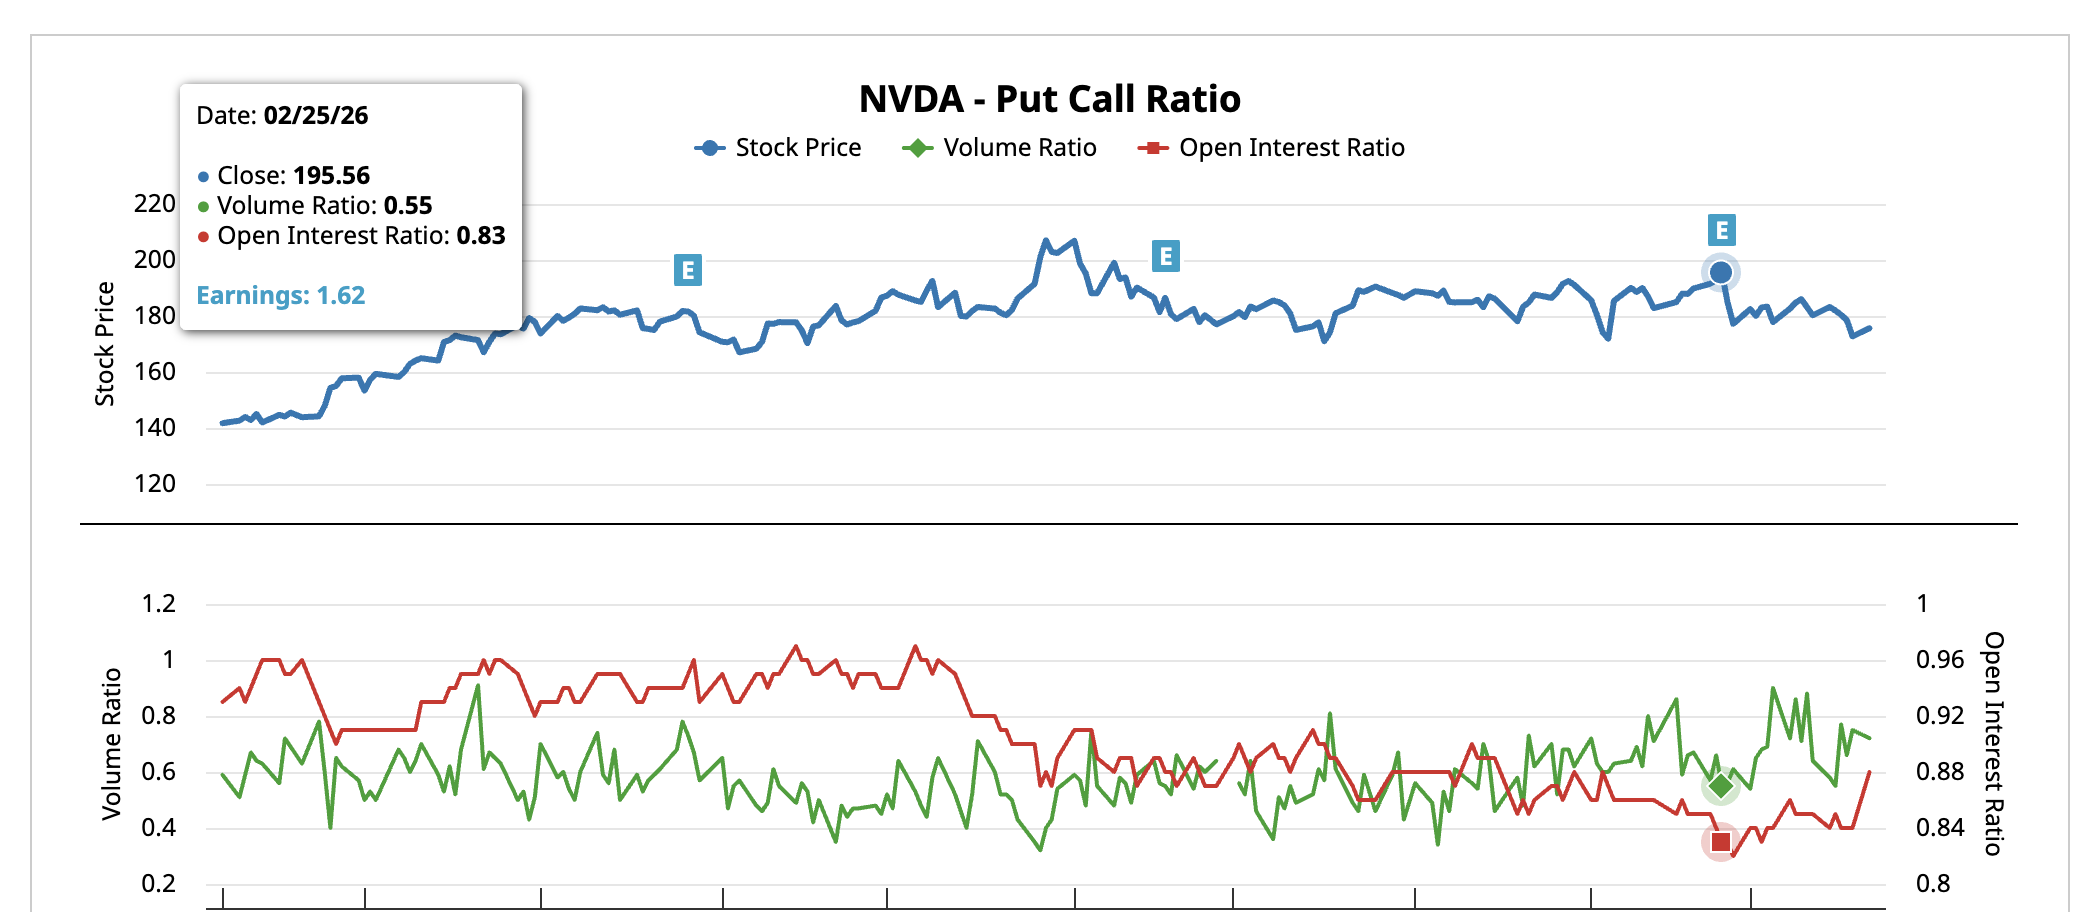 NVDA Put-Call Ratio at Earnings: Barchart
Roughly a month later, with NVDA at $175, the picture has shifted materially. The volume ratio has risen to 0.72, a roughly 31% increase. The open interest ratio has climbed to 0.88. The volume ratio rising means significantly more puts are present relative to calls on a daily basis. But the open interest ratio rising from 0.83 to 0.88 is the more telling signal. It means bearish positions are not just being traded but are being held open. Options traders are building new downside bets and maintaining them.
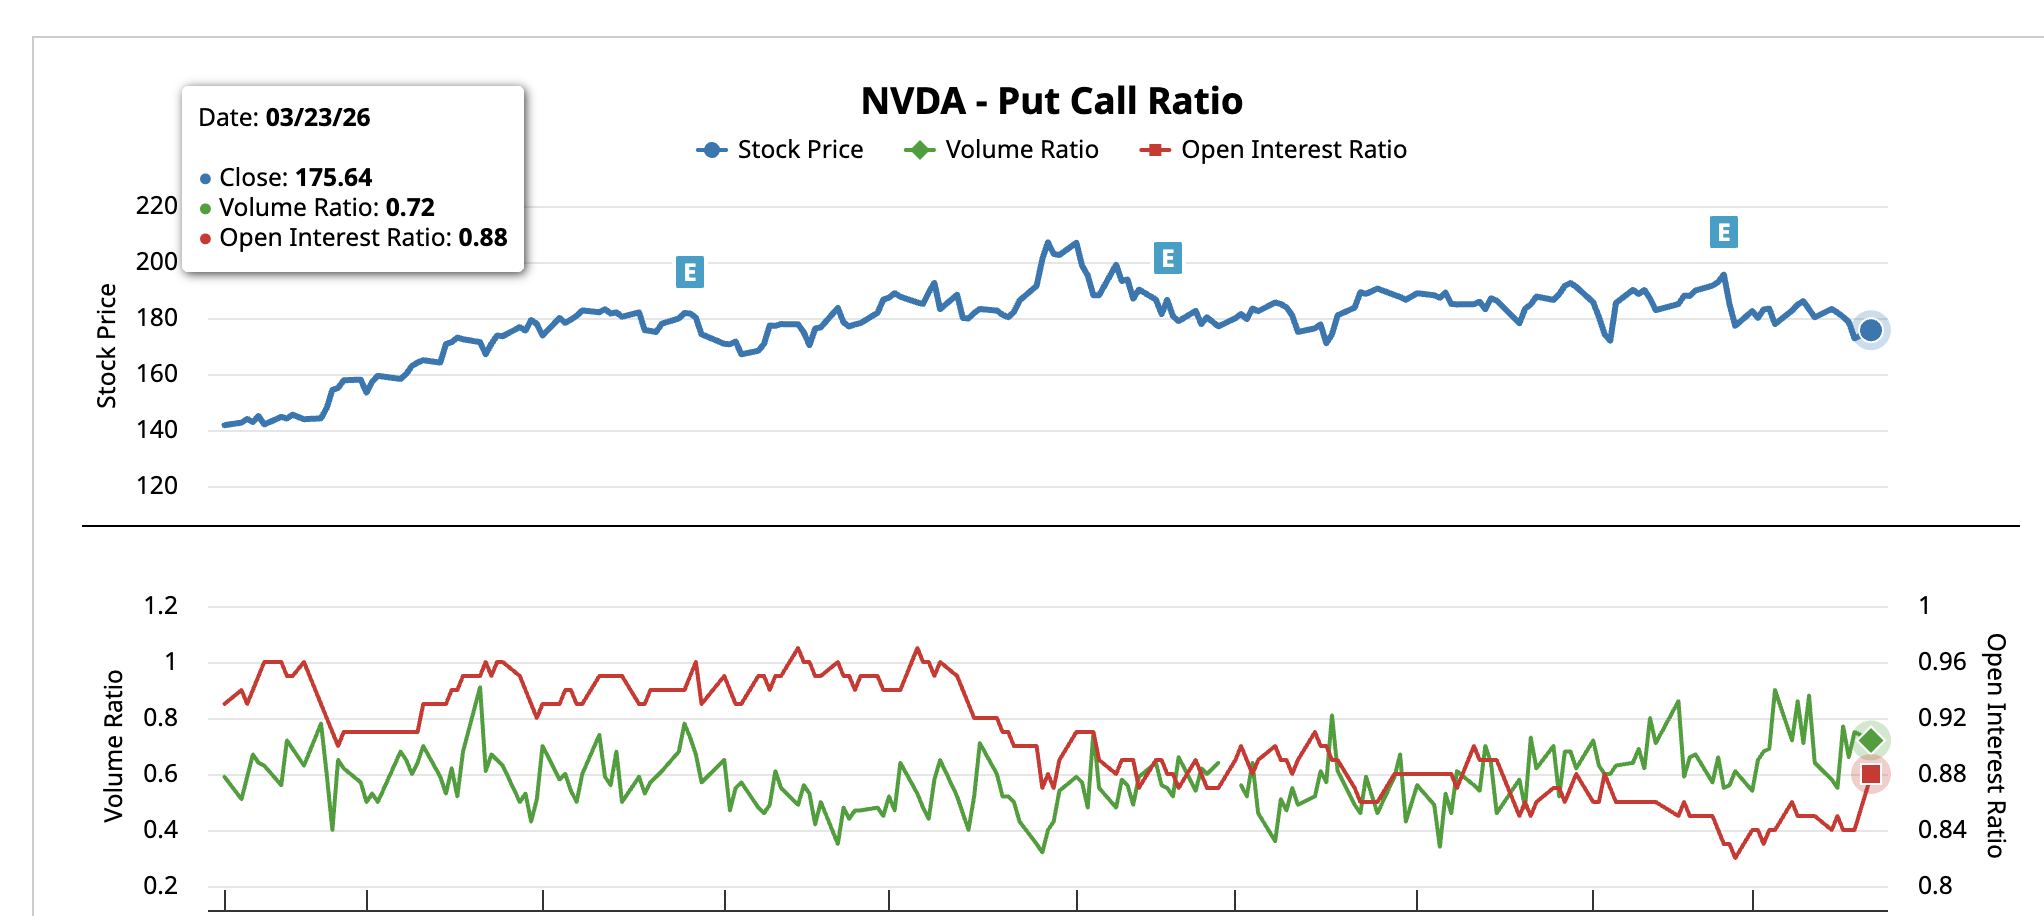 NVDA Put-Call Ratio Current: Barchart
This aligns with the CMF and EMA weakness. Institutional flows are pulling back, the moving average structure is deteriorating, and options traders are independently arriving at the same bearish conclusion.
NVIDIA Stock Price Levels to Watch Now
The technical levels drawn using the channel’s range place $176 as a key resistance, which NVDA failed to reclaim in the most recent session. Above $176, $181, and $187 are the resistance zones. A move above $197 (the post-earnings swing high) would invalidate the falling channel and shift the bias from bearish to neutral.
On the downside, $171 is the critical level. It aligns with the 0.618 Fibonacci and represents a major swing low from February 5. If $171 breaks on a daily close, $169 (previous low) may offer brief support, but the measured targets extend to $163 and $154. A move under $154 would qualify the NVIDIA stock price for a pattern breakdown.
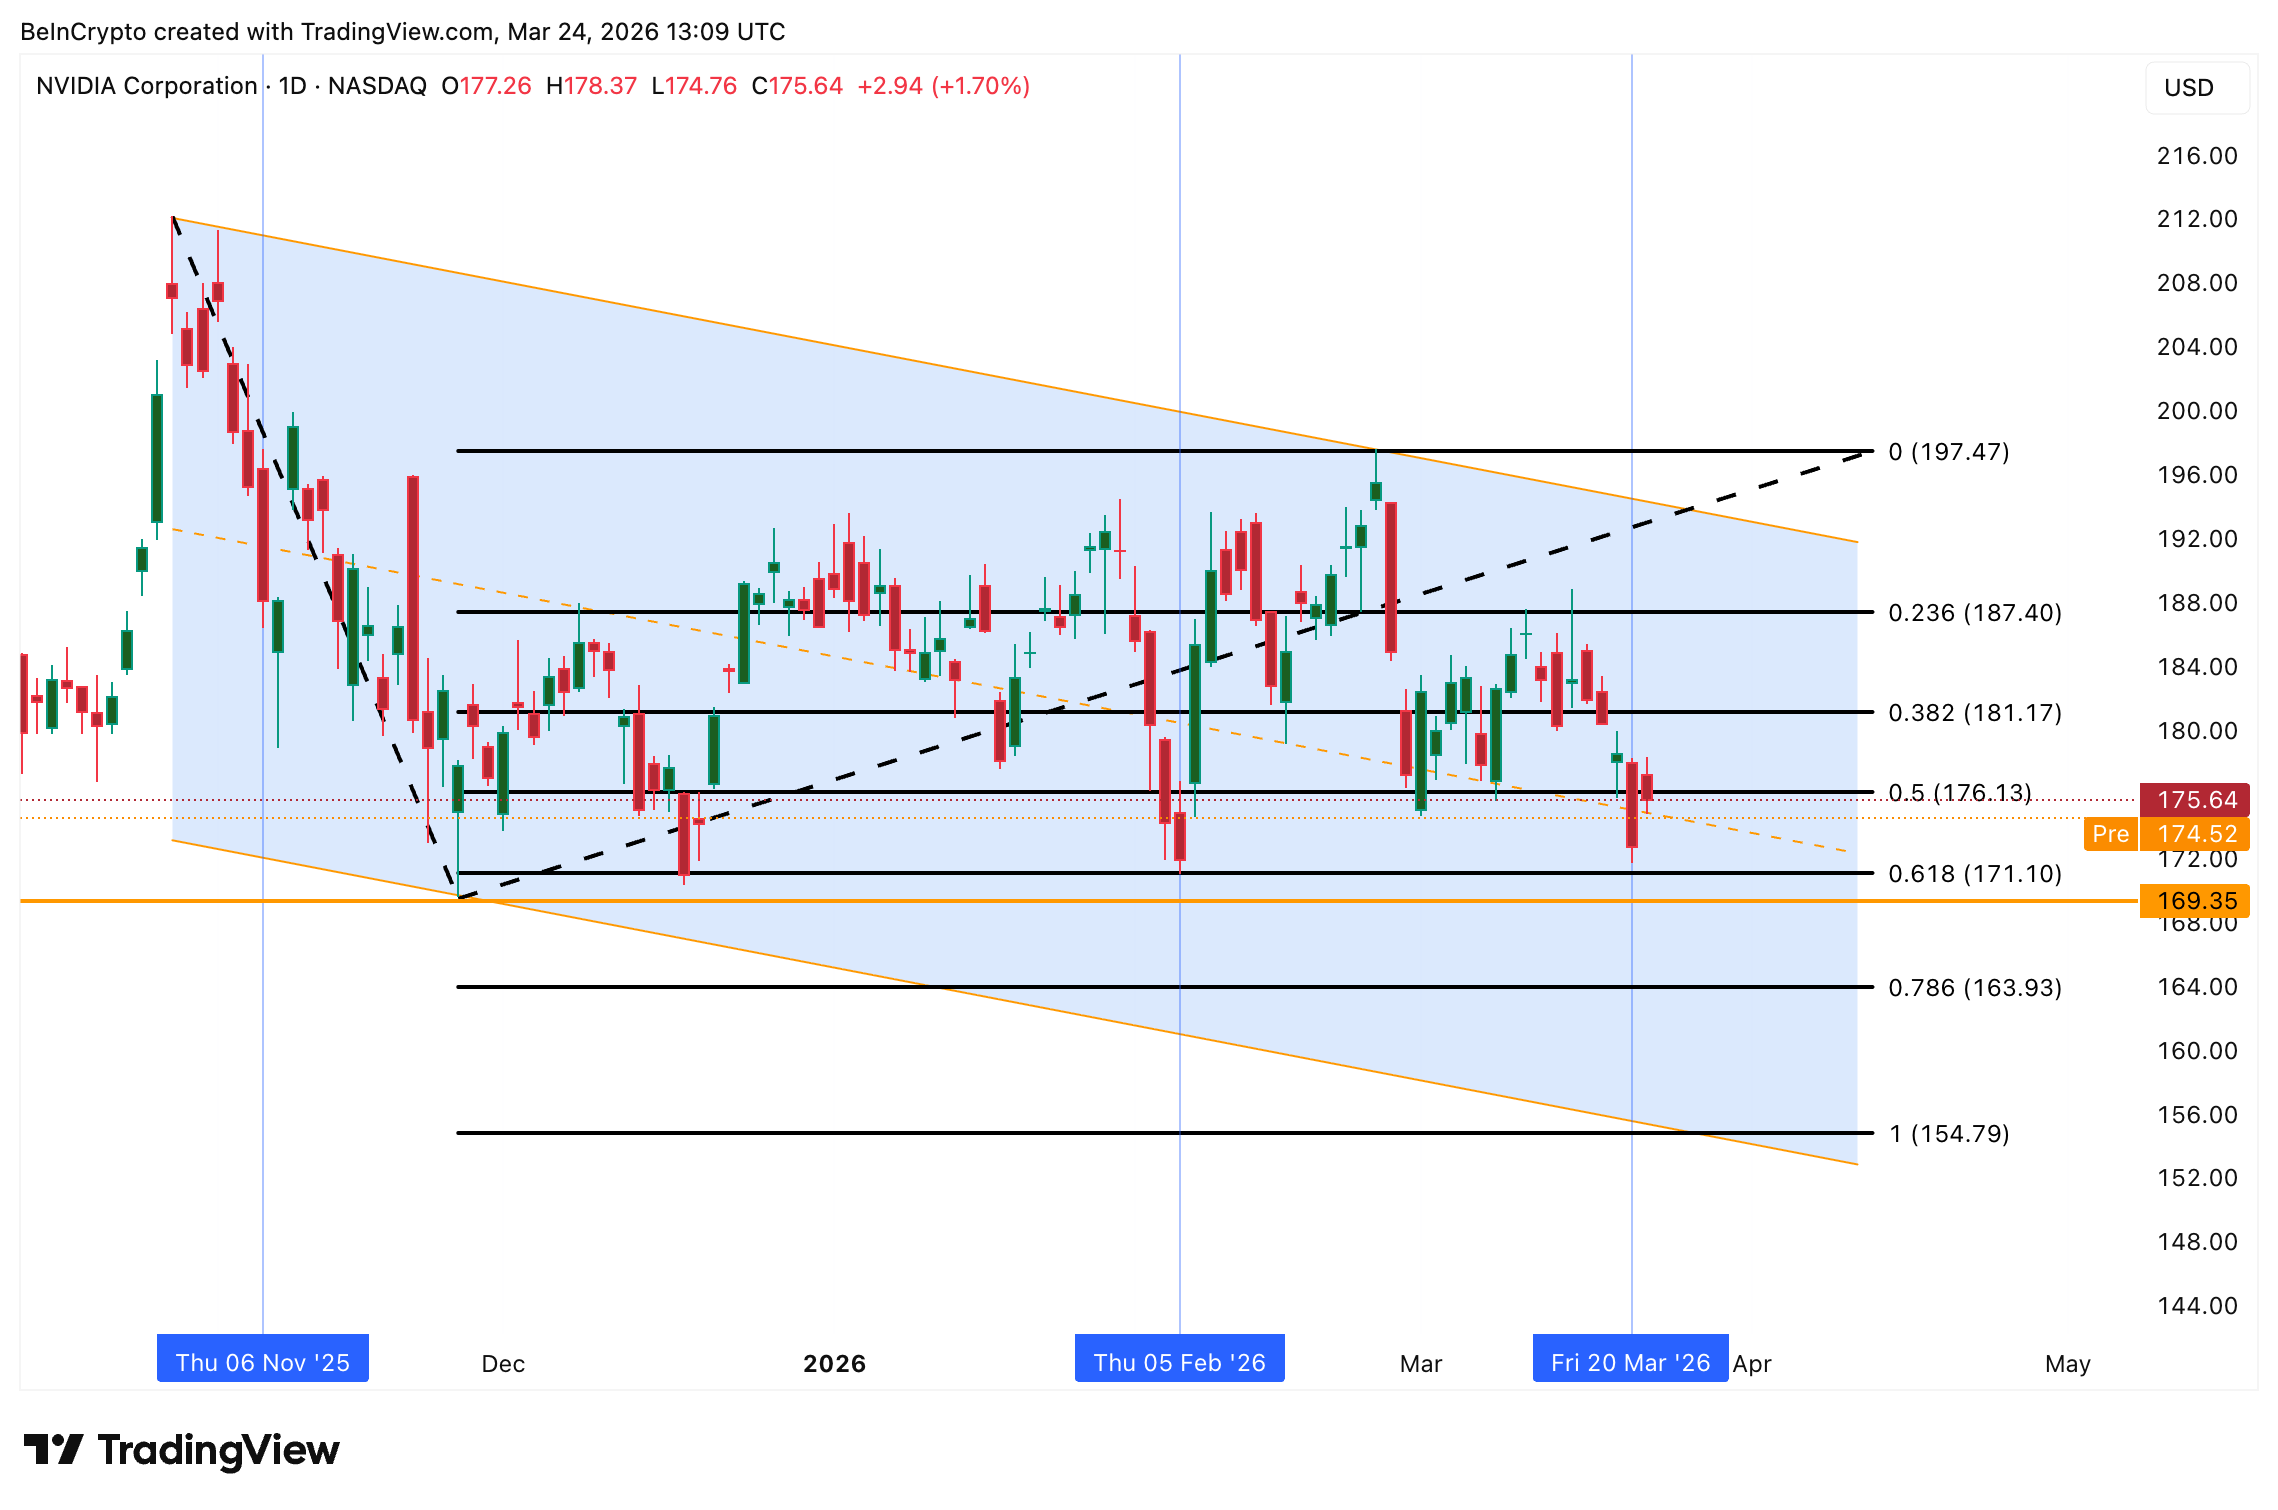 NVIDIA Stock Price Analysis: TradingView
Currently, $171 separates a falling channel that is still technically intact from a breakdown that the CMF divergence, EMA crossovers, and options market are all quietly building toward.
Recommended Articles


