

$870 Million in Solana Supply Unlocks — Does It ‘Flag’ SOL Price Risk?
Solana price has climbed about 5.5% over the past seven days, holding near the $85 level. This rebound followed a sharp decline earlier this month.
But beneath this recovery, a major supply shift is underway. Nearly $870 million worth of SOL has quietly moved out of liquid staking. At the same time, the Solana price continues to trade within a bearish continuation pattern. Together, these signals show why the coming days could decide Solana’s next major move.
$870 Million Supply Unlock Adds New Risk as Solana Price Weakens
The biggest structural change comes from liquid staking activity. Liquid staking allows investors to lock SOL while still receiving a tradable token representing their deposit. This keeps the original SOL locked and unavailable for selling while the liquid staking token trades separately.
Since June 2025, the total amount of SOL locked in liquid staking protocols has dropped from 45.66 million SOL to 35.48 million SOL. This means 10.18 million SOL has exited liquid staking, over 22%. At the current Solana price, this equals approximately $870 million worth of SOL becoming liquid again.
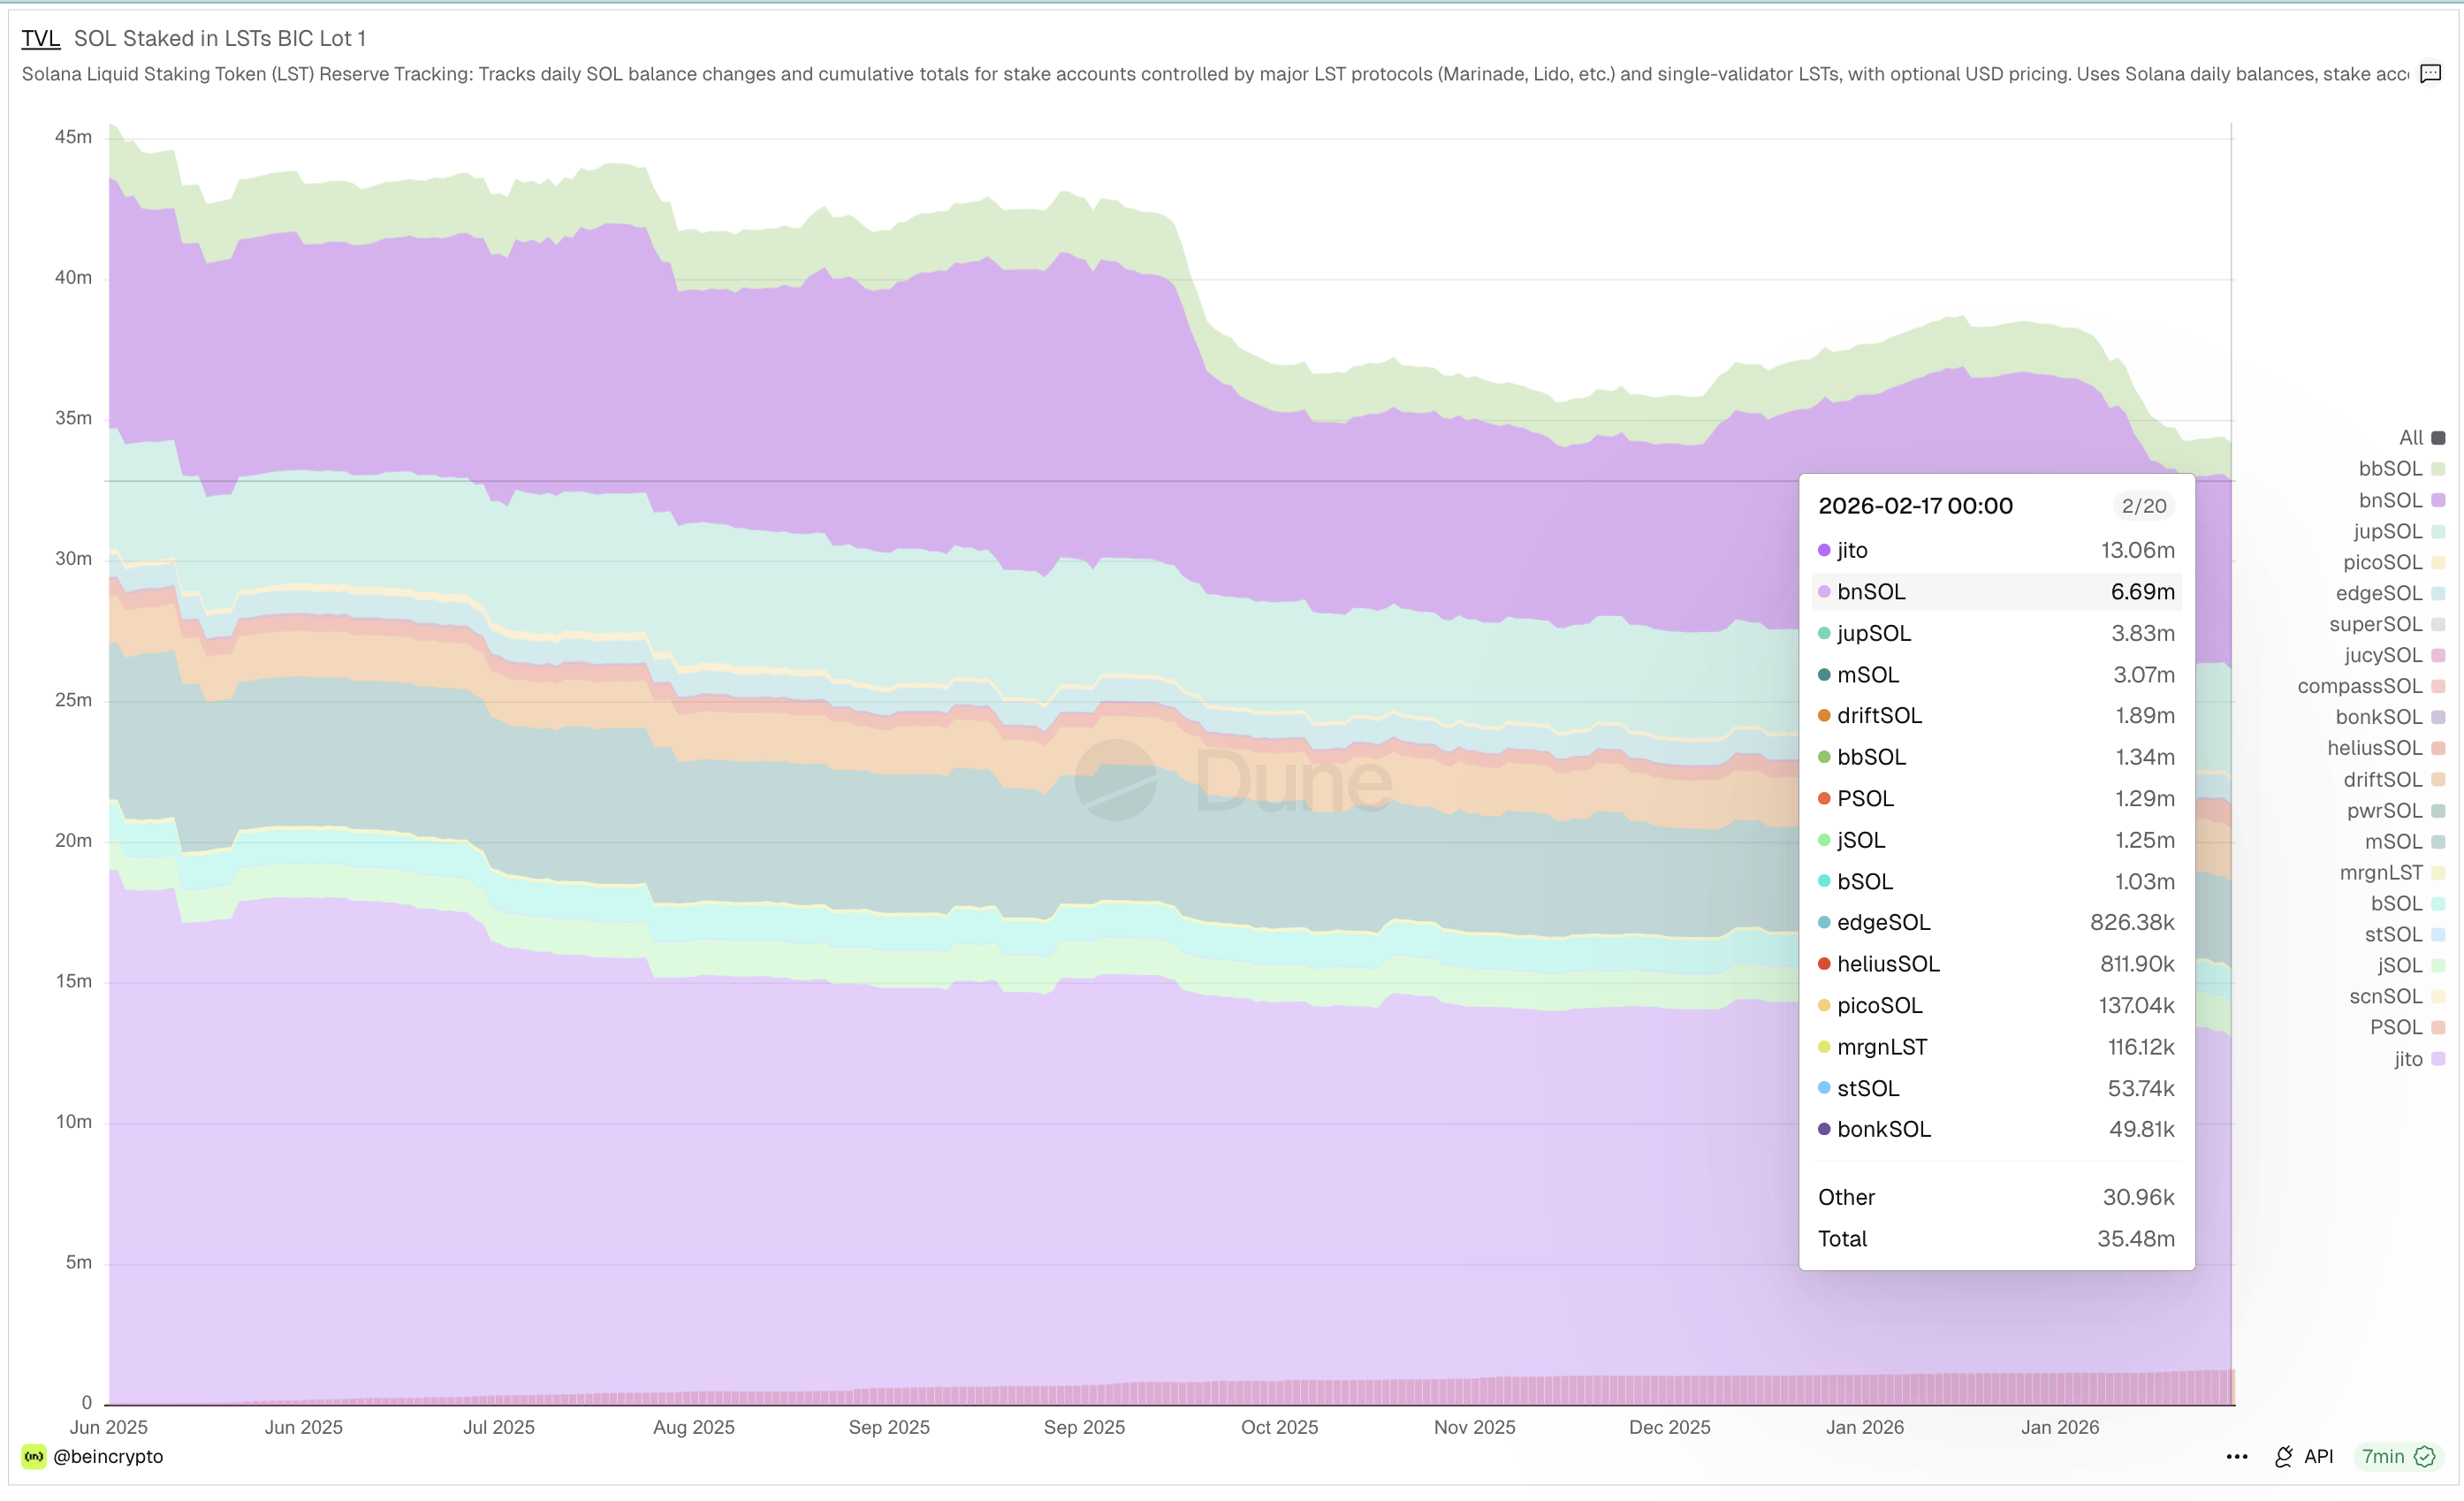 SOL LSTs: Dune
Want more token insights like this? Sign up for Editor Harsh Notariya’s Daily Crypto Newsletter here.
This does not guarantee immediate selling, but it increases the amount of SOL that can now be sold. In simple terms, previously locked supply has become available supply. This increases potential selling pressure if market conditions weaken.
Validator staking trends confirm the same direction. Direct validator-staked SOL has also declined from 423.43 million SOL to 419.07 million SOL in recent weeks. This confirms the shift is not just internal rotation between staking types. Some SOL is leaving locked environments entirely, adding to liquid supply risk.
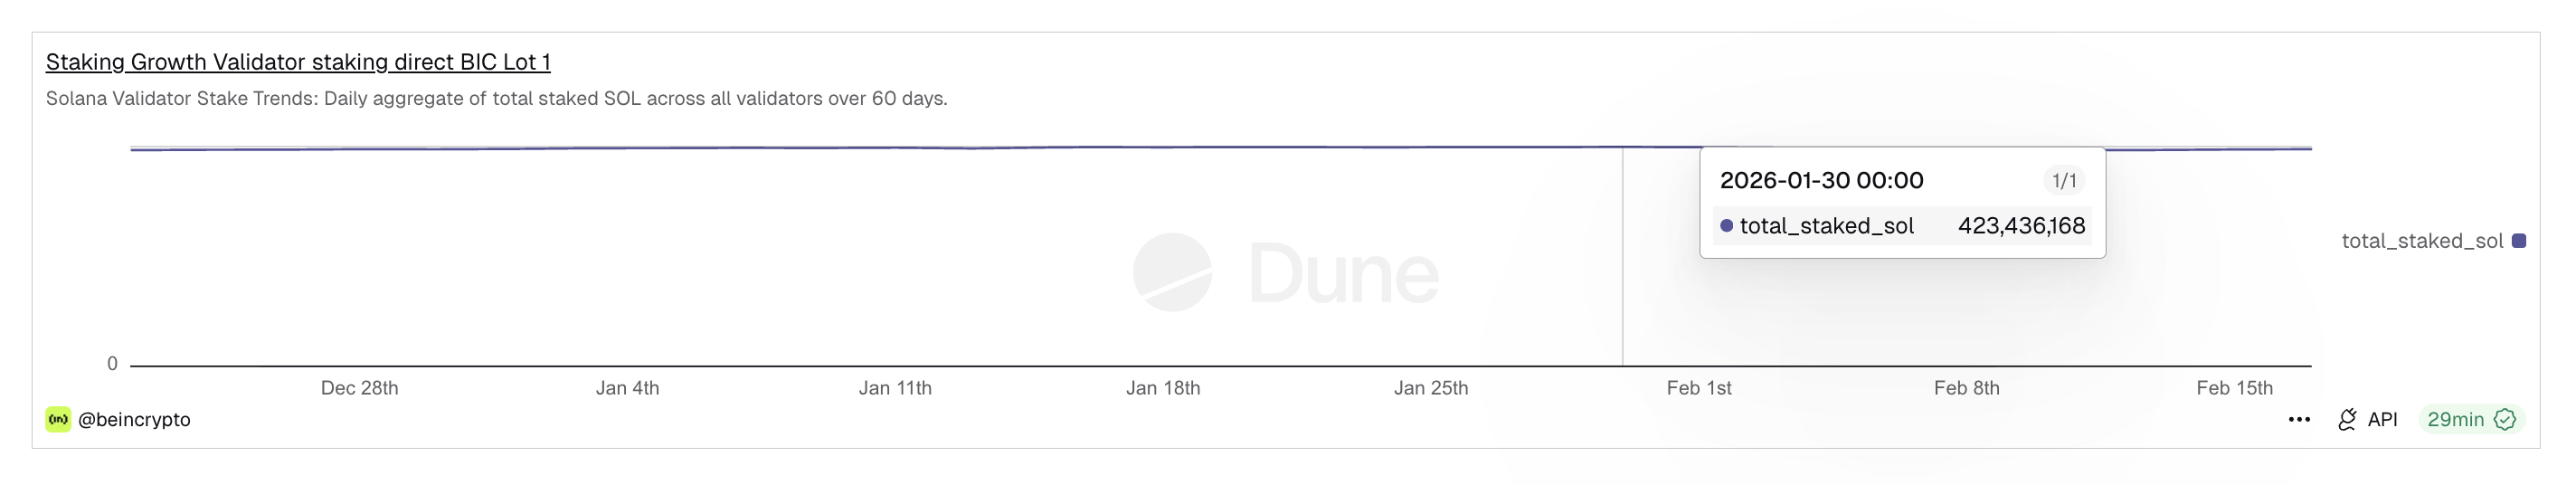 Validator Staking: Dune
This supply shift is happening while the Solana price is already fragile. After falling by over 50%, Solana rebounded. But the recovery stalled quickly, and Solana’s price now trades close to the lower boundary of a bear flag pattern.
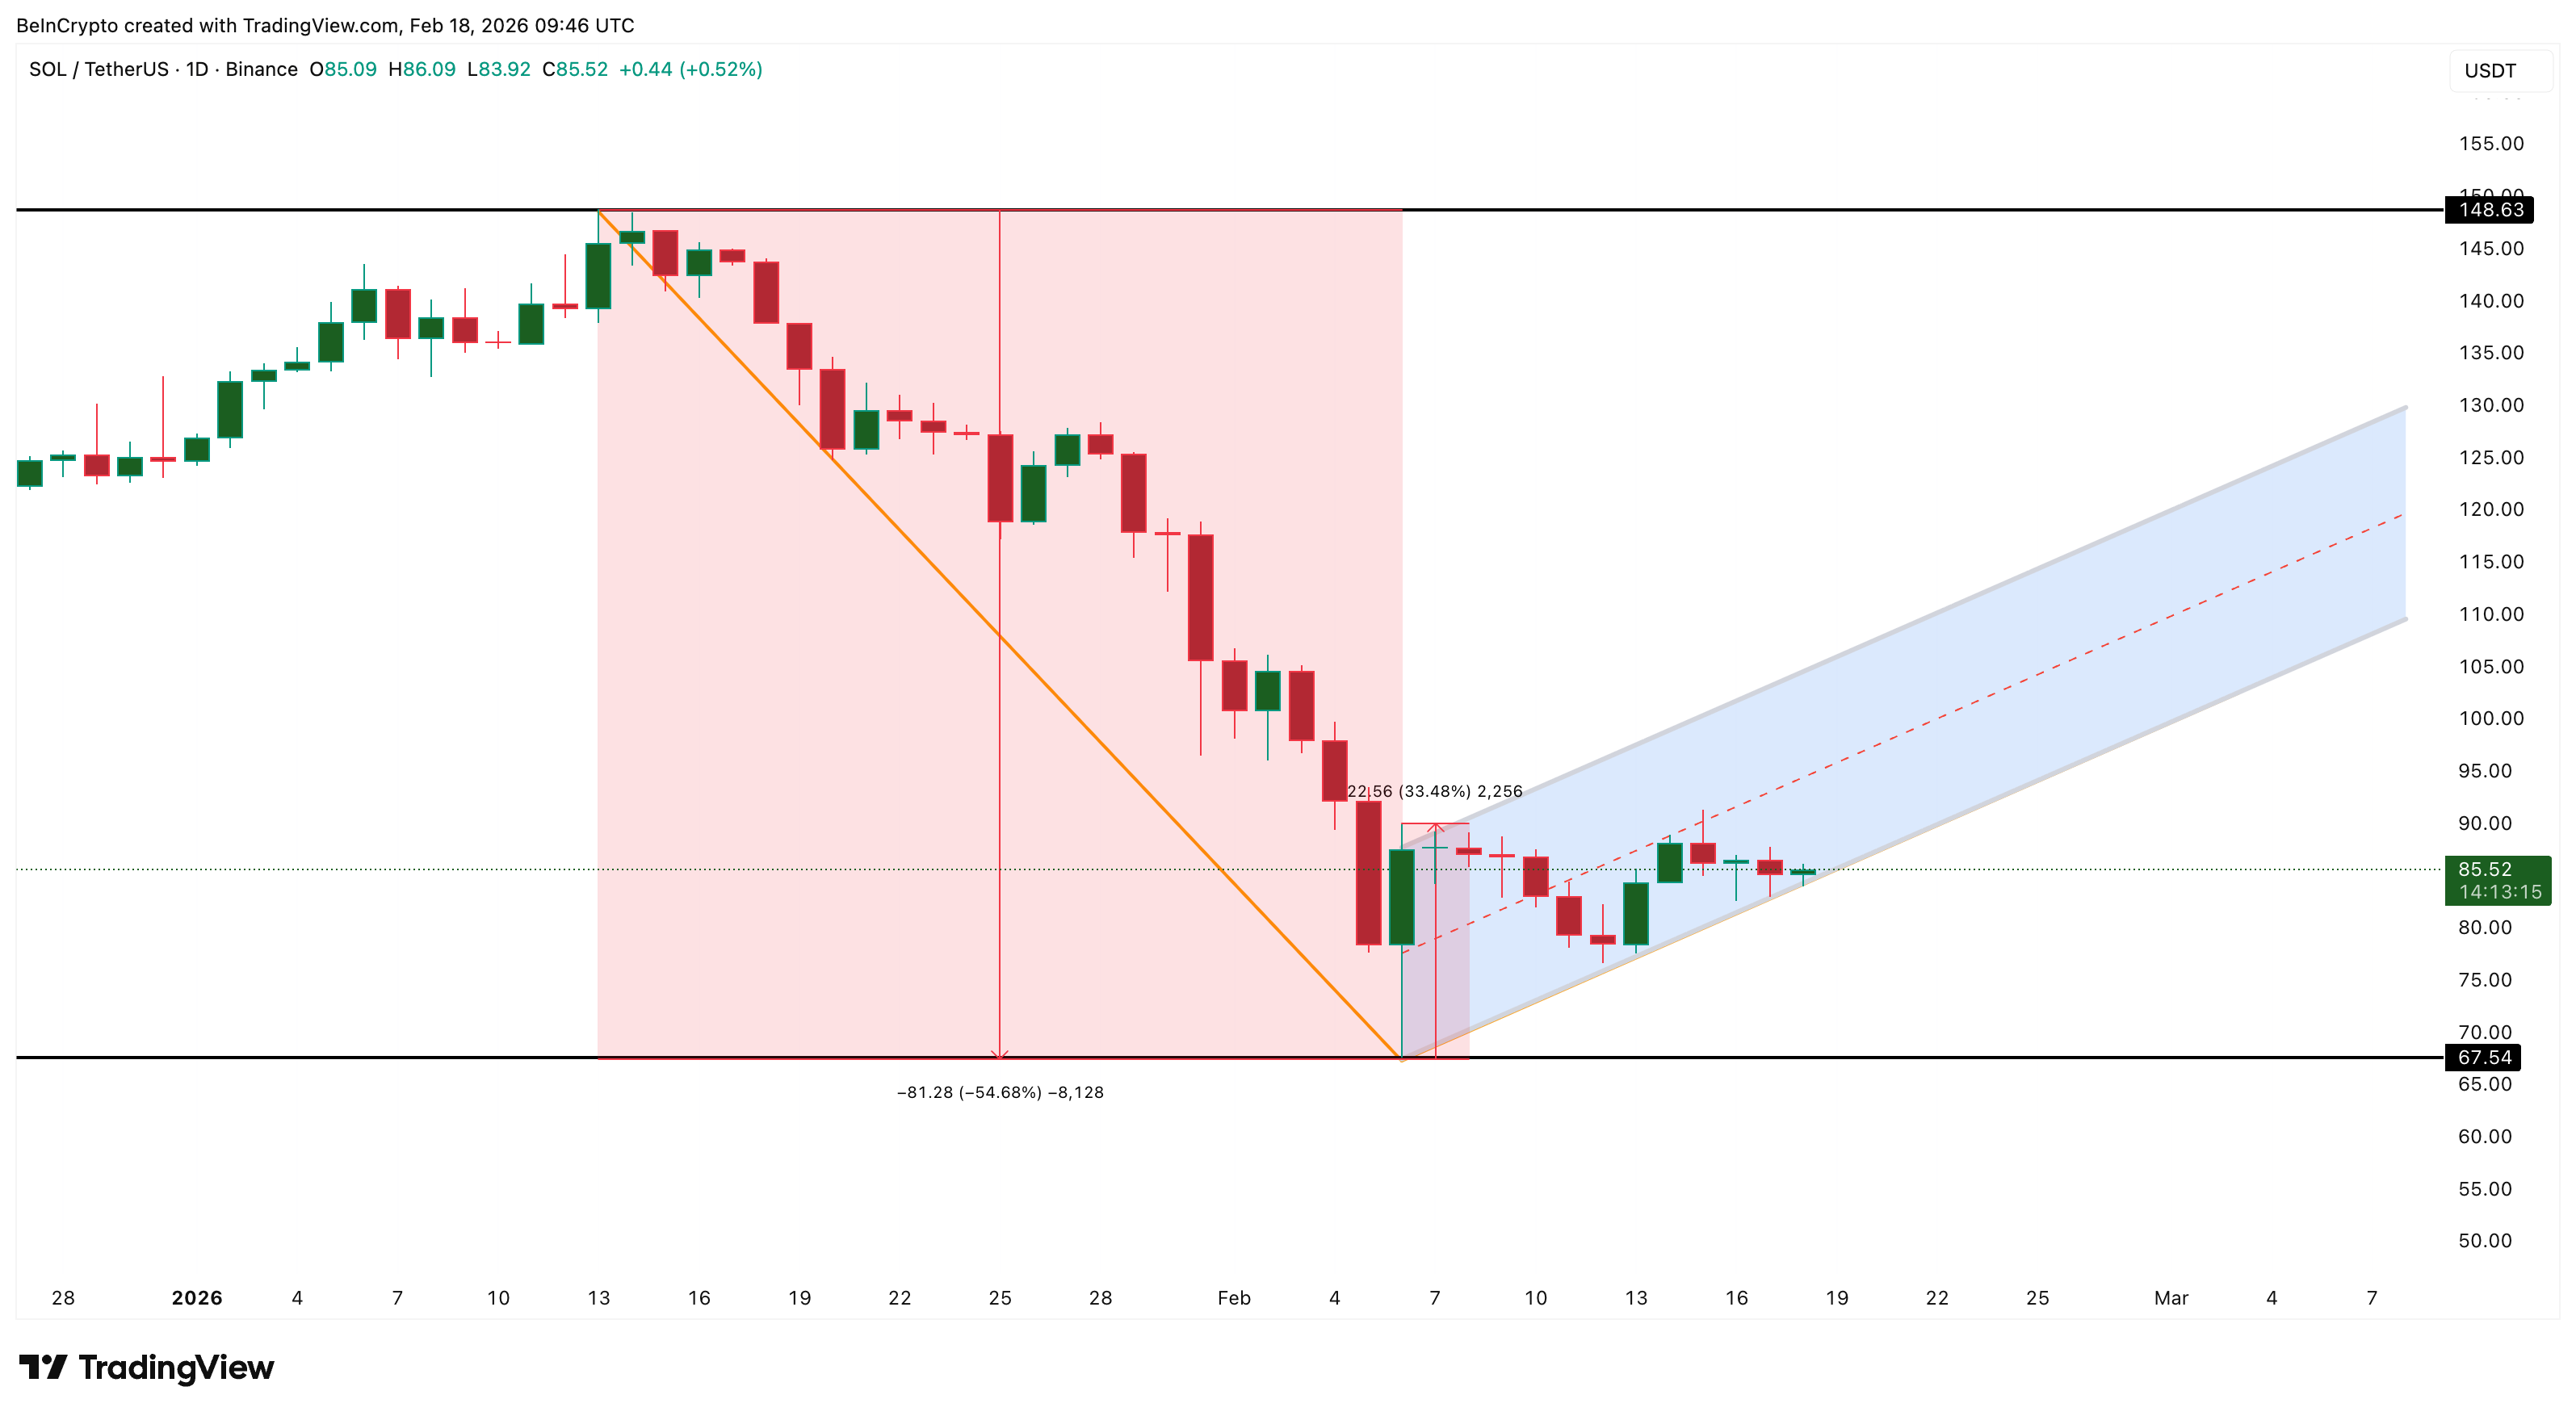 Bearish Pattern: TradingView
Breaking below the lower boundary can trigger a SOL price crash. Whether this happens depends heavily on investor behavior.
Short-Term Holders Increase Supply While Long-Term Holders Step Back
On-chain data now shows weakening conviction among stronger investors and rising influence from short-term traders. One key indicator confirming this is HODL Waves. This metric tracks how long coins remain in wallets before moving and separates supply into short-term and long-term holder groups.
Short-term Solana holders typically hold coins between one day and one week. These investors are more likely to sell during price volatility rather than hold long-term.
Since Feb. 16, the supply held by these short-term holders has increased sharply from 4.58% to 5.85%. This sudden increase means more supply is now controlled by traders who historically sell faster. This raises the risk of sudden selling pressure during price weakness.
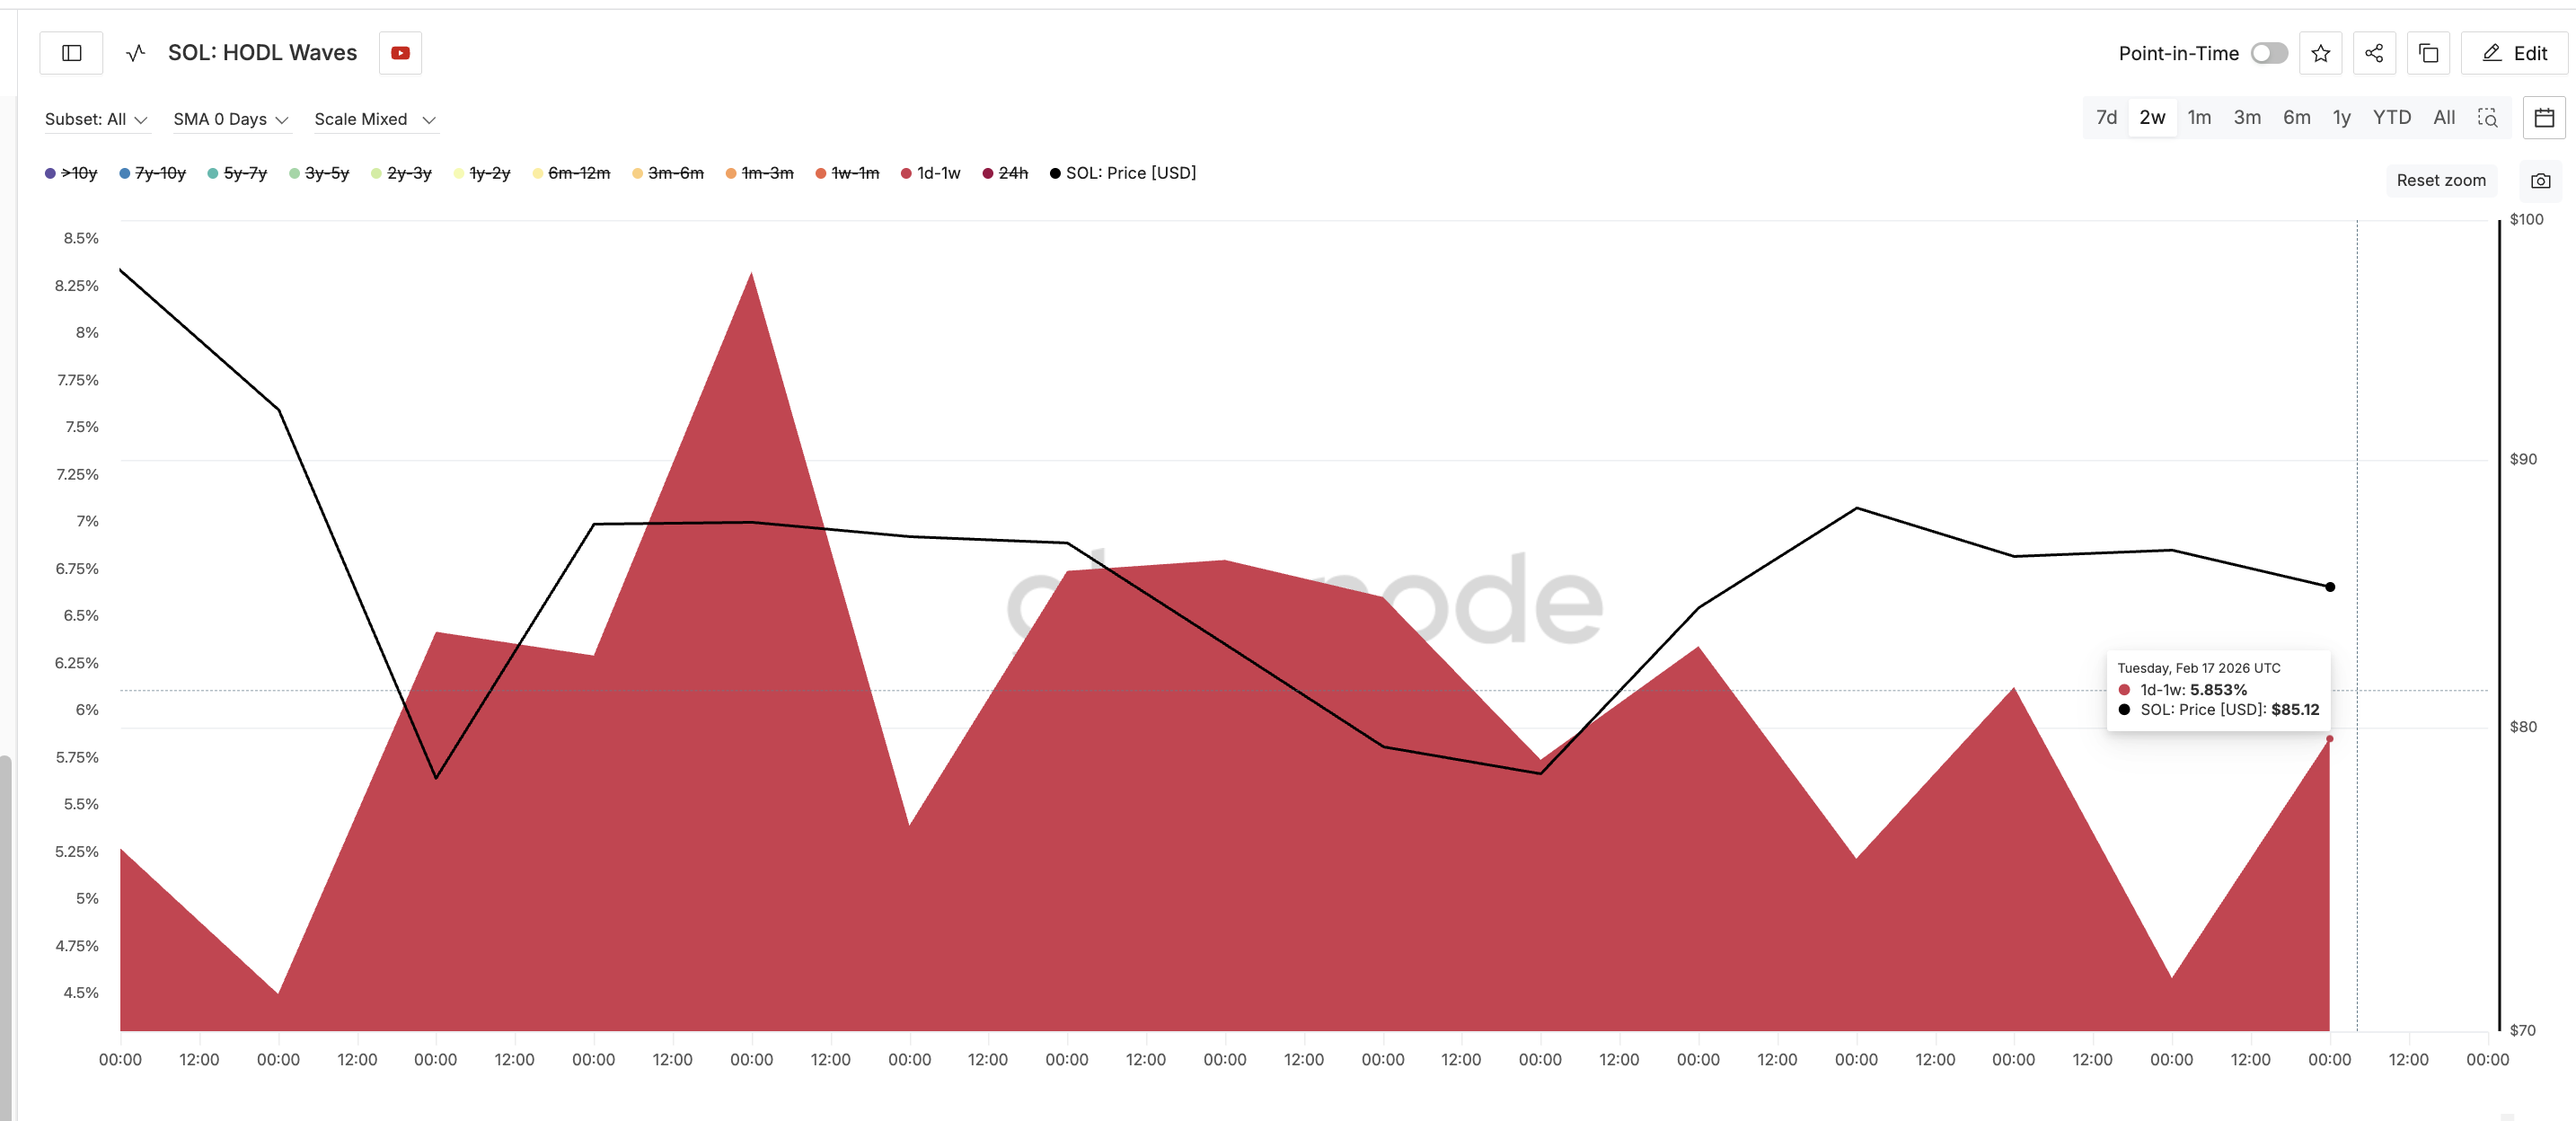 Short-Term SOL Holders: Glassnode
At the same time, long-term holder conviction is weakening. This can be seen using the Hodler Net Position Change metric. This indicator measures whether long-term holders are accumulating or reducing their holdings over time.
On Feb. 3, long-term holders added 2,877,297 SOL on a 30-day net basis. That figure has now dropped to 1,013,353 SOL. This marks a decline of nearly 65%.
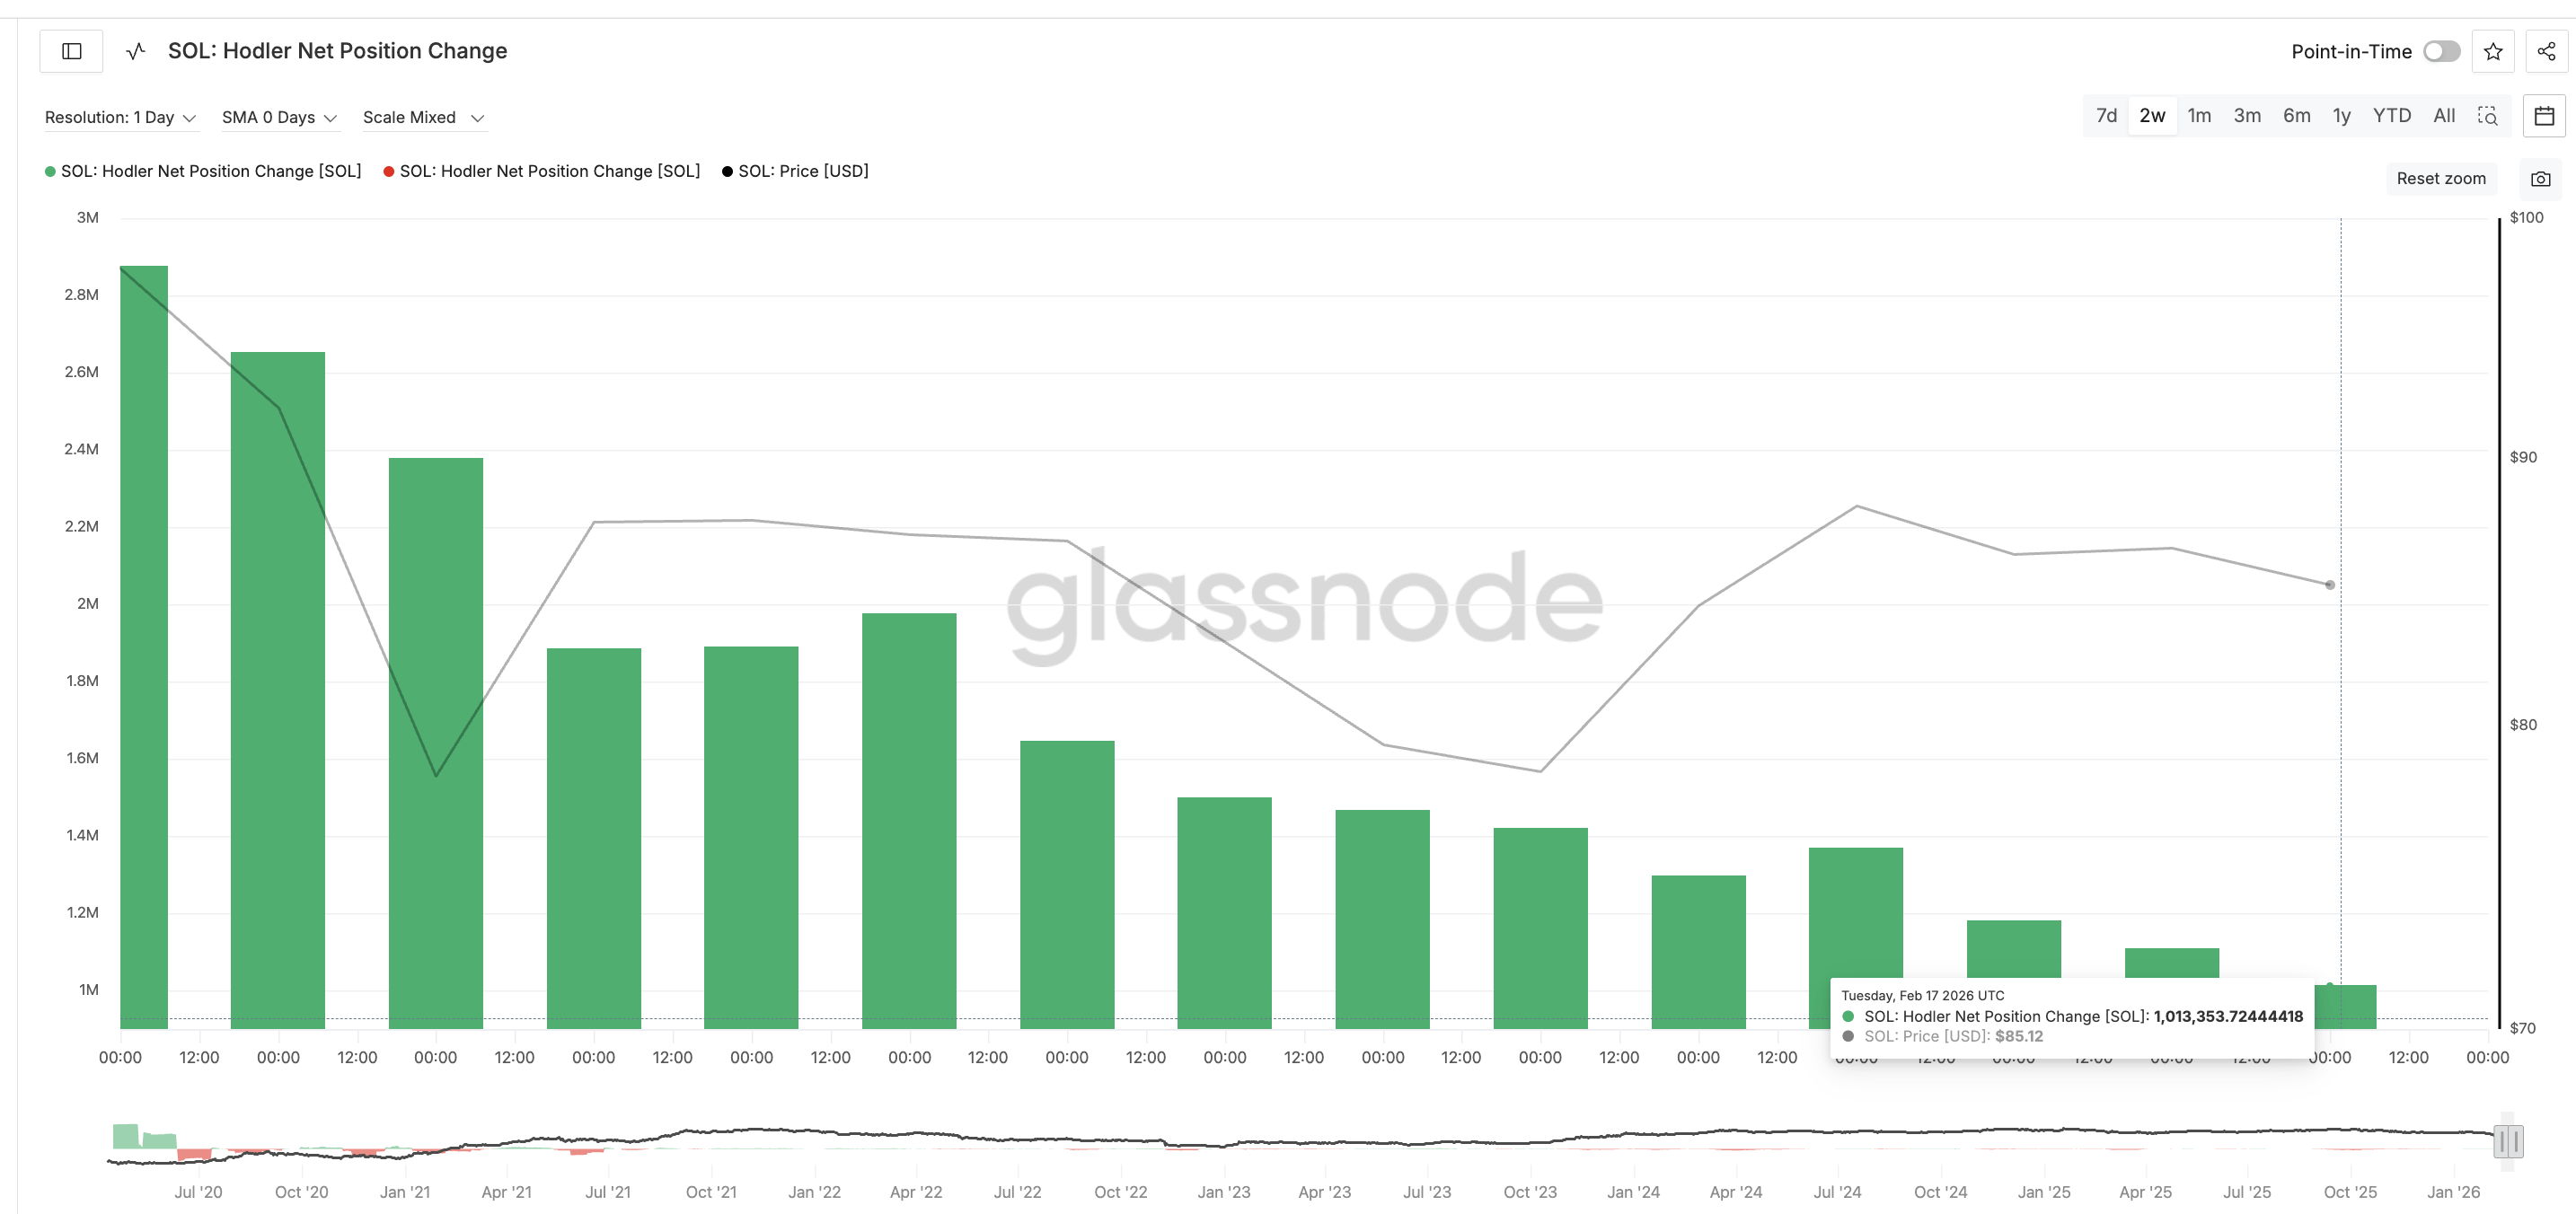 Long-Term Investors Not Buying Enough: Glassnode
This sharp drop shows long-term investors are slowing their accumulation significantly. Long-term holders normally provide stability during corrections because they hold through volatility. When their accumulation slows, the price becomes more vulnerable to deeper declines.
This creates a dangerous combination where the liquid supply is rising, short-term traders control more coins, and long-term support is weakening. Together, these conditions increase downside risk.
Solana Price Levels Show Where the Market Could Go Next
Solana price now sits near a critical technical level that could decide its next trend. If SOL falls below the $82 support level, the bear flag breakdown could begin. The next support levels would appear near $67 and then near $50 as selling pressure increases.
If the full bearish pattern completes, Solana price could fall toward $41. This would represent roughly a 50% decline from current levels and fully confirm the bearish continuation structure.
However, recovery is still possible if buyers return strongly. If Solana price breaks above $91, the immediate bearish pressure would weaken and signal stronger demand returning.
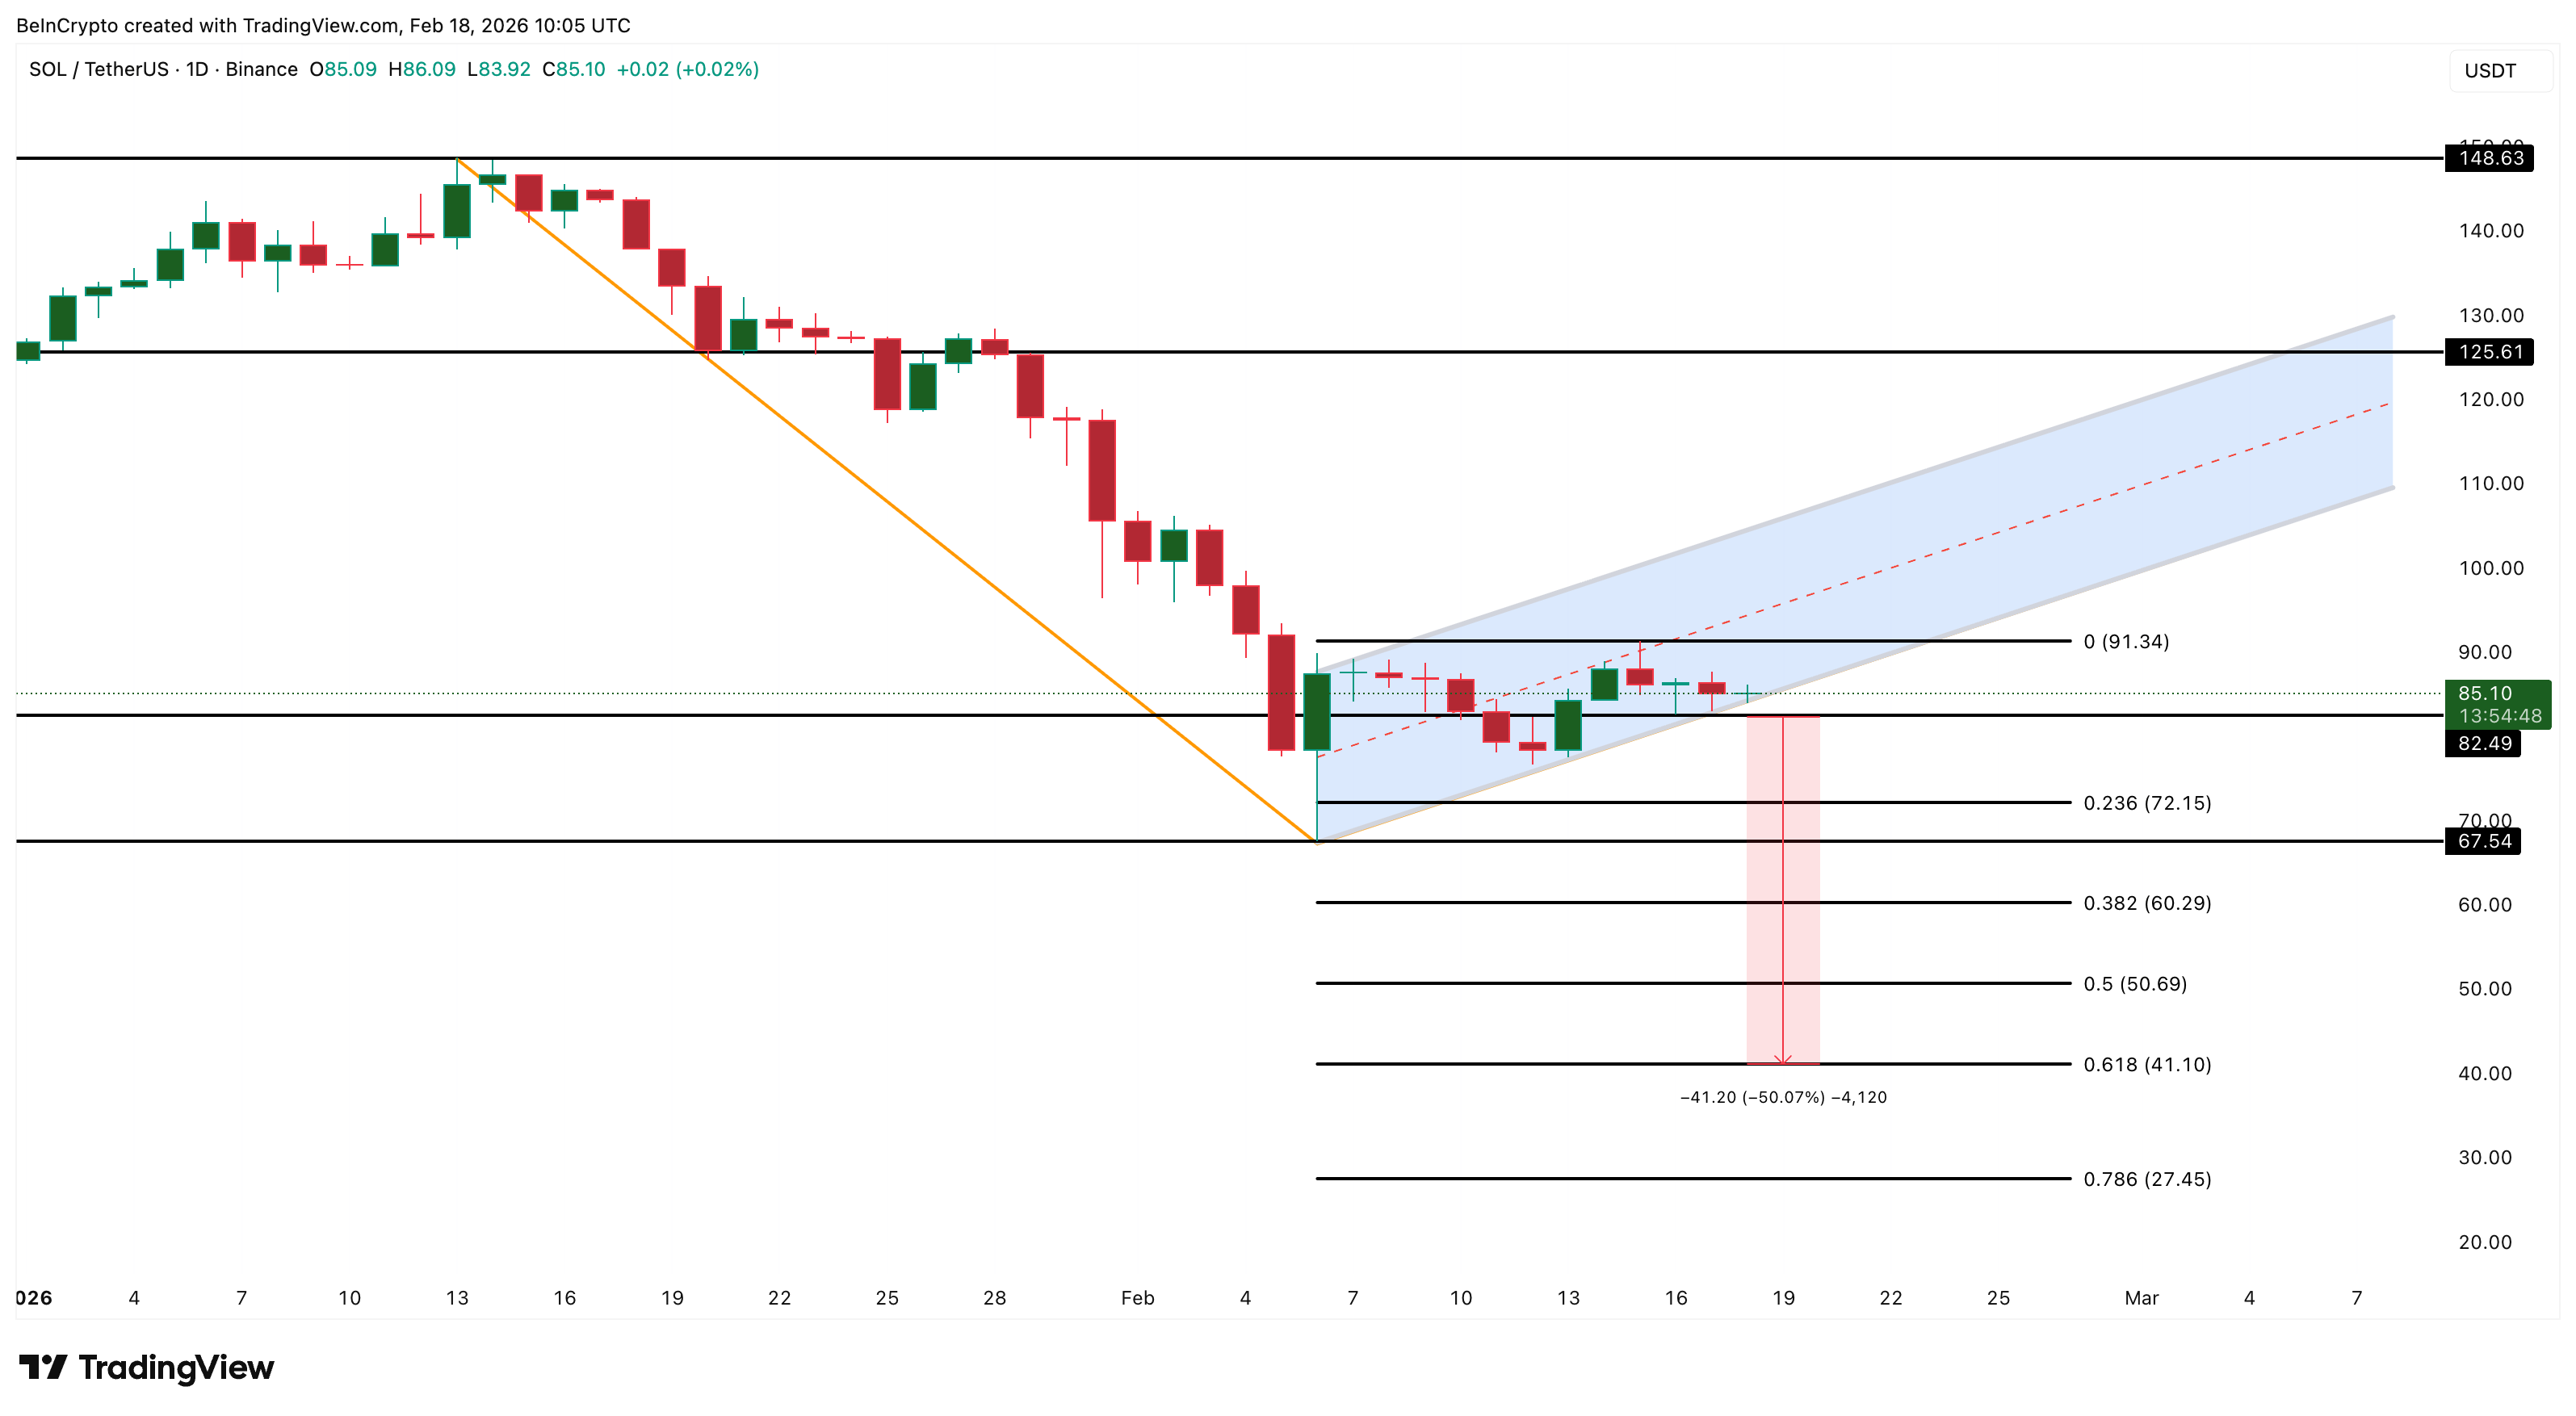 Solana Price Analysis: TradingView
A larger recovery above $125 would invalidate the bearish pattern. But such a move would require strong and sustained accumulation.
Recommended Articles


